1. Introduction
In the aftermath of major floods in the 1990s and extreme flooding in Central Europe in 2002, it was realized that these phenomena pose a serious threat to the economic development and general livelihood of citizens of European Union (EU) countries (Müller 2013; Kienzler et al. 2015). It was also recognized that the lack of coherent legislative and policy actions at the EU level undermines effective flood management (Priest et al. 2016). The result of these considerations was the development and implementation of the so-called Floods Directive (Directive 2007/60/ec of the European Parliament and of the Council of 23 October 2007 on the assessment and management of flood risks). Essentially, the aim of the Floods Directive is to reduce flood risk and control the effects of flooding. Flood risk management, according to the directive, includes preliminary flood risk assessment, development of flood hazard and flood risk maps, and preparing flood risk management plans (Tiukało et al. 2015; Nones 2017). The last includes investments and measures planned to prevent or, where possible, reduce flood risk (Hartmann, Spit 2016).
Flood control investments can simultaneously create conflicts of interest and paradoxically increase flood risk (Schultz 2008; Warner et al. 2018). Cutting floodplains off from the riverbed decreases retention capacity and increases the flood risk in downstream sections (Di Baldassarre et al. 2009; Kienzler et al. 2015). In addition, hydro-technical structures such as reservoirs or dikes can create an artificial sense of security (Di Baldassarre et al. 2009; Wiśniewski 2016), frequently resulting in management and development of behind-levee areas, with catastrophic consequences in the case of structural failures (Schultz 2008; Di Baldassarre et al. 2009; Kienzler et al. 2015). As indicated by Warner et al. (2018), an increase in the economic value of land in built-up areas protected by levees turns a flood risk situation from one of “high flood frequency and low consequences” to one of “low flood frequency and significant consequences.” Polders may be an example of such facilities. They are often created in the areas behind the levees, allowing agricultural use of the land. During flood wave propagation, they provide additional retention capacity through a system of hydraulic structures (Bouwer et al. 2009; Warner et al. 2018). As a result, the management of lands protected by dikes and flood protection facilities leads to changes in social structures, decision-making power, and trade-offs between when and how much water is extracted or discharged. Furthermore, flood risks are redistributed among stakeholders (Warner et al. 2018).
The redistributed flood risk applies to many areas worldwide (e.g., Huang et al. 2007; Ungvári, Kis 2021), including the Warta River Valley from Konin to Sługocin (Wielkopolska region, Western Poland). Until the 1980s, the Warta River Valley was characterized by un-embanked floodplains, protecting the downstream areas against floods, e.g., the city of Poznan, the fifth most populous city in Poland. The situation changed with the construction of the Jeziorsko Reservoir, which was officially commissioned in 1986. The investment resulted in additional flood protection plans for drained agricultural areas along the Warta River in the Konin-Pyzderska Valley (Ilnicki et al. 1987). As a result, a significant river reach was embanked, limiting the natural retention of the valley and shifting the task of flood wave reduction to the Jeziorsko Reservoir. In the course of the reservoir’s operation, however, it turned out that when unfavorable factors occurred simultaneously, such as maintaining a normal water level in the reservoir in advance of a peak flood wave, the flood reserve of the reservoir is not sufficient to reduce the flood wave volume to the required extent. Consequently, a decision was taken to increase the retention capacity in the Warta River Valley, by building the Golina polder below the Jeziorsko Reservoir. The area of the polder was completely flooded during a high water event in 2010, exposing the negative effects of the illusory safety of the Golina polder and the lack of adequate facilities and procedures that would allow safe and optimal use of the structure. Conflicts of interest among local residents (who used sandbags to protect the polder and their properties from flooding), and the threat that controlled drainage of water from the polder could not be accomplished came to the fore. Following the flood of 2010, several initiatives were undertaken to improve the operation of the Golina polder. At the request of the Wielkopolska Voivode, the Regional Water Management Board in Poznań undertook efforts to transform the polder into a fully controllable flood control structure.
Controlled operation of polders provides a higher-value risk mitigation service per unit of land area, assuming it is technically feasible to open high-flow-through-capacity floodgates at the optimal hydrological moment to cut off and store the top of the flood wave that poses the greatest threat (Ungvári, Kis 2021). Hence, there is a distinct economic decision point warranting the opening of the floodgate only under a controlled inundation case. However, design, operation, and management of large flood protection facilities may be a difficult problem for decision-makers and structure operators (Fayaed et al. 2013). Therefore, hydrodynamic simulations and optimization algorithms have been highlighted in the scientific literature as auxiliary tools for these decisions (Huang et al. 2007; Fayaed et al. 2013; Dobson et al. 2019). Hydrodynamic modeling has been widely adopted in practice in EU countries, for example, as a result of implementing the Floods Directive (Myronidis et al. 2009, Tsakiris 2014; Nones 2017). For polder systems, 2D hydrodynamic modeling was used, for instance, to analyze the effectiveness of capping the peak discharge of an extreme flood event in the Elbe River in Germany (Huang et al. 2007). In contrast to hydrodynamic modeling, case studies of the application of optimization algorithms to polder operations are few. Optimization refers to a mathematical formulation in which an algorithm is used to compute a set of decision variable values that minimize or maximize an objective function subject to constraints (Fayaed et al. 2013; Dobson et al. 2019). There are many optimization methods, which include implicit and explicit stochastic optimization (e.g., linear programming, stochastic dynamic programming), computational intelligence (e.g., fuzzy set theory, artificial neural networks), multiobjective optimization, and simulation-optimization techniques (Ko et al. 1992; Le Ngo et al. 2007; Rani, Moreira 2010; Fayaed et al. 2013). Nevertheless, complicated mathematical algorithms are difficult to apply in practice and thus, hydrodynamic simulation methods remain the strategic instrument for planning and management of flood protection system studies. Additionally, most of the mathematical optimization algorithms so far have been applied to analyses of reservoir operations (e.g., Le Ngo et al. 2007; Bashiri-Atrabi et al. 2015; Côté, Leconte 2016; Lai et al. 2021). One of the few examples of polder operation optimization involves fuzzy set rules and their application in multi-criteria decision-making to develop a flood retention plan (Schumann, Nijssen 2010).
The aim of our study was to design an effective operational alternative for the Golina polder to reduce flood hazard in the Warta River Valley. Considering the difficulties associated with the practical application of advanced optimization methods, we implemented a trial-and-error approach to the development of computational variants. Our approach was based on 1D/2D hydrodynamic modeling and staged analyses of alternatives, which evaluated differing locations and parameters of the inlet and outlet control structures. Various control scenarios for flooding and draining the polder were also considered. The approach as implemented has proven to be effective, thus, our simplified trial-and-error staged variant analyses may be a valuable clue for practitioners. The basis for building the computational variants was our practical experience and evidence gathered during the polder flooding in 2010. For this reason, this paper also presents detailed information about the flood event in the Warta River Valley from Konin to Sługocin in 2010. This information and evidence gave a broader context to our study and may be valuable to other researchers in future analyses. The results of our calculations were the basis for developing documentation for the Regional Water Management Board in Poznań, indicating the means for effective polder operation and the scope of hydro-technical investments required.
2. Study area and the 2010 flood event
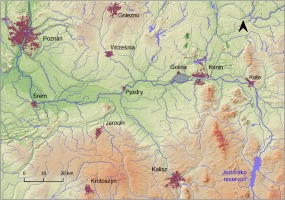
The Golina polder is located on the right bank of the Warta River below the town of Konin (Fig. 1). The area of the Warta River Valley from Konin to Sługocin is a part of the mesoregion of the Konin Valley and a part of the Warsaw-Berlin Proglacial Valley. In the northern part, the edges of the valley form distinct escarpments, while the southern ones are much gentler. The valley is relatively wide, 4-6 km, filled with sandy loam, medium loam, and hydromorphic soils, in which strong fluvial processes have created varied relief (Ilnicki et al. 1987). The existing Golina polder is limited on the east by a permanent concrete overflow, on the south by the right-bank levee of the Warta River, on the west by the A2 highway embankment (Poznan-Warsaw) and on the north by the high bank of the Konin-Pyzderska Valley (Fig. 2). The land constituting the Golina polder area is located within the administrative borders of three communes: Golina, Rzgów, and Stare Miasto. The Golina polder area is about 2900 ha. On the section of the Warta River analyzed there are flood embankments that narrow the natural floodplains. The smallest width between the embankments near the Sławsk water gauge is ~350 m. The main riverbed in the section analyzed is ~50 m wide, and the length of the river along the Golina polder is 11.5 km. The water gauge station Sławsk is located on the left bank of the Warta River. In the water gauge cross-section, the depth is ~2 m at bankfull stage.
Fig. 2.
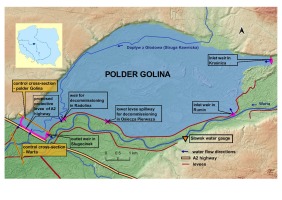
Location of existing hydro-technical facilities in the Golina polder and assumed possibility of water exchange between the polder and the Warta riverbed.
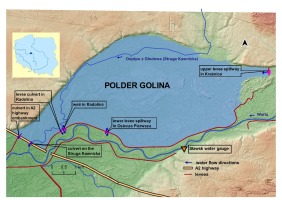
Current, uncontrolled utilization of the Golina polder is possible because of the following hydro-technical structures:
− lower levee spillway in Osiecza - concrete spillway, 200 m long with the elevation of the crest 80.30 m a.s.l.;
− weir in Radolina - with gates 3×4.0 m;
− levee culvert in Radolina - with Ø 3×1.2 m;
− culvert in A2 highway embankment - Ø 2×1.6 m;
− culvert in A2 highway embankment on Struga Kawnicka – Ø 2×1.6 m;
− right and left levees of the Warta River.
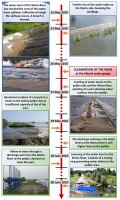
Primarily, the inability to control the water flow through the polder led to the danger of catastrophe during the flood event in 2010. On 22nd May 2010, i.e., four days before the flood peak, the water surface elevation at the Warta River reached the level of the upper levee spillway. During the first hours, the flow of water into the polder was prevented by sandbags placed on the crest of the levee spillway by local residents. As a result, excessive water was dammed up above the structure and significant water infiltration through the embankment led to sliding of the slabs forming the top layer of the spillway. The resulting breach reached a width of about 15 m (after the flood wave culmination it was about 16 m). In the following hours, the water level increased systematically in the Warta River, which caused the sandbags placed in several other places to be washed away. Sandbags were also placed on the lower levee spillway.
Although the ordinates of the water level during the peak exceeded the ordinate of the spillway crest, they prevented the inflow of water to the polder.
When water started to flow into the polder area through the upper levee spillway, the weir in Radolina remained closed. Therefore, on 27th May, a day after the peak, the water levels on the polder side and in the Warta riverbed equalized. This situation caused weir gates to be raised, allowing water to flow away from the polder area. However, under these conditions the capacity of the structure was insufficient.
Additionally, at the weir, the water surface elevation on the riverside was close to the water level in the polder, which also impeded water outflow. In the following days, the water surface elevations in the polder began to exceed the water level in the riverbed. The complete opening of the weir did not help, because water was still flowing into the polder in an uncontrolled way through the breach near the upper levee spillway. As a result, the A2 highway was in danger of being closed; although its embankment limits the polder from the west, it is not adapted to serve as a levee. Therefore, it was decided to drain the water from the polder by an additional breach in the levee. The work started on 29th June about 300 m above the A2 highway embankment. The width of the crosscut was ~25 m. The water level in the polder started to decrease, and on 3 June the weir was closed to prevent inflow from the river. Further, on 7 June, a closing ring was constructed in the location of the damaged upper levee spillway (Fig. 3).
3. Materials and methods
3.1. Hydrodynamic models
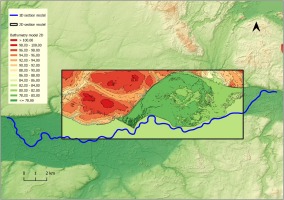
Variants leading to an effective scenario for Golina polder operation were calculated by coupled 1D/2D hydrodynamic model. The model consisted of a one-dimensional section (1D, developed in MIKE11 software), which included the embanked Warta River Valley from km 369+500 to km 400+000, and a two-dimensional section (2D, developed in MIKE 21 software) of the Golina polder (Fig. 4). The basic input data for modeling were topographic data. A digital elevation model (DEM) with a grid size of 1 m, acquired through laser scanning technology (LIDAR), was used as source data for topographic relief of the floodplains. Measured cross-sections of the riverbed were used to represent the channel bathymetry. In the 1D part of the model, valley cross sections (combinations of channel cross sections and cross sections through the floodplains) were implemented. In the 2D part, a generalized DEM was used. The generalization procedure was performed using the nearest neighbor method, creating a grid with 1.4 million cells, each 8×8 m. The processed DEM was also updated with measured elevations of the levees.
Fig. 4.
The computational domain of the coupled 1D/2D hydrodynamic model of the analyzed Warta River section and Golina polder.
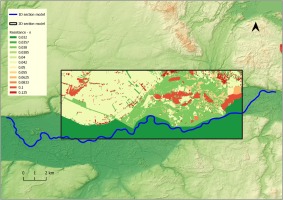
Subsequently, Manning’s roughness coefficients were defined, with preliminary values based on Ven Te Chow’s tables (Chow 1959). The data used were topographic maps at the scale of 1:10000, orthophoto maps, Corine Land Cover, and information and photographs from the field inspection. It was assumed that the area below the designed weirs was not overgrown with bushes that could hinder the polder inflow. The values of roughness coefficients ranged from 0.025-0.12 [s/m1/3]. In the 1D part, the values were assigned to cross sections, while in the 2D part roughness coefficients were implemented as a grid file (Fig. 5). Existing hydro-technical structures were also implemented into the model.
Fig. 5.
The grid presenting Manning roughness coefficient variability within the 2D hydrodynamic model.
The 1D and 2D models were connected using the MIKE FLOOD module, by standard link connections (DHI 2011b). In the case analyzed, this connection consisted in assigning the first or last computational cross-section in the 1D model to the appropriate computational cells in the 2D model, so it was used on both the inflow and outflow from the 2D model area at sites of hydro-technical structures. The water exchange was simulated by draining the flow at the lower boundary condition of the 1D model and feeding it to selected computational cells of the 2D model. The water exchange could also be modeled by draining water from selected computational cells of the 2D model, in place of the upper boundary condition of the 1D model, or the opposite (DHI 2011a). Furthermore, using the Dam Break module in the 1D model (DHI 2011a), for calibration purposes breaches were defined based on evidence and measurements obtained during the 2010 flood. The breaches were defined at the location of the upper levee spillway and close to the A2 highway, in the location of the excavated levee crosscut. The model was calibrated based on data from the 2010 flood event. Several types of data were employed for the process of calibration: measurements of water level in the polder area during the flood, information about the operation of hydro-technical structures and levee crosscut (information from Voivodship Authority of Land Reclamation and Water Structures – WZMiUW, and field observations), and observed hydrological data at the water gauge Sławsk. The parameters of the breach, such as the width, depth, and time of the breach formation were predefined based on the measured data (during and after the flood) and information obtained from the WZMiUW. Parameters that were optimized were roughness coefficients and parameters of the breach of the upper levee spillway. The aim was to obtain the smallest possible differences between calculated and observed flow and water surface elevation hydrographs in the Warta River, and between calculated and observed water surface elevations in the polder. To assess the calibration performance for the water gauge data, the following parameters were determined (Książek 2010): coefficient of determination (R 2), absolute and percentage error of water surface elevation at the peak of the flood wave (ΔHmax, %ΔHmax), absolute and percentage error of flow at the peak of the flood wave (ΔQmax, %ΔQmax), and root mean square error (RMSE). Parameters used for assessment of the calibration performance at the Golina polder included coefficient of determination and absolute and percentage error of water surface elevation at the peak of the flood wave. Because the Golina polder was completely flooded only once, in 2010, no additional data were available for model verification. For this reason, model verification was not performed.
3.2. Calculation variants
The calibrated model was used for calculations of variants aimed at determining the most effective scenario for reducing flood hazard by controlled polder operation. The alternatives analyzed accounted for the different locations of hydro-technical structures at the inlet and outlet of the polder, their parameters, and the complexity of the operating rules. The most effective variant was understood as the one which provided the greatest reduction of maximum flow on the Warta River below the Golina polder, while taking advantage of the polder’s retention capacity, the possibility of effective water supply and discharge from the polder area, and the feasibility of practical implementation of the variant (due to costs and complexity of operating rules). First, the calculations were carried out for the variant “0” (W0), which assumed no possibility of flooding the Golina polder through inlet and outlet structures and overtopping the levees. Subsequent calculation variants were tested in stages using a trial-and-error approach. In the first stage, the methods of flooding the polder were varied, while in the second stage, to increase the efficiency of the polder operation, different parameters and locations of new structures were tested. In the third stage, the final scenario of polder operation was selected and tested. Alternatives in subsequent stages were determined based on the results of previous stages, as well as experiences from the 2010 flood and consultations with the Regional Water Management Board in Poznań.
The efficiency of the analyzed polder operation variants was qualitatively assessed using the following criteria:
K1 – flooded area of the polder;
K2 – duration of water presence in the polder;
K3 – the maximum volume of water in the polder;
K4 – the maximum water level in the Golina polder close to the A2 highway;
K5 – the maximum water surface elevation and percentage reduction of maximum flow (relative to variant W0) in the control cross-section located on the Warta River, downstream of the A2 highway;
K6 – the possibility of practical implementation of the variant (based on expert evaluation of cost-effectiveness and complexity of operating rules).
Explanation and justification of the adopted criteria were presented in Table 1. For each variant, points were assigned to the listed criteria. Points were given on a scale from 1 (the worst variant with respect to a given criterion) to 7 (the best variant with respect to a given criterion). Points were allocated based on modeling results (criteria K1-K5) and expert assessment in the case of criterion K6. If the simulation results for a given criterion were the same for several alternatives, they received the same number of points. The final assessment results were obtained by a weighted sum (K ) of the assigned points, using the following formula:
K = 0.2 (0.33K 1 + 0.33K 2 + 0.33K 3) +0.3K 4 + 0.3K 5 + 0.2K 6 (1)
The adopted weights for particular criteria were related to the significance of the reduction of flood hazard. Thus, the criteria K4 and K5, which referred to the maximum water level on the Warta River and the Golina polder close to the A2 highway, received a weight of 0.3. Other criteria were also important, hence, the sum of points for criteria related to the effectiveness of polder utilization and the feasibility of practical implementation of the variant each received the weight 0.2. The weights were assumed based on our practical experience in flood hazard management and cooperation with regional water authorities. Additionally, the polder effectiveness criteria were combined to avoid problems associated with overestimating the importance of these criteria among the others.
Table 1.
Description of the criteria adopted to evaluate the analyzed polder operation alternatives.
In the modeling studies of operational variants, a hypothetical flood peak with maximum flow probability of exceedance p = 1% was used as the upper boundary condition. Once the effective variant was selected, additional calculations were performed to determine the flow values for which polder flooding should be considered to lower the flood wave culmination. In these simulations, hypothetical waves with maximum flows for the following probabilities of exceedance: p = 10%, p = 2%, p = 1%, p = 0.5%, and p = 0.2% were used as upper boundary conditions. The applied hypothetical waves were determined by the Institute of Meteorology and Water Management (IMGW-PIB) based on maximum annual flows, using the maximum reliability method for the 60-year observation period (1951-2010) at the Sławsk water gauge station.
4. Results and discussion
4.1. Calibration
Based on hydrological observations at the Sławsk water gauge, hydrographs of the water surface elevations and flows were developed. These hydrographs were compared graphically with hydrographs obtained from the calibrated mathematical model (Fig. 6, 7). The coefficient of determination between the hydrographs for flow and water elevations was R 2 = 0.99 (Table 2). The maximum water surface elevations at the peak of the flood wave, obtained from the model calculations and observations, were very similar (the difference was 2 cm). For maximum flows, the difference was 1.47 m3/s (0.36%). The RMSE errors for differences in water level and flow rate during calibration were 0.08 m and 11.01 m3/s, respectively. The RMSE value for the flow appears to be high, but given the flow hydrograph for the 2010 flood, it was only 2.70% of the peak flow value. For the polder area, calibration results also indicated good model performance. The coefficient of determination between modeled and measured data was 0.99 (Table 2). The difference in maximum water surface elevations at the peak of the flood wave was 2 cm.
Fig. 6.
Calibration results – comparison between calculated and observed hydrographs of water surface elevations for the water gauge Sławsk.
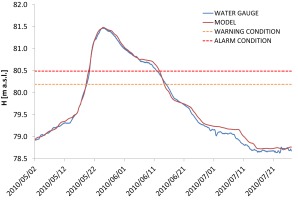
Fig. 7.
Calibration results – comparison between calculated and observed hydrographs of flows for the water gauge Sławsk.
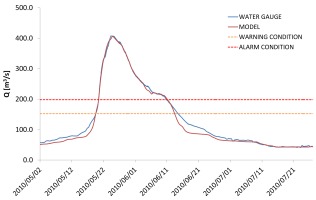
Table 2.
Summary of calibration results for the water gauge Sławsk.
The differences obtained during the calibration between the observed and calculated values were compared with literature data, which indicated that these errors are not significantly different from the results obtained by other authors for hydrodynamic models (e.g., Pasternack et al. 2004; Wright et al. 2017; Gao et al. 2018). Examples from the literature show that during calibration, RMSE errors for water surface elevations were less than 0.10 m. For instance, in the publication by Anderson et al. (2006) the RMSE error for the water surface elevations was 0.04 m. For polder analyses, Gao et al. (2018) obtained values of R2 = 0.981 and absolute error of water level = 0.07 m. In addition, the values of other parameters used to evaluate model performance indicate a very good fit between model data and observed data, in accordance with national guidelines for calibration of hydrodynamic models for flood hazard mapping (KZGW 2020).
4.2. Calculation variants
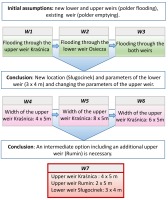
The initial assumptions for defining effective operational variants of the Golina polder included the new upper weir in place of the upper levee spillway in Kraśnica (4×5.0 m), the new lower weir in place of the lower levee spillway in Osiecza (4×5.0 m), and the existing weir in Radolina. In the first three variants, alternative processes of polder flooding were considered: only through the upper weir (W1), only through the lower weir (W2), and through the upper and lower weir (W3). In all three variants the possibility of emptying the polder through the weir in Radolina was assumed (Fig. 8). Moreover, for each variant, many methods of controlling the times of opening and closing of the weirs were tested.
The results for variant W1 showed that the adopted weir size (4×5.0 m) was not sufficient for effective reduction of the flood wave in the Warta River – the least reduction of water level at control cross-sections and the least flow reduction was obtained (Table 3). Flooding of the polder through a weir at the lower levee spillway (W2) also did not allow for full utilization of polder capacity, as the maximum water level in the polder depended on the level of the water level in the Warta River. Additionally, the reduction of the maximum flow was highly dependent on detailed weir operation based on the water level in the Warta River. Yet, despite precise control of the structures (which is very difficult in flood conditions) the full capacity of the polder was not reached. Therefore, additional calculations were necessary to consider the increase in the structures’ throughput. In comparison to variants W1 and W2, by utilization of both inlet weirs (W3), a greater reduction of flood peak in the Warta River and effective use of the polder retention capacity were obtained. However, because of the complicated way of controlling the lower weir (similar to W2), that solution could be difficult to apply in practice. It should also be noted that flooding the polder through both weirs was possible until the water levels in the Warta River and the polder equalized at the location of the lower weir. To flood the polder to the assumed water surface elevations, it was necessary to close the lower weir in Osiecza and to continue flooding only through the upper weir in Kraśnica.
Table 3.
Summary of selected results for the variants analyzed. Tested variants
* Criteria for the assessment of variants: K1 – flooded area of the polder; K2 – duration of water presence in the polder; K3 – the maximum volume of water in the polder; K4 – the maximum water level in the Golina polder close to the A2 highway; K5 – the maximum water surface elevation and percentage reduction of maximum flow in control cross-section located on the Warta River, downstream of A2 highway; K6 – the possibility of practical implementation of the variant.
Based on the results for variants W1-W3, it appeared that with a different location of the outlet weir (closer to the A2 highway embankment) it would be possible to start the discharge of water from the polder to the Warta River earlier (less time needed to empty the polder with higher discharge capacity of the weir). Therefore, removal of the existing weir in Radolina and the construction of a new outlet weir at the levee crosscut in 2010 (Sługocinek) was proposed. The location of the new outlet weir and the dimensions of the structure (3×4.0 m) were verified in variants W4-W6 (Fig. 8). Additional assumptions included the new upper (inlet) weir in place of the upper levee spillway in Kraśnica. The variants did not account for the operation of the existing lower levee spillway in Osiecza and the existing outlet weir in Radolina. In subsequent variants, different inlet weir dimensions were tested: 4×5.0 m (W4), 8×5.0 m (W5), and 6×5.0 m (W6). Increasing the number and size of the gates of the inlet weir in Kraśnica had a significant impact on the maximum discharge in the polder and the use of its retention capacity. These parameters also reduced the maximum flows in the Warta River. The greatest reduction of the flood wave peak was in variant W5. However, this result was connected with the need to build a large, eight-span weir and to flood the polder to the maximum water level. Moreover, the additional retention volume was almost the same as in variant W6. Therefore, further calculations were performed to identify an alternative solution. The location of an additional weir in Rumin was proposed. The purpose of the structure was to reduce the number of spans at the weir in Kraśnica, to lower the flood wave peak in the Warta River (similar to that obtained in variant W5), and to allow a smaller retention volume of the polder. These assumptions were defined and verified by conducting model calculations for the next variant, W7. The following inlet and outlet hydro-technical structures were tested: the new inlet weir in Kraśnica (4×5.0 m), the new inlet weir in Rumin (2×5.0 m), and the new outlet weir in Sługocinek (3×4.0 m). Similarly, as in variants W4-W6, the existing lower levee spillway in Osiecza and the existing outlet weir in Radolina were not considered. The results showed that W7 was the most effective of the cases tested (Table 3). A significant reduction of peak flood wave and lower water surface elevations in the polder was achieved (in comparison to W5). Furthermore, the weighted sum of the points assigned according to the assumed criteria for the evaluation of the variants indicates that W7 is the most effective compared to the other alternatives. The results for W7 in terms of flood hazard reduction and the criteria analyzed were also considered satisfactory by the Regional Water Management Board. Therefore, at this stage, the analyses of variants were terminated. The location of the proposed hydro-technical structures in the W7 variant is shown in Figure 9.
4.3. Additional computational scenarios for optimal variant W7
In designing the polder with full controllability, it was important to determine the flows for which inundation should be considered. Therefore, additional model calculations for variant W7 were carried out. The hypothetical flood waves with maximum flows for the following probabilities of exceedance were considered: 10%, 2%, 1%, 0.5%, and 0.2%. Selected results of model calculations are summarized in Table 4. The results indicated that for the wave with maximum flow probability of exceedance p = 10%, the total capacity of the polder was not used. The calculated maximum water level in the polder was 80.11 m a.s.l. Therefore, effective utilization of the polder capacity is possible for flows greater than flows with a probability of exceedance p = 10%. That means that statistically the polder should be flooded no more often than once every 10 years.
Table 4.
Summary of selected results for additional flow scenarios for variant W7.
4.4. Summary
The 2010 flood in the Warta River Valley in the reach from Konin to Sługocin showed how important it is to properly control the operation of the Golina polder. The existing arrangement of structures provided limited possibilities for controlling water inflow and outflow. Water flowed into the polder automatically when the water elevation exceeded the level of the crest of the levee overflows (the upper levee spillway in Kraśnica and the lower one in Osiecza). Also, the discharge facilities (levee culverts and weir) did not ensure proper regulation of the timing and volume of water drained from the polder area. Inadequate management procedures, a faulty system of hydro-technical structures, and a lack of social consent to redirect flood risk led to increased flood risk and could cause catastrophic consequences. Therefore, it was necessary to find solutions that will prevent such problems in the future, and at the same time contribute to increasing the retention reserve, another element of flood protection in the Warta Valley downstream from the Jeziorsko Reservoir.
The data collected during the 2010 event flood were crucial for model calibration. First, the data reflected the operation of hydro-technical structures during the flood. Second, this process was extremely important for defining the hydraulic parameters of the model that was used to calculate variants. Simulation analyses supported many computations of flood wave propagation, which in the case of designing and establishing management principles for such large objects is certainly significant (Hesselink et al. 2003; Huang et al. 2007; Chatterjee et al. 2008; Gao et al. 2018). Finally, experience and data obtained during the 2010 flood were the basis for determining the modeled variants. Importantly, the Golina polder was completely flooded only once, which makes the data unique. In many cases, the lack of relevant information makes the analysis more complicated and uncertain. For instance, in the study of the Dutch polders (Netherlands), data from the 1805 inundation were used for model development, because there has not been another inundation event recently (since 1926). Further, in comparison to available data from the 1926 event, the evidence for the 1805 inundation included a detailed description of the dike breach and flooding, which enabled the reconstruction of topographical characteristics of the polder, water levels of the rivers Rhine and Meuse, and dike breach dimensions (Hesselink at al. 2003). Thus, information on the flood wave propagation presented in this paper may be valuable for other researchers in future analyses.
We have determined an effective variant for operation of the Golina polder, to reduce flood hazard in the Warta River Valley. Compared with other studies, we implemented a simpler trial-and-error approach in which we aimed to obtain effective polder performance with respect to six assessment criteria. The most effective variant was understood as the one which provided substantial reduction of maximum flow on the Warta River below the Golina polder, while taking advantage of the polder’s retention capacity, the possibility of effective water supply and discharge from the polder area, and feasibility. Typically, in the scientific literature this type of analysis is performed during the process of optimizing the operation of flood protection structures (e.g., Le Ngo et al. 2007; Bashiri-Atrabi et al. 2015; Côté, Leconte 2016; Lai et al. 2021). The advantage of optimization is the identification of the most optimal variant in terms of the assumed objective functions. However, as Simonovic (1992) pointed out, the adaptation of new and complicated techniques and tools is slow, thus there is a gap between research and the application of the systems approach in practice. Therefore, our simplified approach can be an easy guideline for practitioners as to how the computational variants may be constructed, assessment criteria assumed, and historical data used effectively. In addition, our analyses allowed for considering criteria that were evaluated in an expert manner, i.e., the feasibility of practical implementation of the variant. Assuming very precise and complicated rules resulting from the modeling and considering them as suitable for implementation during a flood could lead to a real decrease in the effectiveness of polder operation. The same consideration applied to the potential costs of implementing the variants, which were consulted with the Regional Water Management Board. In studies that consider the optimization process of hydro-technical structures (e.g., reservoirs), the definition of objective functions was more constrained. The objective functions considered decreasing the flood hazard in the terms of water surface elevations and flooded area (e.g., van Manen, Brinkhuis 2005; Le Ngo et al. 2007), damages, including their economic value (e.g., van Manen, Brinkhuis 2005; Bashiri-Atrabi et al. 2015; Ungvári, Kis 2021), assumed operating rules (e.g., Dobson et al. 2019), or demands on water resources by other users (e.g., Latif et al. 2021). Nevertheless, the approach presented in our paper is worth testing for other complex problems of operating hydro-technical structures operation.
In our study, we did not consider the social aspects of the polder operation and thus, the most effective variant does not solve the conflicts of interests and problems of the polder area inhabitants. Lack of social consent for flooding of the polder may therefore hinder proper use of the structures during floods. Therefore, future actions and analyses should also be directed towards land buyouts, legal sanctioning of farming in the polder area or implementation of other flood protection measures (e.g., additional embankments in the polder area, defining flooding rules to protect nearby residents, etc.). Only in this way, it will be possible to effectively reduce the flood hazard in the Warta River Valley between Konin and Sługocin. The social aspect was addressed, for example, in the study by Wei et al. (2022), in which the operation of the Baojixia reservoir was optimized. The irrigation needs of local residents and the water needs of other stakeholders were considered. When linking resident needs to modeling results, similar analyses could also be performed using the approach described in our study.
In closing, it is worth mentioning that to efficiently inundate the Golina polder, it will be also necessary to carry out actions aimed at facilitating water flow below the inlet weirs. First of all, shrubs and embankments of small local roads directly below the planned weirs should be eliminated. Further, information on forecasted water levels and flows at the water gauge profile in Sławsk and planned water discharges from the Jeziorsko Reservoir should be used for proper control of the inlet weirs. Building a levee to protect the A2 highway should also be an important additional measure. The water level in the polder in variant W7 was very close to the elevations of the highway embankment.
5. Conclusions
A trial-and-error approach implemented in our study to reduce flood hazard in the Warta River Valley, by designing effective operation of the Golina polder, led us to several conclusions. We summarize our key findings in the following points:
The data and experience obtained during the 2010 event flood were key to conducting the analyses in the study.
The calculations showed that the greatest reduction of the maximum flow in the Warta River below the Golina polder was obtained for variants W3, W5, and W7. However, the reduction in variant W3 was related to precise and complicated gate opening rules for the weirs, especially the lower weir in Osiecza, which had to be closed when the water level in the polder and in the Warta River equalized (to prevent water outflow from the polder area). The reduction of maximum flow rate in the Warta River in variant W5 was related to flooding the polder to the water level of 81.63 m a.s.l., which indicated the necessity of raising the levees. Thus, the most effective alternative analyzed was variant W7.
The location of the outlet weir closer to the A2 highway, near Sługocinek, where the levee was breached during the flood in 2010, was more favorable compared to the location of the present weir in Radolina.
Effective use of the polder retention capacity occurred for flows higher than those with maximum probability of exceedance p = 10%.
The duration of water storage in the polder in specific variants was similar and related to the rate of water decrease in the Warta River. However, emptying of the polder should occur as a result of gradual opening of the outlet weirs, within a few days after the peak of the flood wave. It will provide slow water inflow to the Warta River and will prevent creation of additional flood peaks.
The trial-and-error method, along with assumed criteria of variant performance, made it possible to indicate the most effective variant of polder operation. Therefore, our simplified approach can be an easy guideline for practitioners for how the computational variants may be constructed, assessment criteria assumed, and historical data used effectively.

