1. Introduction
Water temperature and ice cover duration are important parameters that impact the ecological state of waterbodies. But regular monitoring of water temperature and ice cover at the hydrological station provides insufficient data. These data can be used to characterize only local conditions of a limited number of waterbodies. The conditions of unmonitored waterbodies remain unknown; likewise for water areas located far from the hydrological stations. Under these conditions, remote sensing data provide additional information on water temperature and ice cover. Nevertheless, these data have some disadvantages. The persistent cloud cover (most prevalent in cold seasons) is an obstacle to getting a sufficient number of high-quality satellite images.
The number of publications devoted to water temperature and ice regimes of rivers, lakes, and reservoirs, is large. Nowadays, changes caused by global warming, are the most popular issue. Considering the long-term observations, many authors (Austin, Colman 2007; Adrian et al. 2009; Strutynska, Grebin 2010; Litvinov, Zakonnova 2012; Filatov et al. 2014; Woolway et al. 2017; Czernecki, Ptak 2018; Ptak et al. 2020) state that there is an increasing trend in water temperature. This increase depends on the specific region and the period of observation. Studies of the water temperature of Lake Śniardwy (Northern Poland), carried out during 1972-2019, have shown a positive trend of mean water temperature of 0.44°C per decade, with the maximum increase in April of 0.77°C per decade (Ptak et al. 2020). In that study, the trend of water temperature rise was greater than the increase of air temperature. Similar results, with a positive trend in all months were obtained for 20 Central European Lakes from 1961 to 2010 (Woolway et al. 2017). The more intensive trend of temperature rise (0.89°C/decade in July) was determined for the Rybińsk Reservoir on the Upper Volga River during the period from 1976 to 2008 (Litvinov, Zakonnova 2012). The trend for Lake Superior (North America) during 1979 to 2006 was even greater – the water temperature increase in July, August, and September reached 1.1°C per decade (Austin, Colman 2007).
One more point of the study in this area is the impact of reservoirs, especially the uneven operational regime of hydropower plants on tailwater temperatures. Relevant research (Meilutyte-Barauskiene et al. 2005) showed decreasing tailwater temperature in July, increasing temperature in October.
There are many studies of surface water temperature, based on remote sensing data. Studies by Barsi et al. (2014) and Sharaf et al. (2019) prove a strong correlation between measured and calculated data obtained from the Landsat 8 satellite, and found that thermal Band 10 gives more reliable results than Band 11.
A study based on remote sensing data by Pareeth et al. (2017), showed increasing water temperature in Perialpine lakes. The warming trend of mean water temperature was 0.17°C/decade, and 0.32°C/decade during summer.
Interesting results were obtained by Lieberherr and Wunderle (2018), based on remote sensing data of 26 lakes, located in different zones of Europe. It was revealed that the trends of mean water temperature are increasing from south to north and from west to east. There are seasonal variations: at lower latitudes winter trends and some spring trends are dominant, but farther north, first the spring and then the summer trends dominate.
Global warming affects the ice regime as well. The freezing of waterbodies starts later, while the ice breakup starts earlier than in the previous decades. A study (Ptak et al. 2020) found that over the past fifty years the ice cover duration has been decreasing at a rate of 8.7 days per decade. A trend toward reduced maximum ice cover thickness was determined as well.
A study of ice cover on the Dnipro Reservoirs was reported by Vyshnevskyi (2011). Based on regular monitoring data, decreases in ice cover thickness and duration were observed. Some results of studies of water temperature and ice cover of the Dnipro Reservoirs, based on remote sensing data, have been reported by Vyshnevskyi and Shevchuk (2018, 2020).
Important questions for additional study are (1) the interdependence between the dates of freezing and ice break-up, and (2) the dependence of the ice thickness on hydrometeorological conditions (Brown, Duguay 2010; Efremova et al. 2010; Kalinin 2008).
Despite the large number of research works in this field, the peculiarities of water temperature and ice cover of waterbodies under the impacts of upstream hydropower plants, have not been studied. The primary concern is for waterbodies connected with the main river channel. Some of them are shallow, and some very deep. Thus, the main objective of this research is to specify the corresponding features of waterbodies connected with the main river channel under the impacts of an upstream hydropower plant. Another important task is the evaluation of changes caused by global warming.
2. The study area
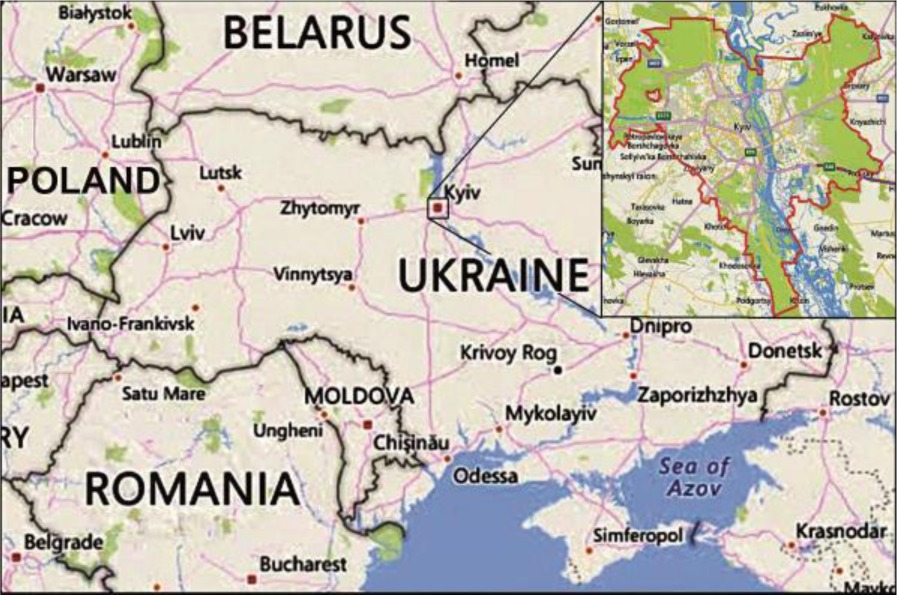
The study area covers the territory of Kyiv, where besides the Dnipro River, there are many lakes and ponds (Fig. 1).
An important factor that significantly affects the thermal and ice regimes of the Dnipro River, including its secondary branches and bays, is the vicinity of the Kyivske Reservoir and Kyivska HPP. The distance between the HPP and the urban territory is only a few kilometers.
The water from the Kyivske Reservoir is withdrawn from a depth greater than 10 m. The temperature of this water mass differs from the temperature of the surface layer. An important factor is the uneven operation of the HPP. The daily amplitude of water level near the HPP is usually 0.5-0.8 m, whereas in the central part of the city near the hydrological station it is 1.5-2.0 times less. As a rule, in winter there are two flushes per day, morning and evening, and in summer only one evening flush. In the latter case the highest water level near the hydrological station is observed after the end of the evening flush at about 23:00-24:00.
The section of the Dnipro River within the territory of Kyiv also includes the Kanivske Reservoir, which was constructed in the mid-1970s. As a result, the water level in the Dnipro River within the urban area increased in summer by 1.5-2.0 m, while water velocity in the river decreased.
The Dnipro River within the urban area is divided into two or even three branches, of which the right one is the largest. The mean width of this main river branch is 400-600 m, and typical depth is 7-10 m. The maximum depth in narrow places and in some bays, from where the sand was extracted for construction needs, can exceed 15 m. Such bays are: Verbliud, Sobache Hyrlo, Obolon, Domania, etc. Among them Domania Bay is the deepest (>25 m).
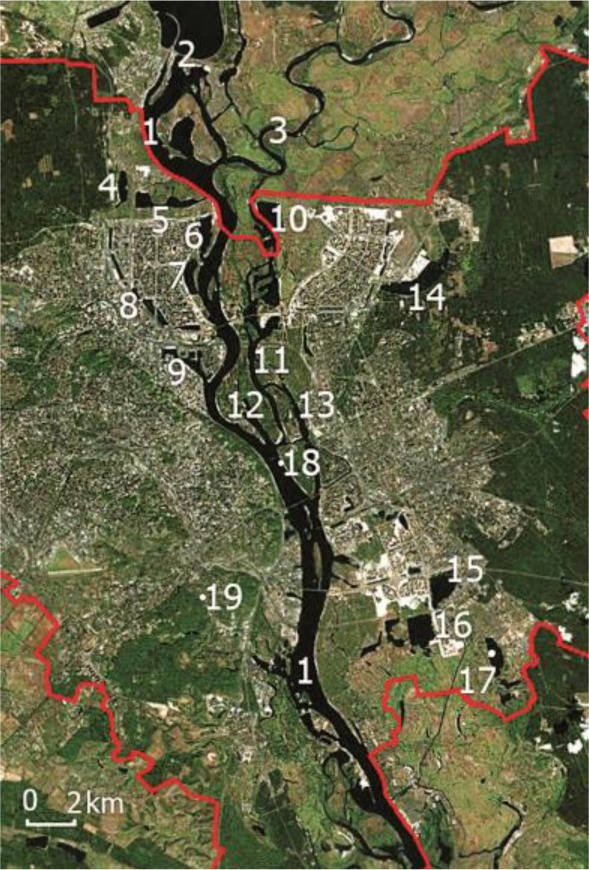
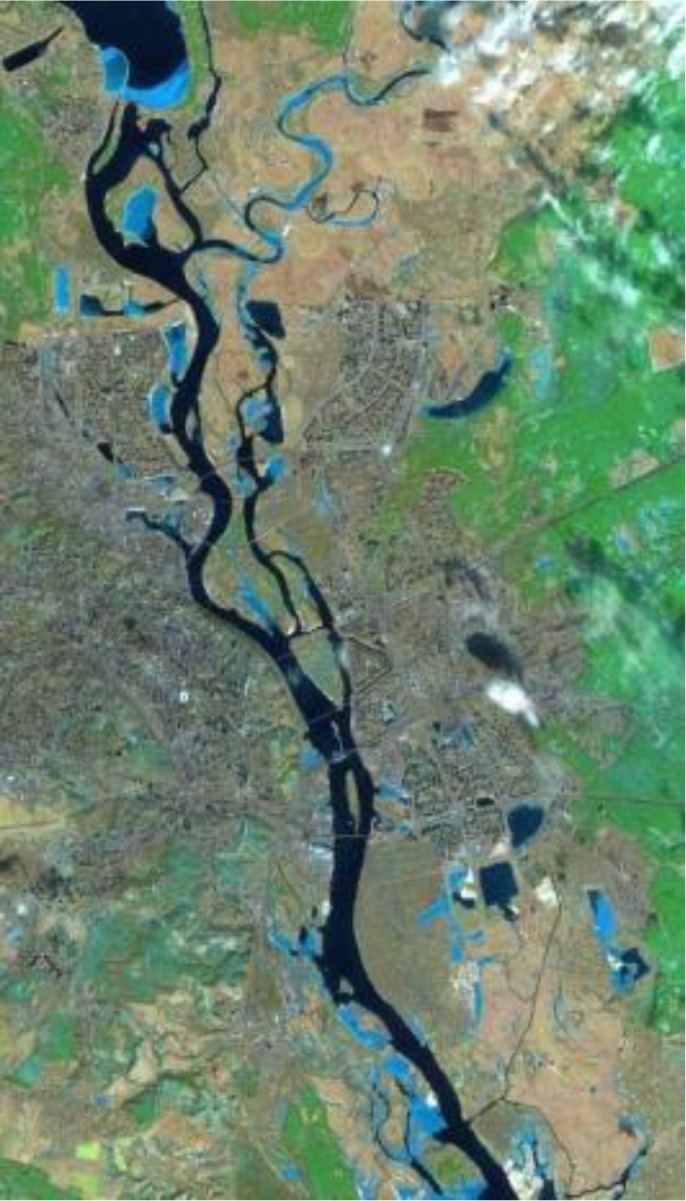
The largest lakes are located in the left-bank territory of the city, which was once the floodplain of the Dnipro River. Most of these lakes were artificially created by sand extraction for construction needs. The length of the largest lakes and ponds exceeds 1 km; depths reach 15-20 m. The largest lakes are: Redchyne in the right-bank part of the city, Almazne, Vyrlytsa, Tiagle and Zaplavne in the left-bank part of the urban area (Fig. 2).
Fig. 2.
The location of main water bodies and stations of data collection: 1 – Dnipro River, 2 – Kyivska HPP, 3 – Desna River, 4 – Lake Redchyne, 5 – Verbliud Bay, 6 – Sobache Hyrlo Bay, 7 – Obolon Bay, 8 – Lakes Opechen, 9 – Harbor, 10 – Domania Bay, 11 – Desenka Strait, 12 – Matviyivska Bay, 13 – Rusanivska Strait, 14 – Lake Almazne, 15 – Lake Vyrlytsa, 16 – Lake Tiagle, 17 – Lake Zaplavne, 18 – hydrological station, 19 – meteorological station.
3. Methodology and data
The main source of data for this research was the regular monitoring and remote sensing programs.
The hydrological station that supplied data is located on the left bank of the main branch of the Dnipro River not far from the city center. This measurement site is rather shallow, and the bank is oriented to the west-southwest. Regular observations at this station are carried out twice daily, at 8 AM and 8 PM local time.
In addition, data from the meteorological station, located 6 km to southwest of the hydrological station, were collected and analyzed. Mainly, these data were the mean monthly air temperature. In some cases, the daily data were also analyzed.
The study of the spatial and temporal features of water temperature and ice regime of the Dnipro River and other waterbodies was mainly based on remote sensing data. Relevant satellite images cover all the territory of Kyiv, which makes it possible to analyze the data of both water temperature and ice cover.
The main source of data for determining water surface temperature were images taken by Landsat 8 satellite, which was launched in February 2013. The revisit time of this satellite is 16 days. The satellite imagery of the territory of Kyiv is carried out at about noon. The spatial resolution of most of the spectral bands is 30 m, whereas the spatial resolution of the thermal bands (B10 and B11) is 100 m.
The water surface temperature was determined based on the B10 data, using ArcMap 10. The calculations were carried out with the use of an equation recommended by NASA: t = (1321.08/(Ln((774.89/(("LC80990232013252LGN00_B10.TIF" * 0.0003342) + 0.1)) + 1))) – 273.15. This approach is rather common (Sharaf et al. 2019). The reliability of the calculated and measured values was proved based on studies of Kyiv water bodies (Vyshnevskyi, Shevchuk 2018). Other studies have also shown the validity of the results, based on the use of B10 (Barsi et al. 2014).
Dozens of satellite images were downloaded and analyzed. Colored images, which show the spatial distribution of water temperature, were created for visualization of temperature features. Territory not belonging to the water area, was specified based on Landsat 8 images and calculation of the Normalized Difference Pond Index. NDPI = (B6 – B3)/(B6 + B3). Images were then classified into 32 classes. Those with values less than zero were treated as transparence, others were ordered as grey.
The study of ice cover was carried out mainly based on satellite images taken by Sentinel-2. In fact, there are two Sentinel-2 satellites, launched in 2015 and 2017. Quite high spatial resolution (10 m) and relatively small revisit time (2-3 days) are the advantages of these data. However, these satellite images do not support water temperature determination. These satellite images were taken from the website of US Geological Survey (www.glovis.usgs.gov).
4. Results and discussion
4.1. Water temperature
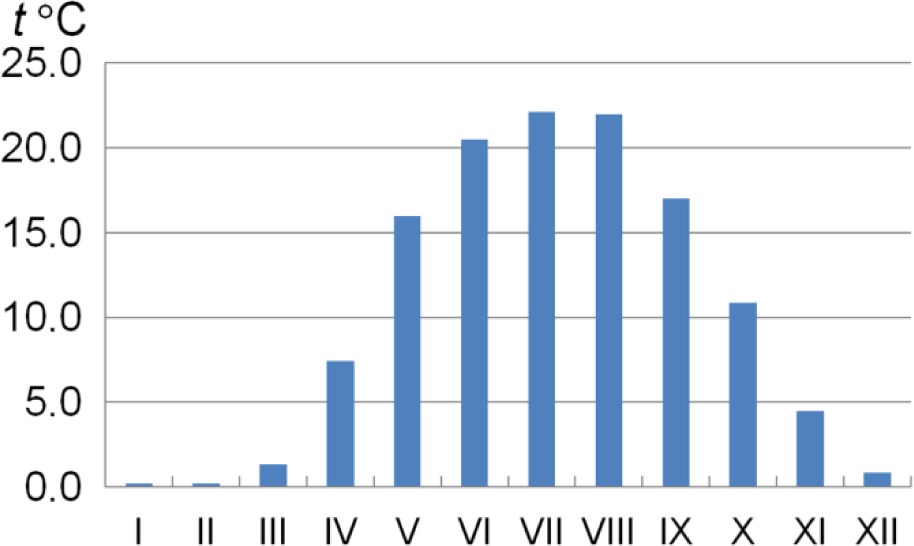
Water temperature at the hydrological station in Kyiv has been measured for more than 100 years. This period can be divided into two parts – before and after creation of the Kanivske Reservoir, to which the water area of Kyiv now belongs. The analysis of water temperature, therefore, has been conducted only for the later period, i.e. since 1977. During 1977-2019 the highest water temperature was usually observed in July. The mean July water temperature is 22.1°C. The highest mean monthly temperature (25.8°C) was observed in 2010 and the lowest (19.3°C) was observed twice, in 1985 and 1993. The highest measured temperature (29.1°C) within the standard time (at 8 PM) was registered on 10 August 2015. A slightly higher temperature (29.4°C) was measured in the daytime on 23 June 2019, during the period of a heat wave that covered a large part of Europe (Fig. 3).
Fig. 3.
Mean monthly water temperature in the Dnipro River at Kyiv hydrological station during 1977-2019.
In general, the water temperature at 8 PM is higher than at 8 AM. To some extent this can be explained by the location of the hydrological station on the bank, which slopes to the west-southwest. In summer at 8 PM the water temperature is usually 1-2°C higher than at 8 AM. In the daytime the temperature can be 1-2°C higher than at 8 PM. In the cold season daily fluctuations are rather small.
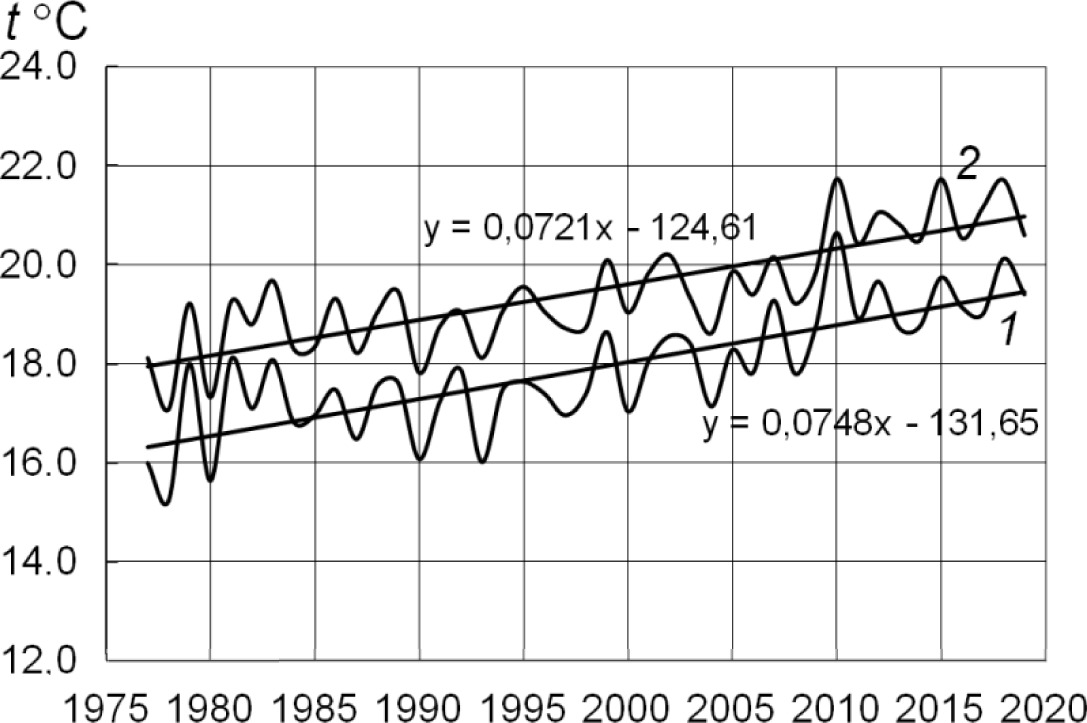
During the observation period 1977 to 2019 water temperature has tended to increase. In this period, the mean water temperature increase from May to September has been 0.72°C/decade, while the increase of air temperature is 0.75°C/decade. The increase of temperature for April to October has been somewhat less: 0.69°C/decade for water and 0.70°C decade for air (Fig. 4).
Fig. 4.
The changes in air temperature (1) at Kyiv meteorological station and water temperature (2) in the Dnipro River at Kyiv hydrological station during May-September.
This result differs somewhat from that obtained by Ptak et al. (2020) for a Polish lake. The main reason is the difference between lake and river conditions. Greater rates of water exchange in rivers slows the increase of water temperature compared with lakes. Another important factor is the large reservoir on the Dnipro River.
The largest increase of water temperature is observed in August – about 0.80°C/decade. This increase is somewhat less in other summer months and in September. A much smaller increase is observed in March (Table 1).
Table 1.
The changes of air and water temperature and correlation between them in the period 1977-2019.
The largest standard deviations of water temperature are from April to June and in December. The increases of mean monthly water temperatures in all months from March to November are significant at p = 0.05.
Variation of gradients during separate months is less when data are generalized over seasons. In this case the changes of air and water temperature are more natural. The increase in water temperature in spring is much less than the increase in air temperature. The corresponding values are 0.38°C and 0.74°C/decade. In summer, the gradient of water temperature increase is slightly less (0.77°C/decade) than that of air temperature (0.86°C/decade). But in autumn the gradient of water temperature increase is larger (0.65°C/decade) than the gradient of air temperature increase (0.49°C/decade).
The correlation between water and air temperature during the year is not constant. The strongest correlations are observed in July (r = 0.94) and in August (r = 0.92). In our view, the strength of these correlations can be explained by low and relatively stable water runoff during this period of year. In spring, when air temperature increases earlier than water temperature, the correlation is rather weak. During this time, there is rather large variability in water runoff. In autumn, most notably in October, the decrease in air temperature is more rapid than the decrease in water temperature. In our view, these correlations for the winter are biased because water temperature has a lower limit of 0°C, in contrast to the lack of a practical lower limit on air temperature.
The increase in maximum temperature (about 1.0°C/decade) over the period 1977 to 2019 was more significant than changes in monthly average values. In recent years, the maximum water temperature has been approximately 27°C, which is about 4°C higher than it was at the beginning of the observations.
In fact, with the help of regular monitoring data it is possible to characterize water temperature at only one measurement point – on the Dnipro River at the hydrological station. The changes of water temperature along the length of the river, as well as in its branches and bays, remain unknown. The same can be said about the water temperature in the lakes and ponds. Satellite image processing provides much more additional information.
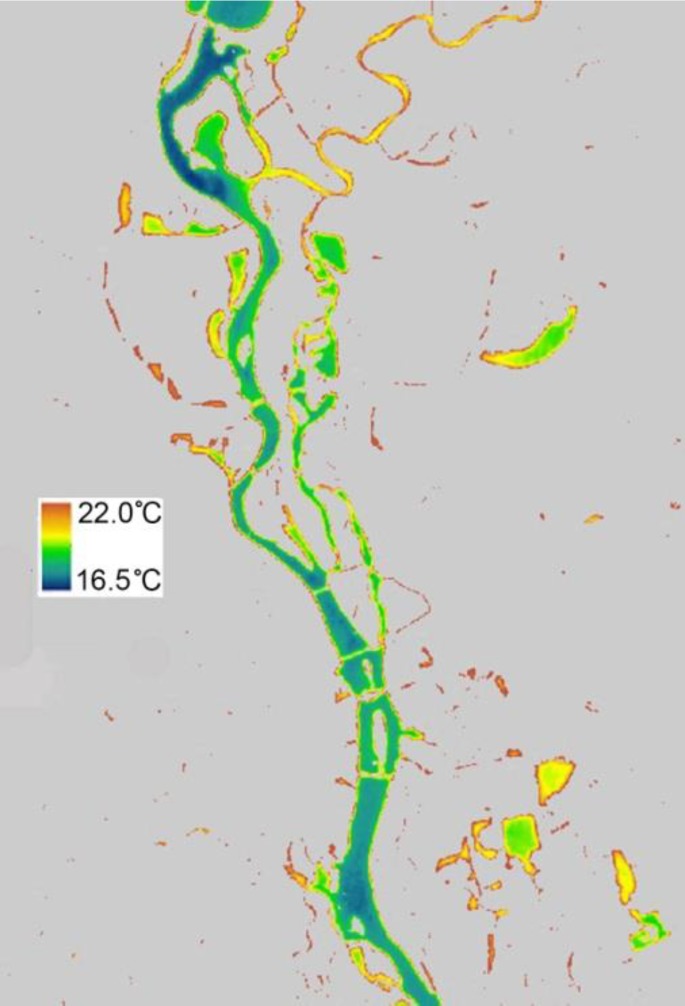
The temperature regime of waterbodies varies throughout the year. From January to April water temperature is rather low. The lowest temperature in the first half of spring is observed in the main branch of the Dnipro River, which is heavily influenced by Kyivske Reservoir, located upstream. At this time, the water temperature in the Desna River, bays, and lakes is higher than it is in the main branch of the Dnipro River. The greatest differences in water temperature in the zone near Kyivska HPP and the lakes are observed in the second part of May, reaching as much as 5°C. Thus, on the bases of the obtained satellite data, it was specified that the water temperature on 19 May 2019 near HPP was 16.8°C, and 17.6°C at the hydro-logical station. At the same time the water temperature reached 21°C in small lakes. This fact verifies our finding of earlier increase in air temperature compared with water temperature, especially in the river (Fig. 5).
These results to some extent correlate with those obtained for the course of river downstream from the lake by Nowak et al. (2020). In our case the impact of the reservoir is larger as the result of its large volume and the discharge of water from the bottom layer.
The uneven operation of Kyivska HPP during the day causes the alternation of different temperature zones along the length of the Dnipro River. The water from the Desna River alternates with the water from the Kyivske Reservoir.
The water heating in the bays and lakes depends on their depths. The deep waterbodies (Verbliud Bay, Sobache Hyrlo Bay, Obolon Bay, Domania Bay, Almazne Lake, Tiagle Lake) warm much slower than the shallow ones.
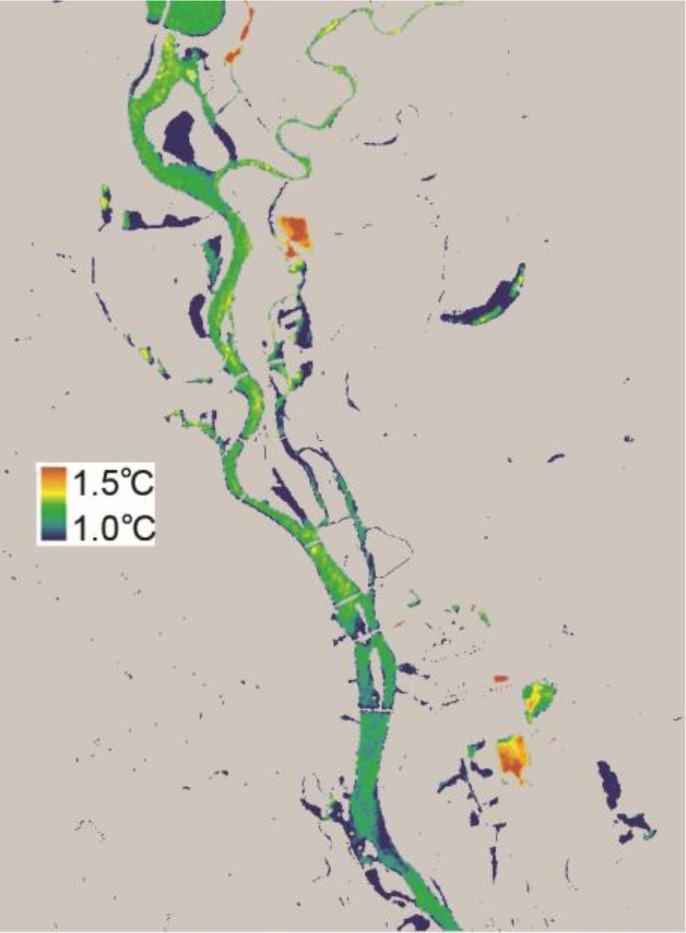
As a rule, the highest water temperature is observed in the second part of July. In this time the water temperature in lakes is higher than it is in bays, while the temperature in bays is higher than in the Dnipro River. One of the main reasons for these distinctions is the difference in the water exchange. Another important feature of water temperature in summer is that it is higher near the banks than in the central reaches of waterbodies (Fig. 6).
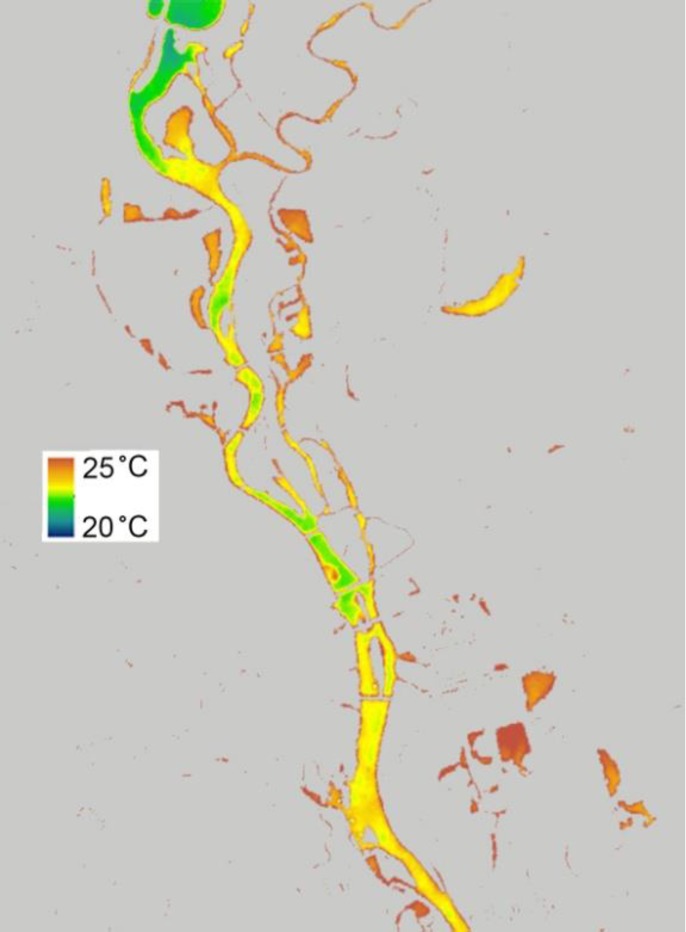
During the summer, the surface water temperature along the length of the Dnipro River increases. On the section from Kyivska HPP to the southern boundaries of Kyiv the difference can reach 2°C. Thus, on 29 July 2016 downstream from the HPP the water temperature was 21.1°C, while downstream from the Southern Bridge it was 22.9°C, and in Lake Tiagle it reached 25.1°C.
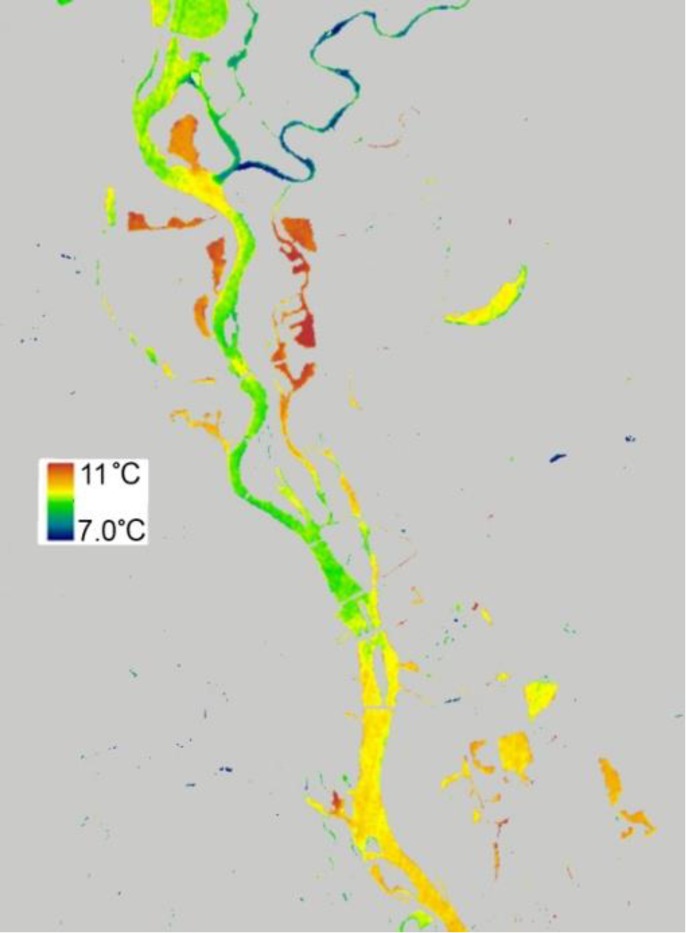
With the onset of autumn, the spatial differences in water temperature change; the water in the Desna River becomes colder than in the Dnipro River. Simultaneously, the temperature in the deep bays and lakes is higher than in the Dnipro River. The highest temperature in autumn is usually observed in deep bays. One can assume that groundwater discharge takes place in these bays. At this time, the water temperature in deep Domania Bay is much higher than in the mainstem river. Almost the same temperature is observed in other deep bays: Verbliud, Sobache Hyrlo, Obolon etc. (Fig. 7).
In the cold season the impact of industrial enterprises becomes noticeable. First of all, this concerns Kyivska TPP-5, which operates on the right bank of the Dnipro River in the southern part of the city. The daily water volume, used in technological process, is about 800,000 cubic meters. The impact of Bortnitska Station of Aeration, which purifies the city wastewater, is also seen in the satellite images. The water discharge of this water treatment station is 700,000-750,000 cubic meters per day. The temperature of the treated wastewater, discharged into the Dnipro River, is higher than it is under natural conditions. As a result, the water temperature in this part of the river is higher than it is nearby (Fig. 8).
Fig. 8.
The impact of Kyivska TPP-5 (1) and Bortnitska Station of Aeration (2) on water temperature in the Dnipro River on 31 October 2015.
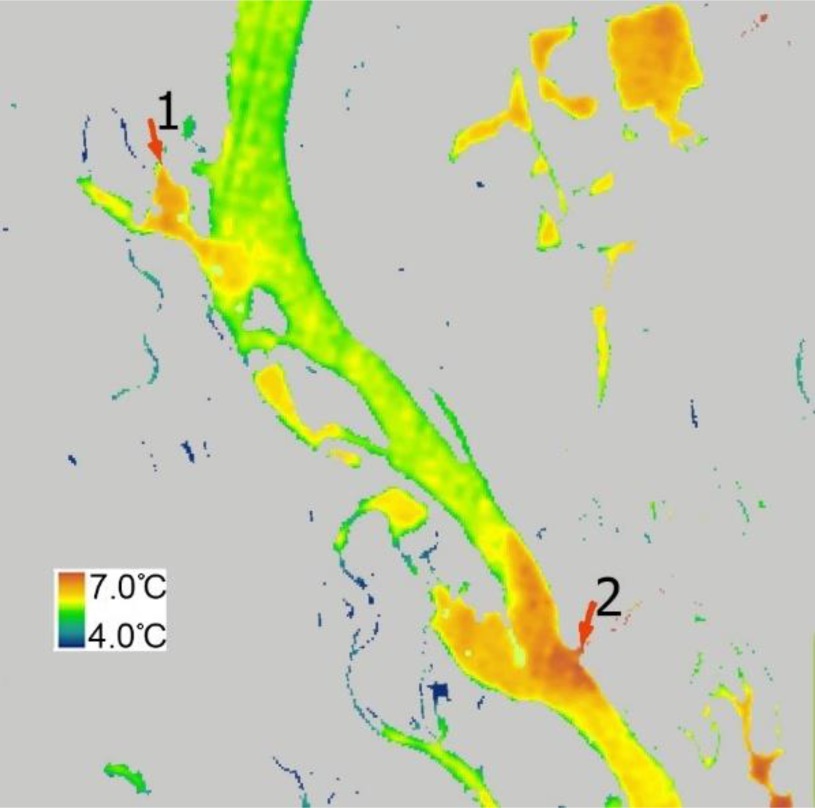
As can be seen in Figure 8, the warm water of Bortnitska Station of Aeration was not moving downstream in the Dnipro River because of a very low water discharge resulting from the weekend stoppage of Kyivska HPP operation.
In winter, the number of high-quality satellite images is limited due to the great cloudiness, which generally becomes less in the second part of winter. But at this time most of the water area is covered by ice. On 8 January 2018 only one high-quality satellite image of Kyiv water area was found without ice cover. It can be seen that at this time spatial differences in the temperature were not large. In contrast to summer, water temperature in winter gradually decreases downstream from Kyivska HPP. We can assume that the discharge of groundwater into Domania Bay causes relatively high water temperature there (Fig. 9).
The water temperature at the hydrological station on 8 January 2018, calculated on the base of satellite image, was 0.5°C. In Domania Bay it reached 1.6°C. Almost the same temperature was observed in the southern part of Lake Tiagle. One can assume that there is some underground wastewater flow from Bortnitska Station of Aeration to the lake. This intrusion intensifies biochemical processes and causes additional water heating. Indeed, the ecological state of this lake is unsatisfactory. The relevant research shows low water clarity, high chemical oxygen demand, high pH and high concentrations of inorganic phosphorus. In August 2020, chemical oxygen demand was 45 mg/dm3. In summer, especially in August, major algal blooms are observed in this lake. This phenomenon effects the water temperature and vice versa.
4.2. Ice regime
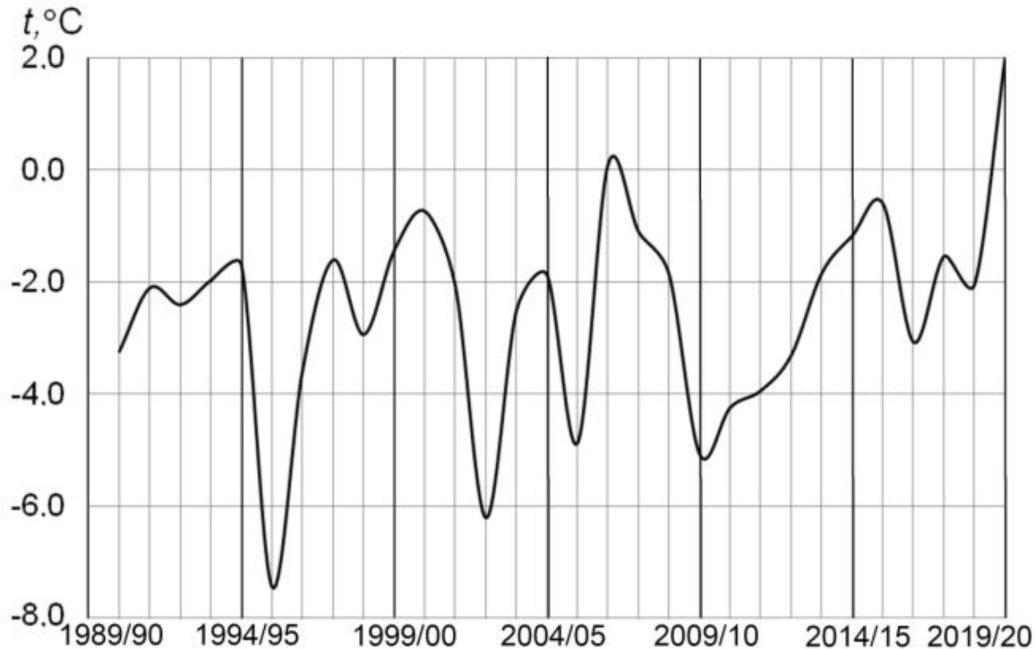
Ice cover on the waterbodies of Kyiv is observed in all years, including during warm winters. Even under these conditions, there are certain periods when the air temperature drops below 0°C. The mean monthly temperature at the meteorological station in Kyiv during a standard observation period from 1961 to 1990 was the following: December – minus 2.3°C, January – minus 5.6°C, February – minus 4.2°C.
During the period 1991 to 2020 mean monthly air temperature was higher: December – minus 1.9°C, January – minus 3.2°C, February – minus 2.3°C. The coldest winter during this period was in 1995-1996, while the warmest one was in 2019-2020. Moreover, the winter of 2019-2020 was the warmest throughout all the observation period, which started in 1881. All winter months of 2019-2020 had positive temperatures. The coldest month was January of 1996, when the mean air temperature in Kyiv dropped to –9.8°C (Fig. 10).
The regular observation of ice regime on the Dnipro River has been carried out for more than 100 years. The largest ice cover duration (151 days) was recorded in the coldest winter of the 20th century in 1941-1942. The largest ice cover thickness (77 cm) was measured in February of 1963.
After the construction of Kyivske and Kanivske Reservoirs, the hydrological regime of the Dnipro River within Kyiv changed substantially. The global warming affected this regime as well. As a result, currently ice cover formation starts later than at the beginning of observations. Accordingly, the ice cover duration became shorter. The thickness of ice decreased as well. During past decades the longest duration of ice cover (87 days) was observed in the cold winter of 1984-1985. The largest ice cover thickness (42 cm) was recorded in January 1977. In many cases, particularly over the past three decades, it has become difficult to measure the thickness of ice, it is so thin.
All the above information about the ice cover on the Dnipro River is based on the regular monitoring data. Obviously, these data are insufficient for a proper study of the plot of the Dnipro River within urban territory. In this case the use of remote sensing data is necessary.
Similar to water temperature, the ice regime of the Dnipro River and its bays is heavily influenced by Kyivska HPP. Due to the discharge of water from the deep layer of the reservoir, the temperature near the HPP in the beginning of winter became warmer than in waterbodies under natural conditions. Ice formation starts in small and shallow lakes followed by the bays, located in the southern part of Kyiv, where the water exchange is rather small. Then ice is formed in the large bays in the northern part of the city. The next stage is the formation of ice on the secondary branches of the Dnipro River. The main branch of the Dnipro River freezes last. One of the places of early ice formation is in front of the main bridge of Podilsko-Voskresenskyi bridgework crossing, which is being constructed now. This is partly due to the accumulation of ice carried by the Desna River. The next place with an early ice formation is located downstream in the secondary branch of the Dnipro River between Small and Great Islands and the right bank of the river. The third place of ice formation is located downstream from the Southern Bridge in the zone of significant increase of water area and relatively small water level fluctuation, caused by Kyivska HPP (Fig. 11).
In some cases, the freezing of large and deep lakes, as well as the bays, is observed after the freezing of the main branch of the Dnipro River.
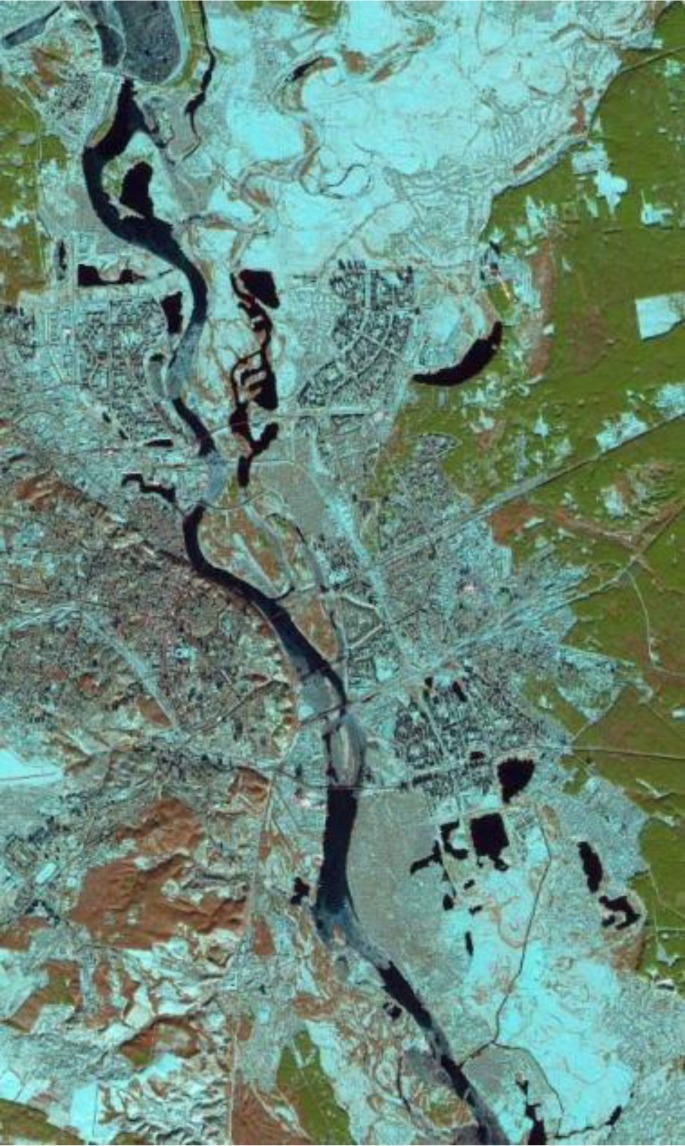
In January, most waterbodies in the territory of Kyiv are covered with ice, except for the main Dnipro branch near Kyivska HPP. In warm conditions there is no ice along the length of river up to the southern boundaries of Kyiv (Fig. 12).
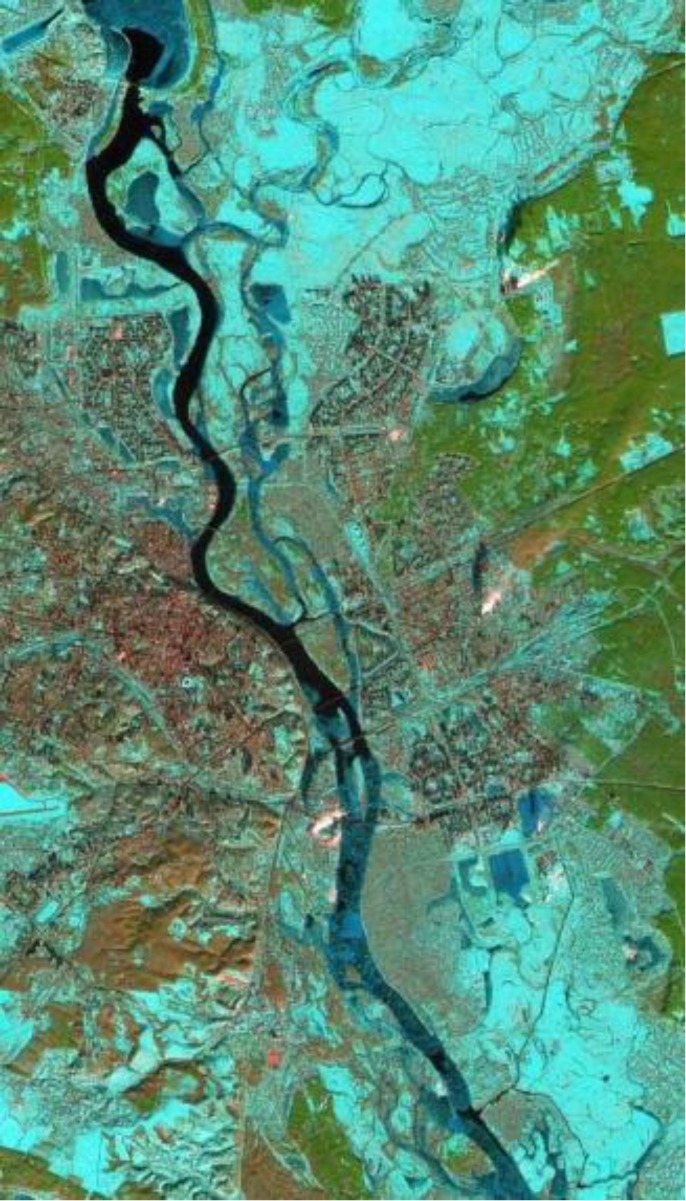
In late February and in March, the ice begins to melt on the main branch of the Dnipro River. Gradually this process extends to the secondary branches. After that, there is a clearing of the ice float between the river branches. The longest ice cover duration on the Dnipro River is observed in the bays in the southern part of the city. All of these dynamics are driven essentially by the uneven daily discharge from Kyivska HPP (Fig. 13).
5. Conclusions
The use of regular monitoring and remote sensing data provided the capability to characterize the features of water temperature and ice cover of waterbodies as they are affected by global warming and the HPP, located upstream. In recent decades water temperatures of the Dnipro River near Kyiv have tended to increase, in the warm season about 0.7°C/decade. The operation of Kyivska HPP, located upstream, has an essential impact on the thermal and ice regime of the Dnipro River. In the warm season the water temperature near HPP is lower than that of areas far from it. The uneven operation of the HPP causes uneven water temperatures along the river and the alternation of water areas of higher and lower temperature. In the warm season the water temperature in the lakes is higher than in the river bays, while in the river bays it is higher than in the river. In winter, the situation is quite different – the water temperature in the Dnipro River is higher than in the lakes.
The substantial heat storage in the large and deep bays and lakes causes less fluctuations of water temperature than in smaller and shallower water bodies. As a result, the water temperature in the warm season in deep water bodies is colder than in shallower ones. In the cold season it is vice versa. The possible discharge of groundwater may be the reason of relatively high temperature in the deepest bays and lakes in the cold season. The city’s industrial enterprises also affect the water temperature in the river during the cold season.
On the whole, the ice cover on the Dnipro River within the territory of Kyiv is unstable, mainly due to the operation of Kyivska HPP and changeable climate conditions. The process of waterbodies freezing starts on small and shallow lakes and ponds. Then ice covers the river bays and secondary river branches. The main branch of the river freezes last. The sequence of ice break-up on the waterbodies is opposite. The disappearance of ice begins with the main branch of the river. Gradually, this process extends to the secondary river branches. Then the ice disappears from the straits, connecting the bays and river branches. The longest ice cover duration in spring is observed in bays with low rates of water exchange.