1. Introduction
One of the major purposes of the extended range forecast is to provide a high-resolution spatial-temporal forecast on a weekly scale, with up to 2-3 weeks lead time. The weekly outlooks can provide important input to the decision-making process of various stakeholders (Pattanaik, Das 2015; Chattopadhyay et al. 2018; Pattanaik et al. 2019; Sahai et al. 2019a-b). The extended range forecasts of the India Meteorological Department (IMD) are being generated at a spatial resolution of 1°X1° Grid. Forecasts of rainfall in different river basins have several important hydrometeorological applications, especially in flood forecasting based on rainfall variables (Ming et al. 2020; Webster, Hoyos 2004; Webster et al. 2010; Gilewski, Nawalany 2018; Sayama et al. 2020; Gilewski 2021). In this regard, the most critical application is the forecast of heavy rainfall (daily rainfall of 7 cm or more) in the river basins. This can lead to flooding and inundations, and a considerable loss of life and property. Hence, for flood forecasting and other hydrometeoro-logical requirements, the precipitation forecast must be as quantitative as possible. However, it is occasionally found that there is a significant bias in amplitude and variance in the forecasted rainfall. This often leads to a severe underestimation of rainfall outlook, thereby adding additional input errors to hydrological models that use these quantitative rainfall forecasts.
The Ministry of Earth Sciences, the Government of India, and the IMD have the mandate to provide rainfall forecast and long-range outlooks in the S2S (seasonal to sub-seasonal) scale1. Such predictions are required to be as accurate as possible. Bias in rainfall forecasts is a common problem in raw model forecast data, which can be problematic for quantitative precipitation forecast. Such amplitude biases in rainfall in longer lead times arise due to inefficient representation of model physics and dynamics, or due to systematic errors in the large-scale forcing. To make the forecast more useful, these biases should be reduced as much as possible. One crucial error in rainfall forecasts is the underrepresentation of rainfall amplitude after a forecast lead-time of a few days. The forecast often shows that the variance is severely underrepresented in the forecasted rainfall, as lead-time increases. Several statistical post-processing methods, using complex to simple approaches to correct the rainfall bias, exist to improve the rainfall forecast under such circumstances (Boé et al. 2007; Leander, Buishand 2007; Ghimire et al. 2019). These bias corrections are shown to improve hydrological forecasts (Teutschbein, Seibert 2012). The results show that a bias in rainfall arising due to improper amplitude attenuations as a function of lead-time, could be corrected under many circumstances – provided climatological or observed rainfall amplitude is known for any lead day. This shows promise for correcting amplitude bias arising in operational dynamical models (Singh et al. 2017; Jabbari, Bae 2020).
The presented study aimed to provide better basin-wise weekly rainfall forecasts for the river sub-basins of India, using a novel method to correct the forecast bias in the extended range weekly forecast. The forecast ability of extended range weekly rainfall forecasts, as well as bias-corrected extended range weekly rainfall forecasts, were satisfactory in both 1-week and 2-weeks lead time. These forecasts can thus be used as model inputs for flood forecasting. Although this study focused on basin-wise rainfall forecast, the method is general and can be applied to the average rainfall of any administrative boundaries or geographical locations like districts or states.
2. Data and methodology
2.1. Data
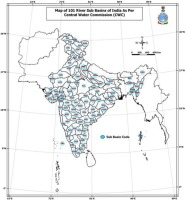
The current study uses the daily observed rainfall data from the IMD 0.25 Deg × 0.25 Deg gridded data (Pai et al. 2014) and daily 1Deg × 1Deg rainfall forecast data received from the IMD_IITM extended range forecast system [ERF]. Daily observed gridded rainfall data of 0.25 Deg × 0.25 Deg has been generated by the IMD from the quality controlled daily rainfall data of rain gauge stations2. The dataset covers a geographical domain of 6.5°-38.5°N and 66.5°-100.0°E and contains only values from land regions. The extended range forecast models generate precipitation forecast data up to four weeks in advance, based on the conditions observed at any given time (Chattopadhyay et al. 2019; Pattanaik et al. 2019, Sahai et al. 2019b). Currently, an operationally extended range forecast is disseminated once every week. For every week’s operational forecast, there is corresponding “on the fly” hindcasts for the same set of recorded conditions since 2003. The data is generated for the global domain. In this analysis we have used the data for the river basins of India. The Central Water Commission divides the country into 25 major river basins and 101 river sub-basins (Fig. 1 and Table 1). River sub-basins shapefiles were obtained from the Central Water Commission. Using the shapefile, the gridded data (both observation and forecast data) was masked and basin averaged data was prepared for each of the 101 river basins.
Table 1.
List of the 101 river sub-basins of India and their codes.
2.2. Methodology
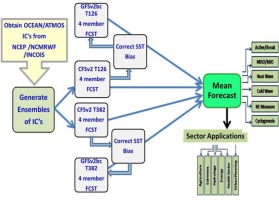
Weekly grid point cumulative rainfall data for the years 2003-2019 were used. Average cumulative rainfall (in mm) in each sub-basin for every week was calculated using the Raster Statistics Method in the QGIS Software. More details on the operational extended-range forecast can be seen in a study by Sahai et al. (2019b). A diagram illustrating how the operational forecast is generated currently, is shown in Figure 2. The operational extended-range forecast is an ensembled mean of four dynamical models. Two of them are high resolution (denoted by suffix T382 or ~38 km), and two are low resolution models (indicated by suffix T126 or ~110 km). Two of the models have coupled models (CFS), and two are atmospheric models (GFS). Each model shares the same dynamic core but slightly different physics and resolutions. Each model has 4-member ensemble runs. Thus, we have a total of 4 × 4 = 16 ensemble members from the CFST126, CFST382, GFST126, and GFST382 models for runs from each set of condition. Atmospheric and oceanic initial conditions were generated by NCMRWF and INCOIS, respectively. The sea surface temperature boundary conditions for the GFS were derived from the CFS runs. Since the CFS sea surface temperature has a bias, a simple bias correction using observed climatology was applied to generate the final input boundary conditions for the GFS.
Fig. 2.
Schematics of the end-to-end forecast and dissemination system implemented for Extended Range Prediction in India. Abbreviations: CFSv2: Coupled forecasting system version2; GFSv2: Global forecasting system; T382 and T126 suffixes specify the CFS and the GFS model horizontal spatial resolutions and different spectral truncations. T382 implies models CFS or GFS model run at ~38 km resolution. In comparison, T126 indicates the model to run at ~110 km spatial resolution. The suffix “bc” suggests that the GFS runs with bias-corrected sea surface temperature (SST) as boundary conditions. “FCST” indicates forecast runs, and ICs indicate initial conditions from which the model is run. INCOIS (Indian National Center for Ocean Information services) and NCMRWF (National Centre for Medium-Range Weather Forecasting) generate the ICs (i.e., initial conditions) for the operational forecasts. Models are an adapted version of models developed at the National Centre for Environmental Predictions (NCEP), USA, which also generates the ICs. MISO or MJO is the intra-seasonal monsoon oscillations and the Madden Julian Oscillations.
There are various metrices for evaluating rainfall forecasts (e.g., Barnston 1992; Huang, Zhao 2022). Several papers have used root mean square errors and correlation coefficients as a first order measure to evaluate the deterministic forecast ability of rainfall in the extended range (e.g., Joseph et al. 2019). Similarly, there are several methods to evaluate hydrological forecasts (e.g., Hoshin et al. 2009; Gilewski, Nawalany 2018). In this study, we computed and compared the “normalized root mean square error” (NRMSE) and “correlation coefficient” of raw extended range weekly forecast data (hereafter ERF) and bias-corrected forecast data (hereafter BERF). For basin averaged extended range forecast, it would be shown that the bias-corrected forecast improves the model performance.
2.3. Bias correction with Normal Ratio Method
For the estimation of missing or unknown rainfall values, a normal ratio method is suggested by WMO (2018). We have adopted a similar approach to perform bias correction of the raw extended rainfall forecast (ERF) by multiplying the Bias correction ratio with the raw ERF rainfall. The normal ratio method is generally used for rainfall estimation, whereas difference correction is advised for temperature and other parameters.
According to the normal ratio method, the missing precipitation is given as:
Where Px is the missing precipitation for any storm at the interpolation station 'x', Pi is the precipitation for the same period for the same storm at the “ith” station of a group of index stations, Nx is the normal precipitation value for the 'x' station and Ni the normal precipitation value for 'ith' station. In our bias correction method, Pi is the precipitation from raw ERF, Ni is the climatology of Pi, Nx is the observed climatology, and Px is the bias corrected ERF.
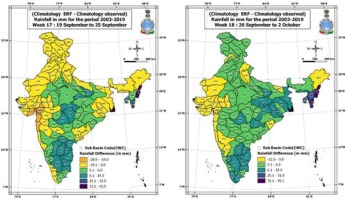
Figure 3 shows the climatological differences between raw ERF rainfall and realized rainfall of 101 sub-basins of India for each of the 18 weeks of southwest monsoon. The first week of this period was from 30th May to 5th June and the last week was from 26th Sept to 2nd Oct (as 18th week). It can be seen that ERF has no systematic bias, as it is overestimating in some areas and underestimating in others. These differences also changed as the monsoon progresses. During the initial onset phase of the monsoon in June, the ERF climatology was higher than the observed climatology in most sub-basins. Still, during the peak monsoon period from July to August, ERF underestimated the rainfall for most sub-basins. Particularly during week number 8 (18th Jul to 25th July), ERF climatology was less significant for all the sub-basins of India – except one sub-basin in the extreme eastern parts of India. Another important finding in ERF was overestimation throughout the season, except one or two weeks for the sub-basins over Bihar, east UP, and adjacent areas. Thus, bias correction based on the normal ratio method has to be applied for all the weeks separately. This overcomes both the underestimating and overestimating of the raw ERF rainfall forecast and makes the prediction closer to the realized one. Thus, the bias correction ratio was different for each basin, as well as for each week during the monsoon onset, progress, and retreat phases.
Fig. 3.
Differences in climatology of raw ERF with realized rainfall climatology for the 18 weeks of the SW monsoon season (2003-2019).


The bias correction ratio for each of the 101 sub-basins and all the 18 weeks during the southwest monsoon season was estimated by the ratio of Actual Rainfall Climatology (for the same week in the period 2003-2019) and ERF Climatology (for the same week in the period 2003-2019). Here we have used the normal ratio in equation (1) for the estimation of missing rainfall, as the bias correction ratio in our bias correction method. This assists in improving the forecast value by giving weight to observed climatology.
Therefore, to improve the accuracy of the sub-basin rainfall forecast, we have adopted a new bias correction method given as follows:
The Bias Corrected Rainfall Forecast for each week and each basin = ERF (Rainfall) for that week X Bias correction ratio for the corresponding week of the same basin.
The correlation coefficient is one of the possible choices for forecast verification (Barnston 1992) and is given as:
where: r – correlation coefficient; xi – values of the x-variable in a sample;
In statistical modeling, another way of measuring the quality of the fit of the model, is the RMSE (also called Root Mean Square Deviation) (Barnston 1992) given by:
where yi is the ith observation of y and ŷi the predicted y value given the model. If the predicted responses are very close to the correct responses, the RMSE will be small. If the predicted and true responses differ substantially – at least for some observations – the RMSE will be large.
To compare RMSE of rainfall forecast of the different river basins with different mean rainfall patterns, we have used Normalized Root Mean Square Error (NRMSE) as:
In the next sections, the NRMSE and the correlation coefficient will be used as the standard skill score measures to evaluate the improvement in the rainfall forecast.
3. Results and discussion
3.1. Performances of forecast
From a hydrological forecast perspective, the monsoon onset phase is perhaps the most important phenomenon. Every year, the onset over Kerala, and its subsequent propagation over the Indian Landmass, is monitored for agrometeorological predictions. The onset phase is often associated with a northward propagating rainfall pulse, providing rain over large regions of India and several river basins.
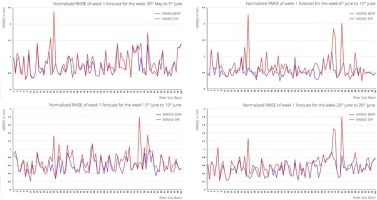
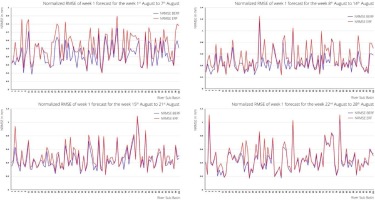
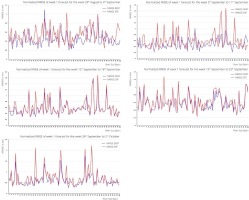
Rainfall during the onset phase of the monsoon is crucial for agricultural planning. Additionally, most flood events occur during July and August, when the monsoon is active. Week-by-week performances of the week 1 extended-range forecast, as well as the bias-corrected forecast, are shown for June (Fig. 4a), July (Fig. 4b), August (Fig. 4c), and September (Fig. 4d) of 2003-2019.
Fig. 4b.
Normalized RMSE (NRMSE) of Bias corrected ERF (BERF) and raw ERF of Week 1 rainfall during July.
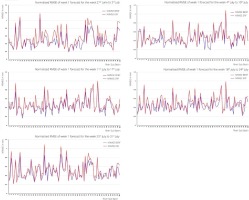
Fig. 4d.
Normalized RMSE of Bias corrected ERF (BERF) and raw ERF of Week 1 rainfall during September.
For all the weeks, the Normalized RMSE of bias-corrected ERF was less than 1 in most cases and for most sub-basins. In week 1 (Fig. 4a), due to bias correction, NRMSE of ERF has been reduced from 2.4 to 0.5 for the Drainage Area of Andaman and Nicobar Islands sub-basin, from 1.6 to 0.4 for the Drainage Area of Lakshadweep Islands sub-basin, from 1.7 to 1.4 for the Sulmar sub-basin, 1.0 to 0.7 for the Kynchiang sub-basin, and other south-flowing rivers of Barak basin during onset phases of the SW monsoon. For all four weeks of June (Fig. 4a), NRMSE of these sub-basins were high (more than 1.5) for raw ERF, whereas due to bias correction, NRMSE has come down by around 0.5. Furthermore, for all four weeks of June, NRMSE of bias-corrected ERF was less than the NRMSE of raw ERF. This was within 0.2 to 0.9 for all the sub-basins, except a few sub-basins in the first week and one sub-basin in the second and third weeks.
In the first week of July (27th Jun to 3rd July) (Fig. 4b), the bias corrections of several sub-basins have helped to improve the NRMSE by keeping it less than 0.8. In the following two weeks, though the NRMSE of bias-corrected ERF was less than the raw ERF for all the sub-basins, there was no significant improvement. However, in the last two weeks of July, significant improvement of the ability of bias-corrected ERF was seen for most of the sub-basins.
There is a remarkable improvement in the skill of bias-corrected ERF for the first two weeks of August (Fig. 4c), as NRMSE of bias-corrected ERF was between 0.2 to 0.6 in most of the sub-basins. Since most of the floods in India occur during July and August, bias correction can help improve flood forecasts and better flood management.
Even during all the weeks of September (Fig. 4d), bias correction reduced the NRMSE value to well below 1.0 of the NRMSE value and greater than 1 of raw ERF.
3.2. The spatial pattern of Extended Range onset forecast skill for the period 2003-2019
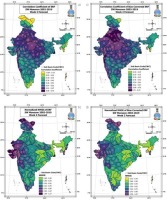
To demonstrate the skill of the extended range forecast for the 1-week and 2-weeks lead-time during the monsoon season, we have computed the correlation coefficient and the normalized root mean square error (NRMSE) map between the ERF and observed rainfall for the years 2003-2019. The samples consisted of 18 weeks and 17 years (18×17 = 306 samples) for each of the 101 sub-basins for the monsoon season. Figures 5a-b shows the basin-wise map of the correlation coefficients and normalized root mean square error for the raw ERF (left panels), respectively. The plot indicates relatively high correlations in the central and northern Indian basins and relatively low correlations in the southern peninsular basins. Furthermore, there were low correlations and higher NRMSE in the Jammu, Kashmir, and Ladakh regions. The root mean square error in Figure 5b shows that the model had the lowest error in central and northern India.
Fig. 5.
(a) Correlation map of 1-week actual forecast, (b) RMSE of the actual forecast, (c) same as (a) but showing the cc map for bias-corrected forecast, (d) same as (b) but showing RMSE of bias-corrected forecast.
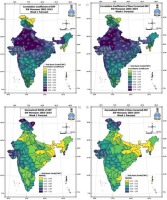
Similarly, Figures 5c-d show the same skill metrics for the bias-corrected forecast. The bias-corrected forecast shows some improvement in correlation skills in the Maharashtra sub-basins and some basins of pen-insular India. There was also a significant decrease in RMSE over the basins of central to southern peninsular India.
Figure 6 shows the same skill plots but for the 2-week forecast.
3.4. Floods in Maharashtra and Bihar during 2019 and the evaluation of skill forecast for the year 2019
In 2019, several parts of the country had experienced severe floods affecting lakhs of people (Shagun 2019; Kambli 2020). During July and August 2019, heavy flooding occurred in Maharashtra due to intense rainfall. The Sangli and Kolhapur district in the Krishna sub-basin experienced severe floods of long durations. Substantial losses of life, property and crops were reported. At the beginning of the flood period, i.e., from 27th Jul to 3rd Aug, heavy rainfall events were localized in the northern part of the Konkan and adjoining North Madhya Maharashtra. Many stations in the Pune and Nasik districts recorded rainfall of more than 150 mm/day from 3rd to 5th August. Towards the latter part of the week, the rainfall belt shifted towards southern Madhya Maharashtra. Mahabaleshwar recorded the highest rainfall of 380 mm on 5th Aug 2019. It is also observed that the Kolhapur district continuously experienced heavy rain throughout this period, with the highest rainfall amounts on 6th Aug 2019. Gaganbawda recorded its highest rainfall of 340 mm on 6th Aug 2019. It is also seen that, though heavy rainfall occurred in the western part of the districts in Madhya Maharashtra, their eastern parts were devoid of rainfall. Furthermore, during the heavy rain spell of Aug 2019, many stations in the Kolhapur district and western parts of the Sa-tara district have surpassed their previous record of 7 days rainfall. Compared to 2018, rainfall over the region was widespread and remained very intense for an extended period from 27th Jul to 13th Aug 2019 (Government of Maharashtra 2020). The expert committee of the Government of Maharashtra recommended that IMD 1-week and 2-week river sub-basin rainfall forecasts should be used in flood forecasting to improve the accuracy of the forecast. Another major affected state was Bihar, where around 306 lives were lost due to floods and heavy rain.
We have analyzed the 1-week forecasted rainfall of raw ERF compared to the actual rainfall for all the sub-basins of these two states, and showed how the bias-corrected forecast could have helped the flood management. The losses could have been minimized by using the bias-corrected forecast for these regions.
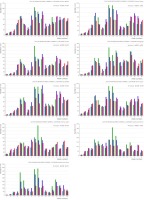
Figure 7 shows the realized, bias-corrected ERF and ERF rainfall for 18 weeks of SW Monsoon season of 2019. This includes the sub-basins viz. Godavari Upper, Godavari Middle, Wardha, Wainganga, Tapi Middle, Bhima Upper, Krishna Upper, Bhatsol and others, and Vasishti and other Flood-affected Maharashtra states. In the 9th and 10th weeks (25th Jul to 31st Jul and 1st Aug to 7th Aug), all nine of these sub-basins reported a significant increase in rainfall compared to previous weeks, which raw ERF was not able to predict in most of the cases. The sub-basins Weinganga, Vasishti, and others also reported increased rainfall activity in 11-weeks. The raw ERF underestimated the rainfall for all these basins. Applying the bias correction forecast to rainfall from these basins was almost comparable to that of the realized rainfall, indicating the usefulness of the bias-corrected Week 1 rainfall in improving flood management.
Fig. 7.
Realized, Bias corrected ERF (BERF) and ERF rainfall for 18 weeks of the 2019 SW Monsoon season in 9 sub basins of the flood affected Maharashtra state.
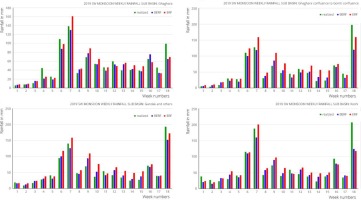
For the Bihar flood, we have selected four sub-basins viz. Ghaghara, Ghaghara Confluence to Gomti confluence, Gandak and others, and Koshi. Figure 8 shows the realized, bias-corrected ERF and ERF rainfall for 18 weeks of the 2019 SW Monsoon season for sub-basins of Flood-affected Bihar. In the 6th and 7th weeks, all four sub-basins have reported increased rainfall activities causing devastating flooding over this region. The week 1 raw ERF rainfall has been overestimated in all these cases. The bias correction could help to minimize the differences between observed rainfall and forecast rainfall.
Fig. 8.
Realized, Bias corrected ERF (BERF) and ERF rainfall for 18 weeks of SW Monsoon season 2019 of sub basins of flood-affected districts of the Bihar state.
To see the performance of raw ERF and bias-corrected ERF for the year 2019, the correlation coefficient between observed and forecast rainfall and normalized RMSE was calculated using 18 samples (all eighteen weeks of SW monsoon 2019) for both the 1-week and 2-week lead forecasts. Figure 9 shows the (a) correlation and (b) RMSE of the raw extended range forecast, calculated using the weekly data for the year 2019. (c) same as (a) but after using bias correction. (d) same as (b) but after using bias correction for the 1-week lead forecast.
The left column shows the raw extended range forecast, and the right column shows the corresponding bias-corrected forecast. There was a significant improvement in the correlation coefficient for most sub-basins, mainly over the northern and central parts of India. The normalized root means square error shows that there was a considerable improvement in the bias-corrected forecast, especially in the east and central parts of India, as normalized RMSE has been reduced to less than 0.3 due to bias correction over these parts. Additionally, in the western parts of Maharashtra, NRMSE has been reduced from near 1 in raw ERF to less than 0.5.
Fig. 9.
(a) Correlation and (b) RMSE of the raw extended range forecast calculated using the weekly data for the year 2019 of 1-week forecast. (c) same as (a) but after using bias correction. (d) same as (b) but after using bias correction.
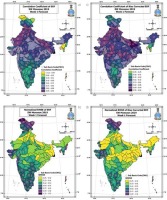
Figure 10 shows the (a) correlation and (b) RMSE of raw extended range forecast calculated using the weekly data for the year 2019. (c) same as (a) but after using bias correction. (d) same as (b) but after using bias correction for the 2-week lead forecast.
Fig. 10.
(a) Correlation Coefficient and (b) RMSE of raw extended range forecast calculated using the weekly data for the year 2019 of the 2-week forecast (c) same as (a) but after using bias correction (d) same as (b) but after using bias correction.
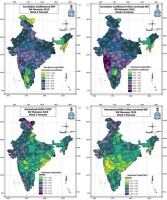
The left column shows the actual extended range forecast, and the right column shows the corresponding bias-corrected forecast. In the 2-week forecast, the correlation coefficient for the sub-basins of Maharashtra has been increased from around 0.7-0.8 in raw ERF to 0.93-0.97. The correlation coefficient is between 0.7-0.8 in most of the sub-basins of central India in the bias-corrected forecast. Normalized RMSE is also less than 0.5 in the bias-corrected forecast for most of the sub-basins of India, with central India being less than 0.3.
4. Conclusions
For efficient flood and disaster management, an accurate rainfall forecast is essential to provide a quantitative prediction of precipitation during the June to September (monsoon) season over river basins of the Indian subcontinent. The weekly averaged extended range rainfall forecast of up to 2-weeks lead-time is important, as it provides a valuable input for generating flood forecast models in a time-scale that is crucial for water and dam management. A proper rainfall forecast with a longer lead time is always desirable to manage floods and their impact on disaster risk reduction. India's present operational flood forecasting models are primarily dependent on 1-3 days quantitative rainfall forecast and a forecast of up to 5 days generated by India Meteorological Department. In the extended range (i.e., 2-weeks lead time) the rainfall forecast is often not accurate, owing to the decrease in rainfall amplitude. In the current study, we have provided a comprehensive basin averaged rainfall skill analysis over different sub-basins of India, using the extended range retrospective forecast and proposing a bias correction method to improve the rainfall forecast in the extended range. We have found that the extended forecast has an unsystematic bias (i.e., overestimation and underestimation) for weekly averaged rainfall. The bias in precipitation is not systematic, and different sub-basins show the bias of different amplitude. Such amplitude biases would likely impact forecast ability. Our bias corrected forecast has shown significant skill in predicting sub basin rainfall of 1-week as well as 2-weeks lead time.
We hypothesized that a part of the amplitude bias might be associated with systematic forecast model bias. Due to rainfall forecast error associated with model physics, dynamics, and several other factors, such biases can arise. Using an amplitude correction method based on the “Normal Ratio” correction method from the WMO manual, we devised an approach to see if the normal ratio correction would improve the first-order skill scores (root mean square error and correlation) for weekly extended range forecast over the Indian land region. The results show an encouraging improvement in statistical skill scores for several river basins over India. The long-term (2003-2019) skill analysis shows enough improvement in the weekly mean forecast. Similarly, case studies over the Maharashtra and Bihar river basins for 2019 show significant improvement in the weekly mean rainfall estimates. We also verified the week-by-week forecast from the onset to the withdrawal phase. The onset phase rainfall forecast over different sub-basins shows sufficient improvement. We propose that the analysis could be used as a background for operational forecast bias correction using the normal ratio method. This can be implemented for products based on extended range forecast and all forecast products in the sub-seasonal to seasonal (s2s) time-scale. Thus, these extended range basin rainfall forecasts of 1-week and 2-week lead times have shown good skill during the 2003-2019 period. In addition to existing flood forecasting systems of the central water commission of India, these findings can be used for generating flood forecasts with longer lead times to reduce disaster impacts.

