1. Introduction
Climate change necessitates sustainable development strategies for countries with economies in transition (Corobov 2011). Socio-economic challenges in the Dniester River basin are associated with an uneven distribution of runoff along the length of the river. The river basin is divided into a runoff formation zone and a runoff management zone. The formation zone covers about 1/3 of the total catchment area and belongs to the region of excess and sufficient water content. This zone is called the Upper Dniester. A major part of the water runoff in this zone enters the main river from the Carpathian right-bank mountain tributaries, and the smaller part from the left-bank, lowland Podolsk tributaries.
The topical task of hydrology in the upper part of the Dniester River catchment area is flood protection during spring floods and high-water periods. In the middle and lower parts the main task is the search for ways to control the current shortage of water resources. The solution to these problems was achieved through long-term regulation of the runoff by the Dniester and Dubossary reservoirs. The Dniester reservoir is designed to provide hydropower and has a negative impact on the aquatic ecosystem of the middle and lower parts of the Dniester River basin. The hydrological regime and the hydro-ecological status of the Middle and Lower Dniester are completely dependent on the dates and volumes of releases from the Dniester reservoir which do not always meet environmental requirements. Climate changes in the early 21st century exacerbated the uneven distribution of runoff along the length of the river. The dependence of the water content of the entire river on the volume of water in the formation zone has increased. To solve the environmental problems of the Dniester, the Environment and Security Initiative (ENVSEC 2015) suggested a project on “Promotion of transboundary cooperation and integrated water resources management in the Dniester River basin” at the request of the governments of the Republics of Moldova and Ukraine. According to Libert (2019), international organizations such as OSCE, the UNECE, and the ENVSEC are currently taking measures to adapt the Dniester basin to climate change. Further strategies for the use of water resources of the Dniester River will depend on forecast data on the changes in runoff volumes in the formation zone.
This paper is aimed at a search for the prevailing trends in dynamics of the maximum water runoff characteristics of the upper Dniester in the late 20th and early 21st century, whence significant climate changes have occurred. Perspectives for changes in maximum flow determine the strategy of river water resources management in the future. Positive trends will require expansion of flood and landslide protection, whereas negative trends will require the use of long-period storage reservoirs for saving and redistributing water resources within the river basin. The area of study includes the alpine (Ukrainian Carpathians) and lowland (Podolia) tributaries of the Dniester River located in the runoff formation zone. The subject of study is trends in maximum runoff by months and seasons. The main research method is the non-parametric Mann-Kendall test for monotonic trends over time.
An analysis of research papers on relationships between climate change and the runoff of mountain watersheds leads to conflicting conclusions (Sayemuzzaman, Manoj 2014; Pluntke et al. 2016; Piniewski et al. 2017; Szwejkowski et al. 2017; Mangini et al. 2018; Kohnová et al. 2019). The fact is that the main climatic factors involved in the formation of river runoff are air temperature and precipitation. The first factor is characterized by some inertia, and the second one is variable both in time and in space. In the mountains, as a rule, the determining factor in runoff formation is precipitation, the spatiotemporal distribution of which depends on the geographic location of the study area, its distance from the sea (ocean), the orientation of the mountain slopes with respect to the direction of the main moisture transfer by air currents, and the type of mountainous terrain and location of mountain ranges.
International organizations (ENVSEC, UNEP, UNECE, OSCE etc.) place high emphasis on long-term fore- casts of changes in river runoff characteristics in various regions of the Earth in accordance with climate scenarios. According to the research under the international project “Climate Change and Security in Eastern Europe, Central Asia and Southern Caucasus”, with the component of “Climate Change and Security in the Dniester River Basin” (ENVSEC/UNECE/OSCE 2015), the Dniester River runoff formation zone will experience an increase in the average long-term air temperature of +1°C during 2021-2050 compared to 1981- 2010, and the annual precipitation will increase 1-2%. No changes in the average long-term runoff in the mountainous part of the Dniester are expected, and in the plains within the study area, the runoff may decrease from 0 to 10%. The same paper indicates the possibility of a significant increase in the intensity of floods during the warm period (by 30-40%). The report by the transboundary (Ukraine-Moldova) project “Reducing vulnerability to extreme floods and climate change in the Dniester river basin” (ENVSEC 2013), being implemented under the Environment and Security Initiative (ENVSEC), mentioned that considerable changes in maximum discharges in the mountainous part are not expected for the period 2021-2050. In Podolia (the plains), flood reduction by 15-16% is possible (the A1B scenario, the REMO, ECHAM5 model). According to forecasts, the intra-annual distribution of the runoff of Carpathian rivers may change as follows: runoff during the cold season will increase, runoff during spring floods will decrease, with peaks shifting to earlier dates, and the frequency of floods will increase. Substantial changes in the maximum runoff in Podolia are not expected. A comprehensive paper by authors from several countries (Blöschl et al. 2019), examined the changes in the maximum runoff of European rivers under global warming (1960-2010). It was observed that in Eastern Europe there was a decrease in floods and the snow melt shifted to earlier dates. These tendencies are assumed to persist in the future.
Various conditions for the formation of the upper Dniester maximum runoff make it necessary to further analyze the dynamics of its changes and identify the main trends.
2. The study area
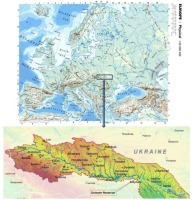
The Dniester River is transboundary and belongs to the Black Sea basin. The river catchment stretches from the northwest to the southeast. The total length of the river is 1,350 km. The catchment area is 72,300 sq. km, 72.1% of which belongs to Ukraine, 26.8% to Moldova, and 0.4% to Poland (Fig. 1). The average long-term annual runoff of the Dniester river is 10 km3. According to Sukhodolov et al. (2009), the river water is used by various consumers (drinking and municipal water supply, agriculture, and industry).
The area of river runoff formation is located at the Ukrainian Carpathian Mountains (at altitudes of 300-1100 m). The area of intensive consumption is located in the middle and lower reaches of the river (Forest-Steppe and Steppe geographical zones). The intensity of water consumption increases with the transition from the Forest-Steppe geographical zone to the Steppe. The river is fed from snow and rain sources, and during the low water period from groundwater. Sources of Dniester River runoff in the formation zone differ: rain pre- dominates in the mountains, and snow on the plain. The response of water resources to climate change since the late 20th century is also different for lowland and alpine rivers. In lowland rivers, the increased air temperatures in the cold season and their transition from negative to positive reduces the depth of frost penetration into the soil, and thus, the accumulated water reserves in the snow cover before snowmelt begins. More frequent winter thaws contribute to the formation of winter floods and melt water filtration into subterranean aquifers, which is facilitated by the presence of karst, easily eroded rocks, in the basins of the left-bank tributaries. As a result, the maximum discharges during spring floods decrease, and the runoff during the low-water period increases; there is a shift to earlier dates of snowmelt and spring flood onset.
In the mountains, the distribution of climatic factors and runoff depends on altitude. The response of the temperature regime to changes in the climate system is slower compared to the plain. The main source feeding alpine rivers is rain floods, which form almost every month. The maximum runoff values during rain floods can significantly exceed the maximum values during spring floods. Thus, the role of precipitation changes in the formation of alpine river runoff is fundamental in comparison with the changes in air temperature.
3. Methodology and data
3.1. Factor analysis
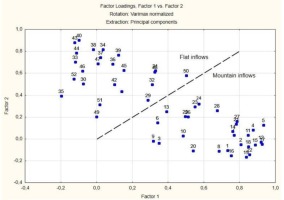
Factor analysis was applied to zoning according to similarities in fluctuations of maximum runoff within the upper part of the Dniester River basin. Districts were identified by means of graphs, on the axes of which factor loads were marked. The closer the points are located on the graph, the closer the relationship between the series of observations. Sets of closely spaced points form a district with synchronous runoff fluctuations. The location of centers of the sets at an angle close to 90 degrees indicates non-synchronism. Non-synchronism of fluctuations in the studied parameter is the result of differences in the runoff formation conditions in the territory under study.
The general principles of factor analysis and their use in mathematical software packages are widely described in the literature, e.g., Pituch and Stevens (2016). We applied the standard module “Factor analysis” of the Statistica program, using catchment areas (Catchments) as variables, and observation years as cases. The factor extraction method was principal components, and the factor rotation method was Varimax normalized.
3.2. Difference cumulative (Residual mass) curve
To assess the spatiotemporal fluctuations in the maximum runoff and to identify the phases of high and low water content, we used the graph of the difference cumulative curve. These graphs are often used to determine long-term cycles in runoff fluctuations (Zabolotnia et al. 2019). The ordinates for this curve f(t) are accumulation over time for the sum of deviations of the relative values of discharges from one:
where: T is the number of observation years, k(t) = Q(t)/Qaver. is the modular coefficient; Q(t) is the maxi- mum daily discharge for a year, Qaver. is the average value of the maximum daily discharges for the entire observation period, and the average value of the modular coefficient for a long-term period is one: kaver. = 1.
The period for which the integral curve section has a slope upward with respect to the horizontal line corresponds to the positive phase of the runoff fluctuations. The period for which the integral curve section has a slope downward with respect to the horizontal line corresponds to the negative phase.
3.3. Mann-Kendall test
The main research method for revealing statistically significant trends was the Mann-Kendall test, which is widely used in hydrology (Yue, Pilon 2004; Khan et al. 2015). The Mann-Kendall test uses nonparametric criteria for testing the significance of a trend. Statistics S has the following form:
where n is the number of observations.
For n ≥ 40, the statistics S will be asymptotic, subject to the normal distribution law, in which the average value is zero, and the variance is calculated by the following equation:
where t is the size of this related group; ∑t is the sum of all related groups in the data sample. The standardized verification statistic Z is calculated by the equation:
The statistic Z follows the standard normal distribution law with a mean of zero value and a unit variance (Yue, Pilon 2004).
The values p of the statistic Z is determined from the tables of a two-sided function of the normal integral distribution.
In many papers (Pujol et al. 2007; Svensson et al. 2009; Melnyk, Loboda 2018) the concept of “trend index” (Ti) is used for assessment of a trend. In Kundzewicz et al. (2005) use of Ti is explained that: “the value of the Mann-Kendall test statistic is hard to interpret; therefore, the results are stated using the trend index (Ti), a measure directly related to the computed significance level (p value), α, or to the confidence level (1 – α).” It is calculated as Ti = (1 – α)•100% for a positive trend and Ti = – (1 – α)•100% for a negative one. For two-tailed tests, Ti ranges from –100% to +100%.
Negative values of Ti indicate a tendency to decrease, and positive values indicate a tendency to increase in the studied parameter.
3.4. Peak-over-threshold (POT)
To determine the trends of extreme hydrological phenomena frequency, the method for calculation of changes in the frequency of discharges exceeding the threshold value, peak-over-threshold (POT), was chosen. For each river, discharges which were exceeded on average 3 times year over the observation period, were taken as a threshold value (POT3). This method has been widely used in hydrological studies, e.g., by Svensson et al. (2009), Mangini et al. (2018).
3.5. Initial data
Observational data on daily maximum water discharges for 1981-2015 for 22 catchment areas in the mountainous part of the Dniester River basin (6 stations of which are located on the main river) and 24 catchment areas in the plains at the left bank are used in the paper (Table 1). To build the series of initial data on runoff in each month of the current year, the maximum daily water discharge was selected. The calculation period was chosen based on research into the patterns of fluctuations in the annual runoff of the Dniester River at the Zalishchyky site (1949-2015). This site is the last hydrological site (of all hydrological stations located up- stream), in which runoff fluctuations retain a natural (undisturbed by regulation) pattern. The Dnistrovske reservoir is situated below the Dniester River Zalishchyky site.
Table 1.
List of selected catchment areas along the Dniester River Basin within Ukraine.
4. Results
At the first stage of factor analysis, the variance is calculated and explained by each successive factor. In our case, the first factor accounts for 36% of the total variance, and the second one 25%. Subsequent factors account for 6% or less. Therefore, the data matrix was analyzed with 2 factors. The results are given in Figure 2, where two sets of points are marked out. The first set includes lowland rivers (left-bank tributaries of the Dniester River), and the second set alpine ones (right-bank tributaries of the Dniester River). Marking-out of the two districts allows us to conclude that there are differences in fluctuations in the maximum runoff between left-bank and right-bank tributaries. The physical interpretation of the results is that the maximum runoff of alpine rivers is formed as the combined result of snow melt and rainfall, whereas the maximum runoff of lowland rivers is formed mainly during spring floods owing to snow melt.
A similar approach based on the analysis of correlations between the series of maximum runoff values was used in the paper by Viglione et al. (2010).
Fluctuations in the mainstem river runoff are determined by the patterns of fluctuations in the runoff of alpine tributaries, since a major part of the runoff is formed in the mountains. That is why the stations located on the main river are assigned to the mountainous region.
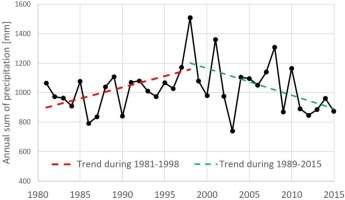
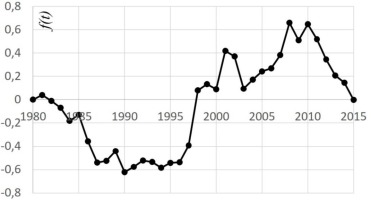
Fluctuations in runoff are cyclical. An analysis of the patterns of these fluctuations based on difference integral curves was performed for both annual and maximum runoff over the entire observation period (1949- 2015). Based on the difference integral curves, three complete cycles of river discharge were identified: 1949- 1980, 1981-1998, and 1999-2015 (Fig. 3). The last two cycles (1981-2015) relate to the period of increased air temperatures (Fig. 4). In the fluctuations in annual precipitation during this period (Fig. 5), two cycles, 1981- 1998 and 1999-2015, are also distinguished; in what follows, they are considered as calculation intervals.
Fig. 3.
The residual mass curves of annual and maximum runoff, Dniester – Zalishchyky site). If the curve goes up, then a positive phase of flow fluctuations is noted, if down, negative.
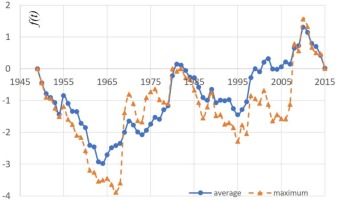
Fig. 4.
Fluctuations of annual temperatures at meteorological stations Ternopil (left-bank area, altitude of 300 m) and Slavske (the Ukrainian Carpathians, the altitude of 600 m).
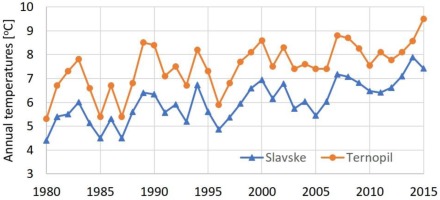
Fig. 5.
The residual mass curves of annual precipitation for the period of 1980-2015, Slavske meteorological station.
The values of the trend index ǀTiǀ were defined for each month, season, and year. The presence of trends was indicated by the sign of the index (Ti), with selection of the predominant sign and calculation of the absolute and relative frequency of the event.
The presence of statistically significant trends was identified when the condition (ǀTiǀ > 0.9) was met. The relative frequency of an event or an empirical probability was estimated as the ratio of the number of cases when the studied event was observed to the total number of events considered. As an example, the trend indices for specific sites are given in Table 2.
Table 2.
Monthly trend indices (Ti) for 1999-2015 for specific sites (statistically significant values are shown in bold). River (water gauge)
Assessment of the empirical probability of tendencies and statistically significant trends in the fluctuations of the daily runoff maxima by months showed that they occurred most often in the calculation interval of 1981- 1998 (March, October, November, and December) and were not found in the period of 1999-2015. For the alpine tributaries (Table 3), in contrast to the lowland tributaries (Table 4), the frequency of positive indices Ti > 0 in 1981-1998 was also observed in the summer months (May and July), owing to formation of rain floods in the mountains. For the lowland tributaries in the summer months there is a low water season and rain floods are rarely formed. Therefore, positive tendencies and trends were not identified.
Table 3.
Relative frequency of appearance [%] of tendencies and trends in fluctuations in the daily maxima for alpine tributaries of the Dniester River by months.
Table 4.
Relative frequency of appearance [%] of tendencies and trends in fluctuations in the daily maxima for left-bank (lowland) tributaries of the Dniester River (Ukraine) by months.
The increase in air temperatures in the late 20th and the early 21st century (Table 5) is of great importance in formation of positive maximum runoff trends in the cold period months (December-March). A significant increase in air temperatures in March with their transition from negative to positive values (March for the calculation interval of 1981-1999) was one of the reasons for occurrence of a large number of cases with positive temperatures (Ti > 0) and (Ti > 0.9).
Table 5.
Average monthly air temperatures [oC] for various calculation periods (Ternopil weather station).
The absence of positive tendencies and trends in the second calculation period (1999-2015) results from a decrease in the amount of precipitation compared to the previous period of 1981-1998. which is clearly seen in Figure 6.
During the study of the patterns of fluctuations in maximum runoff by season positive tendencies were observed for the autumn and winter seasons for both lowland and alpine rivers in the period of 1981-1998 (Table 6, Table 7). Statistically significant positive trends were identified only in the maximum runoff of alpine tributaries that is associated with a greater amount of rainfall in the mountains compared to the plain areas. In the period of 1999-2015, all identified tendencies and trends are negative.
Table 6.
Relative frequency of appearance [%] of tendencies and trends in the daily maxima for alpine tributaries of the Dniester River by season.
Table 7.
Relative frequency of appearance [%] of tendencies and trends in the daily maxima for left-bank (lowland) tributaries of the Dniester River by season.
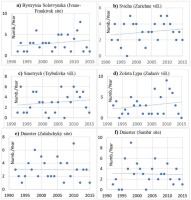
According to several research papers, e.g., European Academies’ Science Advisory Council (EurekAlert! 2018), a significant increase in the frequency of extreme hydrological events was observed during 1980-2016. To test the hypothesis of an increase in the frequency of floods in the studied area, a selective analysis was conducted of the change in frequency of discharges that were exceeded 3 times a year on average during the observation period (i.e. a peak-over-threshold analysis, or POT3).
For calculation of the Ti index, 6 sites with an observation period of 1992-2015 were selected. Of the 6 studied sites, 2 sites are located on the right-bank tributaries, 2 on the left-bank tributaries and 2 on the mainstem river, but upstream from the Dniester reservoir (Zalishchyky site). The results obtained (by the chosen method) allow us to conclude that there are no statistically significant trends in the frequency of floods (Fig. 7).
5. Discussion
This article can be viewed as a continuation of the discussion on the presence of maximum flow trends for rivers of the European continent, proposed by a number of authors: Pujol et al. (2007), Kundzewicz et al. (2013), Mangini et al. (2018), and Kohnová et al. (2019).
On the maps of hydro-climatic regions in Europe based on a bio-geographical classification provided by the EEA, which is cited in a number of papers, e.g., Walter Mangini et al. (2018), the study area is located in two districts: alpine and continental. This is in good agreement with the results of our factor analysis. It is significant that the water regime of the main river (the Dniester) is determined mainly by the water content of the alpine district.
The autumn increase in maximum runoff we identified in the late 20th century was also observed in other regions of Europe, e.g., France (Pujol et al. 2007).
For the south-western part of Poland and eastern Saxony a similar increase, especially in the mountainous part, is accounted for by increased precipitation at altitudes of 350-650 m (Pluntke et al. 2016).
The increased maximum runoff in March for the study period is explained by warming, the transition of the average air temperature in the river basin from below to above zero degrees (Table 4). This phenomenon causes intensive snow melting, which increases the maximum runoff. Such changes have been found in basins throughout eastern Europe (Blöschl et al. 2019).
In the Upper Dniester basin, no change in the frequency of floods (POT freq) was identified. In this matter, the results in this paper coincide with the trend analysis through 2000 worldwide by Svensson et al. (2009) and through 2005 in Europe by Mangini et al. (2018).
Negative trends observed in the maximum runoff of the Upper Dniester (1999-2015) confirm conclusions about decreases in runoff maxima for eastern Europe, obtained by analysis of data through 2010 (Hall et al. 2014; Blöschl et al. 2019).
Although the Mann-Kendall test can detect the presence of monotonic trends oscillations, even if significant, are not detected (Fig. 8). For the latter purpose, confidence intervals can be used.
Fig. 8.
The maximum daily discharge for July on the river Bystrytsia (Ozymyna site), Ti = −0.18; Linear trend obtained from data on the maximum daily discharge constructed by the Mann-Kendall method.
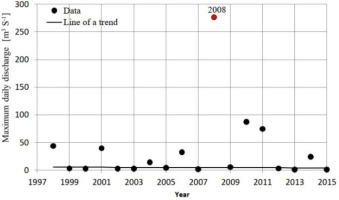
During catastrophic rain floods with a low probability of occurrence (1-2%), large areas may be flooded. Such rainfall floods were observed on the Dniester River in summer in 2008 and 2020.
6. Conclusion
I. Factor analysis of fluctuations in the maximum runoff of the rivers of the Upper Dniester basin has made it possible to distinguish two regions: mountain and plain. These regions are characterized by different origins of the maximum runoff in the mountains and on the plain.
In the mountains, runoff maxima are observed mainly during rain floods, and on the plains mainly during spring floods. Therefore, the search for trends in runoff maxima by months and seasons by means of the Mann-Kendall test (Ti) has been performed separately for lowland and alpine rivers.
II. The tendencies have been identified by the number of cases when Ti > 0 or Ti < 0, and the statistically significant trends by the number of cases when Ti > 0.9 or Ti < −0.9.
III. The tendencies observed are the same in both mountain and lowland areas, since they are due to precipitation. The influence of the air temperature changes is not yet significant.
IV. The research has shown that the late 20th century period (1981-1998) was characterized by the presence of statistically significant positive trends in the winter and autumn seasons, revealed in fluctuations in the maximum runoff. A steady tendency towards an increase in the daily maxima has been identified for March, October, and November.
V. The early 21st century (1999-2015) was distinguished from the previous calculation period (1981-1998) by the presence of exclusively negative tendencies and statistically significant trends for both months and seasons, i.e. there has been a steady tendency to decreased maximum water runoff for all the rivers of the Upper Dniester basin.
VI. Statistically significant trends in changes in the frequency of extreme events (floods) have were not found.
VII. The results show that the ongoing climate change in the Upper Dniester basin may cause both an increase and a decrease in the maximum river runoff. The major role in trends in the maximum runoff is played by precipitation. The role of thaws in the cold season may increase, especially in the lowlands, where most of the annual runoff is formed by snow melt.
VIII. The possibility of catastrophic rain floods and the predominance of the role of precipitation in the formation of the Upper Dniester runoff allow us to conclude that in order to adapt to climate change in the 21st century, it is necessary to regulate the river runoff through reservoirs and build structures to protect against floods and landslides.
IX. The results reported here comport with the conclusions of other authors about the existing trends in the maximum river flow in mountainous regions.

