1. Introduction
Gustavus Hinrichs (1888), an American scientist, first proposed the term derecho ("straight" in Spanish) in meteorology as a designation for an extensive convective system with long-lived convective straight-line windstorms, unlike the formation of vortical wind systems.
There are several approaches for derecho identification, one of them proposed by Johns and Hirt (1987). The first criterion requires the main axis of the damage area (wind gusts over 26 m/s) to reach 400 km. The damage reports must show the chronological progression. Moreover, there must be at least three reports of F1 damage or gusts over 33 m/s within the area, separated by 64 km and with no more than 3h elapsed between them.
Initially, it was postulated that the development of the derecho was strongly correlated with high CAPE (Convective Available Potential Energy >2000 J•kg-1) and the occurrence of strong vertical wind shear in the lower troposphere (>20 m•s-1, at an altitude of 2.5-5 km) (Weisman 1993, 2001). The studies of Duke and Rogash (1992), Bentley and Mote (1998), Evans and Doswell (2001), and Ashley et al. (2005) proved that derechos could occur at any time of the year, also at significantly lower vertical wind shear, in various environmental conditions with much less instability.
The causes of derecho cases in Europe were analyzed by: Schmid et al. (2000), Punkka et al. (2006), Lopez (2007), Putsay et al. (2009), Walczakiewicz and Ostrowski (2010), Gatzen (2011), Pucik et al. (2011), Simon et al. (2011), and Hamid (2012). An analysis of long-term derecho occurrence in Europe was carried out by Gatzen et al. (2011).
The term precisely associated with a derecho is the characteristic radar echo pattern called bow echo. This bowing convective line segment is often associated with swaths of damaging downburst winds and is sometimes accompanied by tornadoes that may reach a violent rating of F4. Occurring singly, it is called progressive derecho, in contrast to serial derecho, where there are multiple bowing segments (Przybylinski 1995).
Most available articles deal with the bow echoes generally, without pointing out significant vortex structures (Weisman 1993); however, there are some studies that examine the storm development as affected by an embedded supercell (SC) or bookend vortex signatures (Wolf 1998; Atkins, Laurent 2009; Atkins et al. 2004).
Przybylinski (1995) as well as Forbes and Wakimoto (1983) have shown that the strongest damaging wind gusts usually occur along the apex of bowing line segments. Nevertheless, in some cases, an embedded mesocyclone or mesoscale convective vortex (MCV) (Davies, Weisman 1994) can significantly strengthen the potential of damaging wind gusts, both tornadic and downburst-related (Funk et al. 1994) as it was in the case described in this paper.
The first study of derecho cases in Poland was undertaken by Celiński-Mysław and Matuszko (2014). They examined derecho phenomena that occurred between 2007 and 2012 (6 cases). They confirmed that the long-lasting and extensive convective systems causing the derecho often elicit damage comparable to that caused by F0-F2 tornadoes (Celiński-Mysław, Matuszko 2014) and that the damage was caused by the straight-line wind. Whereas, if we consider the frequency of derecho-producing MCSs (mesoscale convective systems) (Zipser 1982) with embedded MCV, this phenomenon is quite rare over Poland (3.5% cases of MCSs in a 10-yr study) (Surowiecki, Taszarek 2020).
In the case of the extensive wind storm that took place over western Poland on August 11, 2017, the damage was generally not generated by vortical winds, but by straight-line winds, except for one report of a possible tornado. This finding contributed, among others, to investigating the case as a derecho.
2. Aim of the study
This paper documents the storm system that occurred over Poland on August 11, 2017, using radar data from the POLRAD network. This case study was made specifically to determine the genesis of the system, the development of an embedded storm SC, the interaction between essential system features, and their impact on the mechanisms responsible for the greatest damage. This article does not provide a detailed analysis of the synoptic and meteorological situation accompanying the formation of the phenomenon (which was provided by Taszarek et al. 2019 and with greater detail by Wrona et al. 2022). Nor does it deliver the standard nowcasting and warning procedures for weather forecasters, but analyses the event in detail, using solely the radar data provided by the IMGW-PIB system. The results of the analyses are presented on the basis of non-standard POLRAD products specifically developed and implemented for this study, which are not available for operational forecasters.
One of the factors influencing the intense dynamics of the derecho was the development of a SC from one of the numerous storm cells formed in the vicinity of the waving atmospheric front in Lower Silesia. This type of thunderstorm is characterized by a deep and persistent rotating updraft (Klemp, Rotunno 1983). To detect the SC on the classic radar scan images, we were looking for basic SC features such as a high-reflectivity compact core on the CMAX product and raised maximum reflectivity on the EHT product (early stage, outside of the Doppler scan), along different movement patterns (Davies, Johns 1993), as well as an inflow notch on the PPI scans, a bounded weak echo region (BWER) on the vertical cross-section Doppler reflectivity scan, and finally the velocity couplet on radial velocity data (later stage, close to radar).
The rear inflow jet (RIJ) was the second important factor responsible for severe wind damage caused by the storm which played a significant role in the formation of bow echo-type storms. It is formed due to the pressure difference between the area of rapid ascent and condensation (low) and the area cooled by rainfall (high) (Rotunno et al. 1988). The strong release of the latent heat is mainly responsible for the pressure difference. Consequently, the strength of the RIJ is primarily influenced by the power of updrafts associated with CAPE as well as the range and potential of the cold pool, i.e. the area of cool air at the surface caused by heavy rainfall. The lower the temperature, the higher the pressure in the cold pool area, and the deeper the local low within the strong updrafts, the stronger the RIJ flow (Lemon, Doswell 1979; Johns, Hirt 1987; Weisman 1992). The RIJ might be so strong that it starts to push a fragment of the storm cell forward, which is marked as bow echo on radar products. Under favorable conditions, strong downdrafts of storm cells can bring a part of the RIJ momentum to the surface, generating heavy squall winds with speeds above 150 km/h (Fujita, Wakimoto 1981).
3. Radar data
The analysis of the phenomenon was based on data from the network of eight POLRAD meteorological radars located in: Legionowo (LEG), Rzeszów-Jasionka (RZE), Brzuchania (BRZ), Ramża (RAM), Pastewnik (PAS), Poznań (POZ), Świdwin (SWI), and Gdańsk (GDA). All devices are Doppler radars, three of which (Rzeszów, Ramża, Pastewnik) have dual polarization measurement functionality. The entire radar network was put into service in 2004.
Each radar operating in the POLRAD network takes two measurements in a 10-minute cycle. The first is a classic scan (operational range is 250 km), otherwise known as the rainfall scan (only a reflectivity measurement is made). The second measurement is a Doppler scan (range 125 km), called a wind scan, the parameters of which are set to obtain the best possible information on radial velocities, radial velocity spectrum, and reflectivity.
After considering the location of the event, it was decided to use data from the Poznań and Gdańsk single polarization radars for the research.
This paper presents analysis of the original radar data (3-dimensional recorded in spherical coordinates) processed into radar products defined in the 2-dimentional Cartesian system (Tuszyńska 2011). Nonstandard products (non-operationally generated) and their combinations were used to study the convective system (Table 1).
Table 1.
The radar products used to analyze the phenomenon.
The products of the radial velocity distribution, such as PPI (V), SRV (V), and CMAX (V) played a special role in the assessment of the nature of the event. They helped to choose the instants for performing more detailed analyses of the system. The flexibility in the definitions of radar products, including the data threshold values, allowed us to develop additional products such as EHT (Height Max Z).
4. Methodology of working with data
The analysis of the processes taking place in the derecho area based on radar data was made particularly difficult by the extreme nature of meteorological events, which also affected the measurement data. Therefore, because of interpretation difficulties and radar measurement errors (Szturc et al. 2010, Jurczyk et al. 2020), the limitations and uncertainty of results had to be kept in mind.
While considering the origin of the phenomenon and its evolution, many problematic issues related to the interpretation of the radar measurements were encountered. The specificity of radar sounding required determining the measurement geometry depending on the location of the phenomenon, and filtering out data from non-meteorological echoes.
The composite maps, integrating observations from the entire radar network via selection of the maximum reflectivity, have shown great usefulness for interpretation of the event along its entire route. Despite the signal dumping in heavy rainfall and during its passage over the Poznań and Gdańsk radar stations, the composite maps properly reflected the course of the event and the migration of the mesoscale convective system.
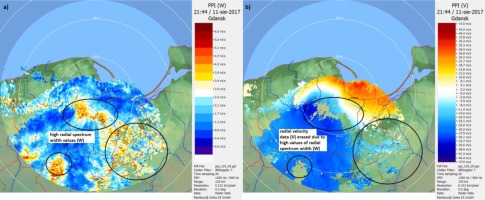
In the analysis of the Doppler scanning of radial velocity, data gaps occurred in some areas. The gaps were mainly related to high values of the radial velocity spectrum (W), which meant that for a given voxel (3D pixel of data) the system received velocity measurements with large uncertainty.
The POLRAD system configuration, oriented towards eliminating many disturbances hindering the operation of the radar, was set in such a way that voxels with high values of W, i.e. places of disturbances or high turbulence, were treated as incorrect data and discarded. Visible clear gaps in velocity data (Fig. 1b) on the PPI (V) scan coincide with the areas of higher values of the velocity spectrum (Fig. 1a) on the PPI (W).
Fig. 1.
The distribution of (a) radial spectrum PPI(W); (b) radial velocity PPI(V) for 0.5 degree elevation – GDA radar.
Another problem was the convective system’s location relative to radar stations. When the system reached its greatest strength, it was out of the Doppler scanning range of the Poznań radar. At the same time, it was also too far from the Gdańsk radar to enable continuous analysis of near-surface wind distribution.
Despite these difficulties, a reliable qualitative derecho analysis was carried out. Reflectivity (dBZ) on composite maps was used to illustrate the overall course of the event. More detailed elements of the storm system were analyzed using radial velocity (V) data, usually in a pair of high-resolution reflectivity PPI products. Also VCUT or MLVCUT vertical sections were performed on properly configured products.
Key radar signatures related to the SC and bow echo were searched. In the early stage of the system we were generally looking for SC signatures, especially the high reflectivity core and BWER. When the system entered the Doppler scanning range of POZ radar, velocity couplets were observed in the area of exploration as evidence of a mesocyclone. While the system was passing the POZ radar, we looked in detail at the radial velocity data in order to detect and estimate the RIJ (rear inflow jet). Many cross-sections were made to find the interaction between this jet and the mesocyclone, especially with the rear flank downdraft (RFD) of the SC. When the system reached GDA radar Doppler range, the radial velocity data were analyzed, directly over the area of the greatest damage. The goal was to show the most devastating bowing segments and the position of the mesovortex. At the end of the analysis we focused on the MCV pattern, showing its details on the SRV product.
The RIJ analysis was conducted in two variants. The first used vertical cuts VCUT (V) to visualize its vertical extent, the interaction with the SC circulation, and the estimation of maximum velocities in the core. The vertical cuts were made manually. In each case they ran along with the RIJ core towards the storm movement. The second variant is an analysis using the SRV (V) product from three different elevations. It was considered that this product would be preferable to CAPPI (V) at a given altitude, due to the lack of data interpolation; the product configuration was chosen to visualize the horizontal range of the RIJ. The analysis of horizontal characteristics of the RIJ using the SRV (V) product was carried out based on POZ radar. The 1.7-degree elevation was used when the storm system was far away from the radar. Then, as the storm approached the radar station and passed directly over it, data from the 3.6-degree elevation were analyzed. These elevations were selected to avoid ground clutter and to analyze the data from approximately constant altitude. A wind vector of 15 m/s parallel to the RIJ direction was added to the product configuration to better visualize the RIJ pattern.
5. General evolution of the convective system
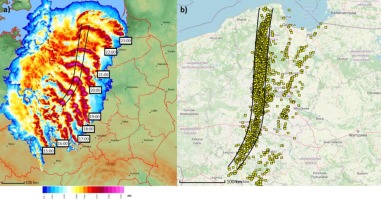
The whole derecho evolution process is shown in Figure 2 using the 1-h step composite maps. The main, wide path of damage was detected along the track of the SC (early stage) and MCV (later stage) (Fig. 2). In this chapter we have presented a brief chronological overview of this event.
Fig. 2.
CMAX composite map with 1-h steps (a) with marked SC and (later) MCV track; (b), severe wind gust reports with marked SC and (later) MCV track (source: eswd.eu).
The derecho day was stormy over Poland from early morning. The convection, which developed in Lower Silesia from morning until noon, generated a surface outflow boundary and influenced the evolution of local wind convergence. These dynamics, in turn, enabled the development of a much stronger afternoon convection (Wrona et al. 2022).
The development of storm cells in the Czech Republic and on the Czech-Polish border in the early afternoon can be considered as the beginning of the evolution of the convective system responsible for derecho development. In the environment of high CAPE values and strong wind shear, storms moving towards the NNE were characterized by high reflectivity through the entire vertical extent. The reflectivity demonstrated highly dynamic hydrometeor movement inside storm cells, due to the strong downdrafts and updrafts.
Storm cells intensified after entering Poland. On the composite maps of maximum reflectivity it was possible to observe their increasingly better organization and clustering, ahead of the dynamically waving atmospheric front (Wrona et al. 2022). After 16 UTC the formation of the mesoscale convective system (MCS) was complete.
At around 16:10 UTC the first radar signatures (distinctive, high reflectivity core) appeared, indicating the possible presence of an embedded SC, which played a key role in the evolution of the storm system to the derecho category. This SC is likely to have existed previously in the Czech Republic, but it was disorganized when crossing the Sudetes Mountain range (Taszarek et al. 2019). Then, in Lower Silesia, the strong updraft of this storm began to rotate again. At that time the first reports of damage caused by strong winds, which overlapped the SC route, began to appear. Large hail was also recorded in the area of Kalisz (Taszarek et al. 2019).
After 18:30 UTC on radar scans, the signature of the SC began to overtake the entire system, forming a more and more distinct bowing segment. At 19:10 UTC a well-formed bowing segment was present at the head of the system. Subsequently, the mesoscale convective system, initially formed from poorly organized storm cells (Fig. 3), took the form of a bow echo with the embedded SC (bow echo complex) (Moller et al. 1990; Klimowski et al. 2000, 2004).
Fig. 3.
Schematic representation of bow echo formation from poorly organized cells (Klimowski et al. 2004).
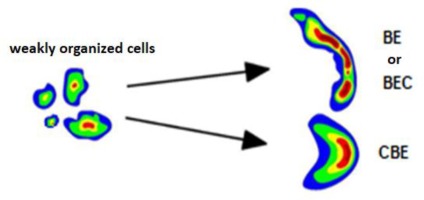
Between 20:00 and 21:00 UTC a bow echo with active mesovortex caused the greatest wind damage (Taszarek et al. 2019), passing over the area of Bory Tucholskie. In the radar images we can distinguish one vast bow-type segment at the leading edge of the storm.
Later, the bookend vortex signature is visible in the western part of the system on the scan from 21:30 UTC, indicating the occurrence of a mesovortex caused by the evolution of the mesocyclone. The MCS weakens after passing over the Baltic Sea, and the radar echo system indicates the formation of a mesoscale low, surrounded by precipitation areas. The radar analysis of the event ends when the storm leaves the classic scan area of the radar in Gdańsk.
6. Supercell and rear inflow jet interaction
The detailed analysis began when the mesocyclone was likely to redevelop within a previously existing cell in the Czech Republic. Additionally, in the southern part of the system, one more embedded structure with a rotating updraft, visible on PPI (V) scans of the POZ radar as the velocity couplet, has developed. However, it did not have a direct impact on the path of the greatest damage. The first symptoms of SC formation can be seen on radar scans from 16:10 UTC (not shown). However, the most visible signatures of a storm with rotating updraft begin to appear around 16:30 UTC (Fig. 4).
Fig. 4.
Products: (a) MAX (dBZ); (b) vertical cut VCUT (dBZ) through a SC; and (c) EHT (HeightMaxZ) – POZ radar from 16:30 UTC.

The vertical sections VCUT show (Fig. 4) a visible, bounded weak echo region (BWER) associated with a strong updraft lifting the hydrometeors to a significant height, which may be a mesocyclone precursor (Lemon, Doswell 1979). In turn, the EHT (HeightMaxZ) product, which in this case presents a reflectivity above 30 dBZ, which can be a precursor of the mesocyclone at 16:30 UTC, highlights the areas where the updraft keeps the hydrometeor particles high above the surface. It is clearly visible within the developing storm SC.
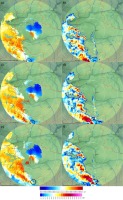
In subsequent observations the mesocyclone starts to be visible on the SRV (V) product of the POZ radar, where the velocity couplet signature appears, indicating the vortex area (Fig. 5). Unfortunately, due to high noise from WiFi transmitters and the high filtering threshold, there are gaps in radial data, especially in the period when the system was in the immediate vicinity of the radar. After 17:00 UTC the inflow notch, i.e. the area of reflectivity gap at the point of intense air inflow into the mesocyclone, is well outlined on the PPI (dBZ) product from the lowest elevation (not shown).
Fig. 5.
SRV (V) (left), PPI (dBZ) (right) scans from 1.7-degree elevation showing the location of the mesocyclone at: (a, b) 16:23 UTC; (c, d) 16:33 UTC; (e, f) 16:43 UTC – POZ radar.
At 17:13 the first scans clearly indicating the presence of RIJ were performed. They show the area of elevated radar-towards velocity on the VCUT made on the radial data along the direction of the system moving towards the POZ radar, at an altitude of about 4 km (Fig. 6). The velocity measured by the radar is in the range of 30 m/s. Still, due to the specificity of the Doppler measurement, when the axis of the air stream is not parallel to the signal beam, we get information only about the component to or from the radar. Therefore, we are unable to measure the real wind velocity at the RIJ core. The area of air inflow towards the storm is also well-distinguished and the Mid-Altitude Radial Convergence (MARC) signature appears (Fig. 6); (Rasmussen, Rutledge 1993; Moller 2001; Markowski 2002). The horizontal scans, starting from 17:33 UTC, show the RIJ as an area of increased radial velocity ~40-50 km wide with undefined length (Fig. 7).
Fig. 6.
Vertical section VCUT(V) from POZ radar presenting the evolution of RIJ at: (a)17:13 UTC; (b) 17:33 UTC; (c) 17:53 UTC with the corresponding 4 km CAPPI (V) scans with marked vertical section line (d, e, f).
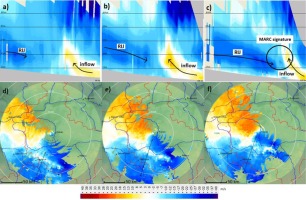
Fig. 7.
SRV (V), PPI (dBZ) products, POZ radar, 1.7-degree elevation from 17:33 (a, d) to 17:43 UTC (b, e) and 3.6-degree elevation at 17:53 UTC (c, f). RIJ direction and range are marked.
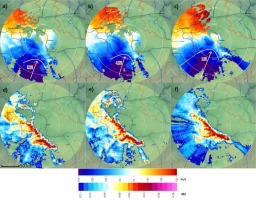
After 17:53 UTC the velocity in the RIJ stream starts to rise, while the altitude of the leading part of the jet core drops below 2 km, which indirectly indicates the intensification of the influence of the updrafts and downdrafts (Fig. 6). At the same time, the mesocyclone of the embedded SC continues to move NNW relative to the movement of the system, slowly approaching the area of the RIJ core, entering the area of the illustrated cross-sections. This is the first time the strong air current associated with the RFD of the storm SC becomes visible (Fig. 8).
Fig. 8.
Vertical section VCUT(V) from POZ radar showing further stages of RIJ evolution and a part of SC area at: (a) 18:13 UTC; (b) 18:33 UTC; (c) 18:53 UTC; with the corresponding 4 km CAPPI (V) scans with marked vertical section lines (d, e, f).
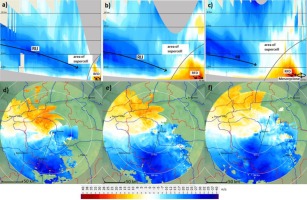
The signature of the mesocyclone along with the inflow area is also visible on the cuts. The RIJ stream continues to descend and the velocity in its core increases as well. The gust front associated with the rear downdraft of the SC becomes increasingly visible, as the winds within it lie in the direction parallel to the axis of the signal beam (Fig. 8).
The horizontal observations from 18:03 to 18:23 UTC reveal that the high-speed area increases to a width of about 70 km. The RIJ structure on the scan at 18:23 UTC is slightly disturbed because it is passing directly over the radar and a there is a strong directional wind shear with the altitude (Fig. 9).
Fig. 9.
SRV(V), PPI (dBZ) products, POZ radar, 3.6-degree elevation, at: 18:03 UTC (a, d), 18:13 UTC (b, e), 18:23 UTC (c, f). RIJ direction and range are marked.
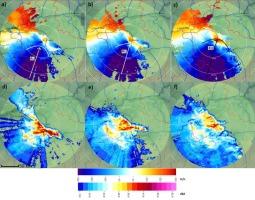
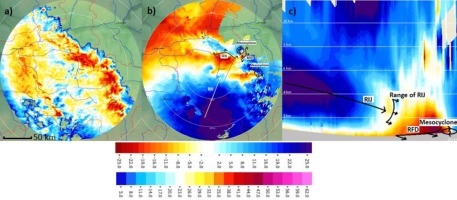
During the passage of the storm over the POZ radar, the signal was significantly muffled by the wet dome, which made it difficult to observe the signatures typical of the SC. As the phenomenon moved away from the radar, the reflectivity data decreased in quality due to the damping caused by precipitation. Therefore, the signatures at the forehead of the storm were not visible. Contrastingly, on the radial data, the SRV (V) product still showed a distinct vortex signature. Moreover, typical of SC forward flank downdraft (FFD) and rear flank downdraft (RFD) have emerged. Additionally, the range of the RIJ and the mesocyclone of the SC located in the northern part of the system are visible on the vertical section VCUT (V) (Fig. 10).
Fig. 10.
(a) PPI (dBZ); (b), SRV (V) scans from 1.7-degree elevation and vertical cut VCUT (V) from 18:53 UTC (c) – POZ radar.
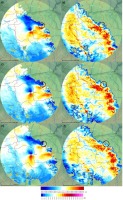
Over time, the RIJ and the RFD began to cover an increasing area; especially as the RFD began to encircle the mesocyclone more and more, which in turn continued to move along the forehead of the mesoscale system towards the NNW, constantly increasing its diameter (Fig. 11). The presence of the RIJ became increasingly apparent.
Fig. 11.
SRV (V) (left), PPI (dBZ) (right) scans from 1.7-degree elevation showing the location of the mesocyclone at: 18:43 UTC (a, b), 18:53 UTC (c, d), and 19:03 UTC (e, f) – POZ radar.
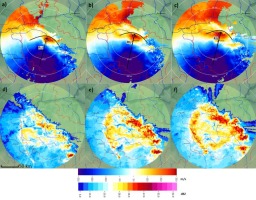
After 18:33 UTC the forehead of the RIJ begins to move away from the POZ radar, and its range becomes increasingly distinguishable. The wind speed in the RIJ core measured by the radar starts to rise. The core width is already more than 100 km, and further estimation of its spatial extent becomes impossible due to the specificity of Doppler measurements (Fig. 12).
Fig. 12.
SRV(V), PPI (dBZ) products, POZ radar, 3.6-degree elevation, at: 18:33 UTC (a, d), 18:43 UTC (b, e), and 18:53 UTC (c, f); RIJ direction and range are marked.
About 19:10 UTC, on the EHT (HeightMaxZ) product (Fig. 13), a split of the system was observed within the SC storm, probably forced by the influence of the mesocyclone. In turn, the RFD, surrounding the mesocyclone, divided the updraft area into two sectors, i.e. the northwestern one associated with the mesocyclone and the southeastern one not associated with its circulation. The whole process clearly shows the mesocyclone role in the long duration of the storm. Figure 14 clearly shows the gradual disorganization of the raised strong echo not related to the mesocyclone. In contrast, the echo in the area where the hydrometeors are held at high altitudes by the rotating updraft is still significant.
Fig. 13.
Products: (a, d, g) MAX (dBZ); (b, e, h) vertical section VCUT (dBZ) through a SC; and (c, f, i) EHT (HeightMaxZ) – POZ radar at 19:10 UTC (a, b, c), 19:30 UTC (d, e, f), 19:50 UTC (g, h, i).
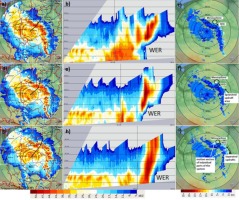
Fig. 14.
SRV(V), PPI (dBZ) products, POZ radar, at 19:13 UTC: (a, c) 3.6-degree elevation; (b, e) 0.5-degree elevation.
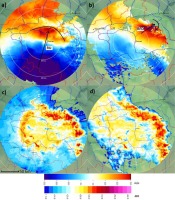
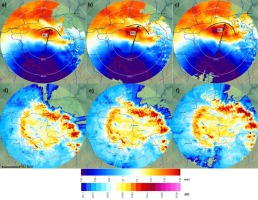
At approximately 19:13 UTC one can notice the aforementioned moment when the RIJ was catching up with the air stream associated with the RFD of the SC. Both air currents are visible while comparing data from two different radar elevations for the same observation (Fig. 14). A strong air current powered by the RFD of an embedded SC is visible on the 0.5-degree elevation data, showing the wind field distribution in the lowest measurable layers. At the same time the RIJ, which is located higher, is not visible at this altitude. It is clearly visible only on the 3.6-degree elevation data, where only a small section of the flow forced by RFD is seen. In the following observations the forehead of RIJ starts to accelerate together with an increase of wind velocity in its area. At the same time the signatures proving the presence of the mesocyclone are poorly visible in that elevation, which confirms its most significant impact in the lower atmospheric layers (Fig. 15).
Fig. 15.
SRV (V), PPI (dBZ) products, POZ radar, 3.6-degree elevation, at: 19:03 UTC (a, d), 19:13 UTC (b, e), 19:23 UTC (c, f); RIJ direction and range are marked.
After 19:13 UTC a crucial moment in the derecho evolution occurs. The RIJ continues to catch up with the area of heavy winds associated with the SC RFD. The vertical cross-section VCUT from 19:13 UTC also shows that the RIJ and RFD cores are separated, while on the cross-section from 19:23 UTC they already present a single compact stream that continues to descend (Fig. 16).
Fig. 16.
Vertical section VCUT(V) from POZ radar presenting interaction of RIJ with RFD SC at: 19:13 UTC (a), 19:23 UTC (b), and 19:33 UTC (c) with the corresponding 4 km CAPPI (V) scans with marked vertical section line (d, e, f).
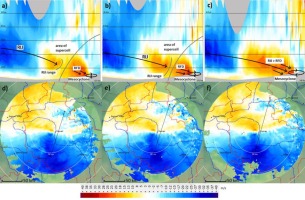
Based on radar data, the moments between 19:23 UTC and 19:43 UTC can be considered the beginning of the bow echo. We can classify it as BEC because the mesocyclone still existed. Later, due to the split of the SC, a new branch of the RIJ is formed. Its direction further deviates toward the northeast (Fig. 17). The downbursts associated with this RIJ may be responsible for some damage east of the main path of damage.
Fig. 17.
SRV (V), PPI (dBZ) products, POZ radar, 1.7-degree elevation, at: 19:33 UTC (a, d), 19:43 UTC (b, e), and 19:53 UTC (c, f). RIJ direction and range are marked.
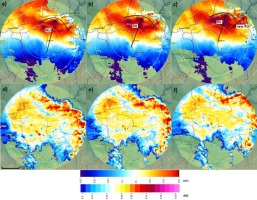
After 20:00 UTC the most significant wind damage occurred, the trail of which coincided with the path of the eastern flank of the SC (Taszarek et al. 2019). By analyzing the radar data, it can be concluded that the overlap of RFD and RIJ in the storm was the crucial factor in generating such strong winds, which reached the surface. (Taszarek et al. 2019). In turn, such a long trail of destruction was possible because of the constantly active, expanding mesocyclone, the local circulation of which ensured a good separation of updrafts and downdrafts, and thus, contributed to the long life of the storm.
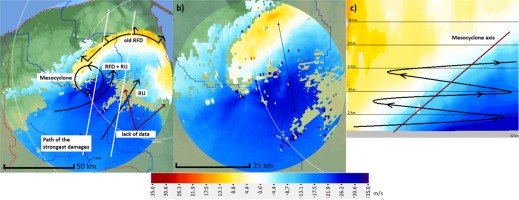
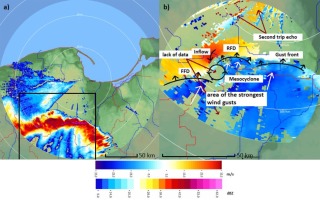
At 20:44 UTC, at the edge of the Doppler scan range, the data from the POZ radar were already strongly attenuated and distorted. Therefore, the mesocyclone analysis was continued using data from the GDA radar. Despite problems with the interpretation of data related to noise and the second trip echo phenomenon, the SRV (V) product clearly shows the effects of further transformation that the system underwent while moving between the Doppler range of the POZ and GDA radar. The RFD on the eastern flank of the mesocyclone overtook the FFD and became the main bow segment additionally powered by the descending RIJ. The mesocyclone distinctly increased its diameter, still moving along the forehead, to the west of the system axis (Fig. 18).
Fig. 18.
(a) PPI (dBZ); (b) SRV (V) products from 0.5-degree elevation at 20:44 UTC with the essential elements of the storm system indicated – GDA radar.
Unfortunately, due to the poor quality of data from the GDA radar between 20:00-21:00 UTC, the RIJ analysis was abandoned for that period. However, this is already the stage where the direction of the RIJ and of the near-surface flow associated with the weakening RFD of the pre-existing SC are diverging. Although the RIJ is relatively low, there is no longer such strong transfer of the RIJ momentum to the surface. This fact reveals why no such extensive wind damage has been recorded in the coastal area.
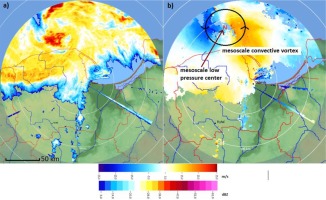
After 21:00 UTC the MCS takes the form of a compact bow echo with one large bowing segment associated with transformed RFD, along with the MCV signature formed at the mesocyclone site. Unfortunately the precise time of the MCV forming can’t be determined due to poor data quality just before 21:00 UTC. The vertical section VCUT clearly shows the MCV axis inclined from north to south and its eastern flank with high-velocity values at lower elevation, additionally powered by the RIJ (Fig. 19). The presence of the mesoscale low resulting from the evolution of the mesocyclone was distinctly visible in the SRV (V) scans after passing over the shore of the Baltic Sea. A cyclonic circulation of air masses developed around the mesocyclone low, which is confirmed by the twisting motion of hydrometeors (Fig. 20).
7. Conclusion
This paper presents a case study of a derecho based on radar observations. In particular, the origin of the phenomenon and the various stages of its development were determined, important components of the storm were identified, and their role in the formation of the damaging winds was shown.
The analysis shows formation of a bow echo complex (classified on the grounds of the inflicted damage as a derecho) (Taszarek et al. 2019; Wrona et al. 2022), which developed from unorganized storm cells. The decisive role in the system evolution was played by one of the storm SCs embedded into the system, the local circulation of which intensified the processes taking place therein.
The study has focused on the development and the evolution of the mesocyclone, RIJ activity, and their interaction. The main objective was to verify the hypothesis formulated by Taszarek et al. (2019) that the overlapping of wind vectors within the RFD SC and the RIJ vectors was responsible for such significant wind damage. Our analysis of radial wind observations confirms the presence of characteristic gust fronts associated with mesocyclone circulation and their interactions with RIJ.
Despite some data discontinuities, it was confirmed that the areas of the most significant damage coincide in time and space with radar observations showing the convergence of wind vectors related to RFD and RIJ. Later divergence of these wind directions explains why the storm did not cause so much damage in the northern part of Pomerania.
In conclusion, this study presents a detailed qualitative analysis of the elements of the storm system responsible for extreme anemological phenomena: the interaction between the RFD of the SC and the RIJ. More accurate quantitative analysis was hindered because of the system's distance from the radars during the key moments of its evolution and the difficulties in the data interpretation, including contamination by strong precipitation. Nevertheless, the key question was answered: what mechanisms acting within the convective system led to development of such strong winds and damages? In addition, this paper provides evidence that mesoscale convective systems, in which intense SCs are embedded, could be extremely dangerous. The knowledge obtained from this analysis may help in warning the population more effectively against similar phenomena in the future.

