1. Introduction
Climate change influences almost all components of the environment and human activity at the global scale. In particular, the hydrological cycle, agriculture, culture, human health and activity, and human-made infrastructure are sensitive to climate change, specifically to changes in the spatial and temporal distributions of temperature, total precipitation (rain and snow) and near-surface wind. Furthermore, contemporary climate change is characterized by the intensification of various extreme phenomena at the regional scale (Siegmund et al. 2019). Belarusian territory is highly impacted by ongoing and projected changes, and the collaboration of geoscientists from this part of Europe is required in order to mitigate climate change in a coherent manner.
Numerous recent climate studies have assessed possible future climate changes based on numerical simulations. The model results are typically presented as deviations of different variables from historical climate conditions within the target regions. This method takes into account the bias between climate simulations and data from meteorological stations. Climate models are corrected based on in situ observations. However, in order to understand the variability of the projected climatic characteristics, the current climate changes must be assessed.
The Belarusian hydro-meteorological service collects long-term time series of observed climatic characteristics, permitting estimations of ongoing changes in climate that can subsequently be employed to understand potential future climate change trends. Podgornaya et al. (2015) established fluctuations in annual temperature within 1900-2014 to vary close to the temperature climatological norm (1881-1990). Significant variations in the Belarusian temperature regime have been observed since 1989. In particular, the current warming is unprecedented in its duration, and the higher temperatures occurring during the past 30 years (1989-2018) have exceeded the average climatic norm (1961-1990) by 1.3°C. In addition, the three warmest years in Belarus (1989, 2008 and 2015) since 1880 occurred from 1989-2015 (Melnik et al. 2018).
No significant changes have been observed in the mean annual precipitation at the end of the 20th century in Belarus, while the increased irregularity of precipitation and rise in air temperature caused twice as many periods of drought as before (climate warming period of 1989-2018). Moreover, the wind speed in Belarus has declined since the 1970s (Loginov 2008). During this period (1989-2018), extreme weather phenomena were observed more frequently in Belarus, and the World Meteorological Organization warns that climate extremities will increase in the future (Siegmund et al. 2019).
Several studies have investigated future climate change in Belarus based on climate model outputs. Due to the small size, compact configuration and location between Europe and the Russian Federation, Belarus has often been part of climatic assessments in large multi-country projects such as CMIP3, CMIP5, PRUDENCE and ENSEMBLE (Frich et al. 2002; Metzger et al. 2005; van der Linden, Mitchell 2009; Taylor et al. 2011).
Current model data with high temporal and spatial resolution are represented by the consortium EUROCORDEX. Jacob et al. (2014) employed this data to conduct a detailed analysis of future climate changes revealing increases in air temperature of 2.0-4.2 and 4.1-6.2°C (depending on the scenario) by the end of the current century over the central European territory, including Belarus. More specifically, the rise in precipitation amount was determined as 7-18% and 19-32% under the RCP2.6 and RCP8.5 scenarios.
Research on climate change in Russia (Shkolnik et al. 2006; Govorkova et al. 2008; Meleshko et al. 2008; Mokhov, Eliseev 2012; Kokorev, Anisimov 2013) often include the territory of Belarus. The regional model outputs of the Institute of Physics of the Russian Academy of Sciences (Mokhov, Eliseev 2012) suggest that air temperature will rise in the European part of Russia and Belarussian territory and, depending on the scenario, may increase through the end of the 21st century from 3.0-3.5°C to 4.0-4.5°C under the RCP2.6 scenario and to 4.0-8.0°C under the RCP4.5 and RCP8.5 scenarios.
Analysis of climate projections based on the 31 CMIP5 climate models under the RCP4.5 scenario revealed a significant change in key climatic characteristics through the middle of the current century within the territory of Belarus (Pavlova 2013; Snezhko et al. 2017).
Loginov et al. (2000) investigated future climate changes specifically for the territory of Belarus in the early years of the 21st century. Results confirmed the probable rises in key meteorological parameters by the end of 2100. For example, the mean, maximum and minimum air temperatures are expected to increase by up to 3.0°C, 2.7-2.9°C, and 3.2-3.3°C, respectively, depending on the concentration of greenhouse gases and the presence of sulphate substances in the air. The rise in the amount of precipitation is calculated a 0.12-0.20 kgm-2•day-1 (10% every year), the increase in partial pressure of water vapour is given as 1.7-1.9 hPa, and the wind speed rise is 0.07-0.17 m•s-1. The greatest changes in the meteorological parameters coincide with a rise in greenhouse gas concentrations, while in the presence of sulphate substances, the variations are lower.
Further research on climate change in Belarus based on CMIP5 climate projections demonstrates an increase in the warm period duration (Tday ≥ 0°C) of up to 35 days from 2041-2060 and projects that the warm period will vary from 280 to 310 days. The agricultural zoning of the territory of Belarus was updated according to the projected temperature (Melnik et al. 2017).
A detailed assessment of future climatic changes in Belarus using model simulations by the EUROCORDEX (EUR-44) consortium reveals significant changes in air temperature and precipitation by the end of the current century. The mean air temperature and precipitation are expected to rise by up to 2.4-4.7°C and 15-30 kg•m-2 per year, respectively, through the end of the current century. The seasonal and annual values of temperature and precipitation vary depending on the chosen combination of global and regional models. The smallest changes were noted for the RCP2.6 scenario, while the most significant variations were observed for RCP8.5. The greatest changes within each scenario occurred during winter and spring (colder times of the year) (Partasenok et al. 2015; Danilovich, Geyer 2018).
Danilovich et al. (2020) analyzed the observed and projected climate changes in the Polesje region (southern area of Belarus), concluding that current climate change trends will be maintained in the near future. In particular, the air temperature will continue to rise and the variation in the minimal temperature will exceed that of the maximal and mean temperatures. A rise in precipitation events of moderate intensity will increase the precipitation amount, while the duration of the drought periods will enhanced in the summer.
In the present study, we aim to estimate the current and future changes (both the direction and value) in air temperature, precipitation (rain and snow), wind and their extremes over the territory of Belarus using information from meteorological stations and 92 regional climate model (RCM) simulations with the highest available horizontal resolution (EURO-CORDEX, 0.11°).
The rest of the manuscript is structured as follows. Section 2 provides a description of the data and methods employed for the analysis. Section 3 details the study area, while Section 4 presents the observational data. Section 5 describes the projections of air temperature, precipitation, snow and wind, including current climate changes in Belarus, the assessment of multimodel median climate change signals under different emission scenarios, and estimates of the projected extremes. The results are discussed in Section 6 and Section 7 concludes the study.
2. Data and methods
A set of 92 RCM simulations from the EURO-CORDEX initiative (Jacob et al. 2014; Kotlarski et al. 2014) are analyzed. A horizontal resolution of 0.11° (~12 km, EUR-11) is used and three representative concentration pathways (i.e., aerosol and greenhouse gas emissions) (Moss et al. 2010) scenarios, namely, RCP2.6 (10 simulations), RCP4.5 (43 simulations), and RCP8.5 (39 simulations), are considered. The dataset is derived from 5 RCMs and 7 CMIP5 general circulation models (GCMs) (Taylor et al. 2011) that provide boundary and initial conditions. Table 1 provides an overview of the models. We selected all models that were publicly available via the Earth System Grid Federation archive in January 2017 and provided at least one scenario, a historical simulation, and an evaluation simulation.
Table 1.
Dataset of the EURO-CORDEX climate models used in the study. GSM Model/Climate Variable
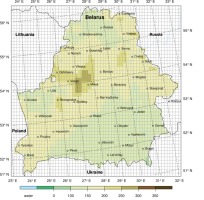
Figure 1 illustrates the model orography of Belarus for the 0.11°-resolution grid used for the simulations contributed by the CLM community (~12 km, EUR-11) as an example.
3. Meteorological variables
We employed the simulated daily mean datasets of temperature, total precipitation, snow and wind speed.
Temperature is evaluated using the following variables: the mean, maximal and minimal temperatures; the number of hot (daily maximum temperature >30°C), summer (daily maximum temperature of day >25°C), frost (daily minimum temperature <0°C) and ice (daily maximum temperature <0°C) days; the number of tropical nights (daily minimum temperature >20°C); and the frost and hot period lengths.
Precipitation and snow are described by the mean precipitation; the frequencies of precipitation days (daily precipitation amount >0.1 kg•m-2), wet days (daily precipitation amount >1.0 kg•m-2), intense precipitation days (daily precipitation amount >10 kg•m-2), and heavy precipitation days (daily precipitation amount >20 kg•m-2); maximum dry and hot period lengths; the highest precipitation amount in a 5-day precipitation period; and the 95th percentile of all of the precipitation days.
The wind speed characteristics are the mean and maximal wind speeds and the numbers of light-breeze days (daily averaged wind strength ≤2 m•s-1), strong-breeze days (daily averaged wind strength ≥11 m•s-1), and storm days (daily averaged wind strength ≥18 m•s-1).
4. Observational data and reference period
The station meteorological dataset is based on daily observations from a set of 42 stations covering the territory of Belarus. The dataset is stored at the State Climate Cadastre of the Republic of Belarus (Belhydromet 2019). Figure 1 presents the meteorological station locations.
In order to validate the simulations, seasonal and mean values of air temperature and precipitation are calculated for every station from the meteorological observation dataset during 1971-2000.
The spatial pattern of climate change over the study area is described by a gridded meteorological dataset. The meteorological network dataset is interpolated via the kriging method (Gaussian process regression) (Lysenko et al. 2019). The spatial distribution of the gridded dataset is 0.05° (5.5 km × 3.5 km).
We compute the statistics of the meteorological variables under the following periods: (1) 1971-2000, the historical period used in the EURO-CORDEX calculations (Jacob et al. 2014); (2) 1981-2010, the period suggested by the WMO Guidelines for the calculation of climate normals (WMO 2017); and (3) 1989-2018, the period of climate change in Belarus (Loginov 2008).
The differences in the means for the aforementioned periods are as follows: 0.9°C for the mean annual temperature; 0.7-1.0°C for the mean seasonal temperature (Fig. 2, Tab. 2); and 25 kg•m-2 or 4% for annual precipitation for 1971-2018 (Fig. 3) or 1-11 kg•m-2 for seasons with the largest differences in winter and spring and without significant changes in summer and autumn (Tab. 3). The standard deviations of monthly mean temperature has decreased in recent decades (Tab. 2), while the standard deviations of precipitation generally has increased (Tab. 3).
Table 2.
Air temperature climatological means (°C, numerator) and their standard deviations based on daily observations (°C, denominator) for Belarus.
| Period | Winter | Spring | Summer | Autumn | Year |
|---|---|---|---|---|---|
| 1971-2000 | –4.3 2.5 | 6.6 1.3 | 16.9 1.1 | 6.1 1.1 | 6.3 1.0 |
| 1981-2010 | –4.0 2.5 | 7.0 1.2 | 17.4 1.2 | 6.5 1.2 | 6.7 0.9 |
| 1989-2018 | –3.4 2.0 | 7.4 1.0 | 17.9 1.1 | 6.8 1.2 | 7.2 0.7 |
Table 3.
Precipitation climatological means (kg•m-2, numerator) and their standard deviations based on daily observations (kg•m-2, denominator) for Belarus.
| Period | Winter | Spring | Summer | Autumn | Year |
|---|---|---|---|---|---|
| 1971-2000 | 114 19.2 | 129 27.5 | 231 56.5 | 156 41.6 | 630 64.8 |
| 1981-2010 | 120 22.5 | 136 31.3 | 234 53.6 | 157 38.9 | 647 66.0 |
| 1989-2018 | 124 22.9 | 140 28.9 | 234 56.7 | 158 44.2 | 655 76.3 |
The analyses of the daily data are performed for the four meteorological seasons of winter (DJF: December-February), spring (March-May), summer (JJA: June-August), and autumn (September-November). Parts of this manuscript are divided by cold (November-March) and warm (April-October) periods.
The observational data are used to analyze the current climate change trends in Belarus. Future changes in air temperature, precipitation and wind are calculated as the difference between the modelled historical data and projected data. The bias introduced by the coarse resolution of the GCMs is corrected by the application of the RCMs. We apply the common assumption that systematic model errors are equal for historical and future conditions. Thus, by analyzing the differences, the systematic errors of the models are excluded from consideration.
Present-day and future conditions are defined as those during 1971-2000 and 2021-2099, respectively. The results are determined as seasonal, annual 20-year smoothed means for the air temperature, precipitation, wind and climatological indices during the periods 2021-2040, 2041-2060, 2061-2080, and 2081-2099.
5. Location and climatology of the study area
Belarus is located in Eastern Europe or in the southwest of the East European Plain. Poland borders Belarus to the west, with Lithuania to the northwest, Latvia to the north, Russia to the northeast and the east, and Ukraine to the south (Fig. 1). The national borders occur across flat terrain, as Belarus has no significant natural boundaries.
The general landscape of Belarus is a plain dotted with hills to the north and west (Fig. 1). Only one-fifth of the country exceeds an elevation of 200 m. Central Belarus, known as the Belarusian ridge, divides the Baltic Sea (47%) and Black Sea (53%) catchment areas. The highest point is the Dzerzhinskaya mountain, reaching an elevation of 345 m. The lowest point in the territory of Belarus is located in the valley of Neman, close to the Lithuanian border, with an elevation of approximately 80-85 m.
The climate of Belarus is influenced by its midlatitude location, flat relief and relative proximity to the Atlantic Ocean. It is classified as moderately continental according to Alisov’s classification system (Alisov 1936) and warm-summer humid continental climate (Dfb) according to the Köppen-Geiger classification (Beck 2018). The mean temperature (1971-2000/1989-2018) fluctuates from 5.3/6.4°C in the northeast to 6.7/7.7°C in the southwest; the mean January temperature varies from –7.1/–4°C in the northeast to –5.6/–3.6°C in the southwest, while the mean July temperature varies from 17.4/18.5°C in the northwest to 18.2/19.5°C in the southeast (Fig. 2). Table 2 reports the seasonal temperature means.
The mean annual precipitation ranges within 600-650 kg•m-2 in the lowland plains to 700-750 kg•m-2, and increases with elevations. Approximately 70% of the precipitation falls as rain during the warm part of the year. The mean precipitation (1971-2000/1989-2018) during the winter is recorded to be within 114/124 kg•m-2 per season, with the mean January precipitation varying from 38/45 kg•m-2 in the northeast to 35/37 kg•m-2 in the southwest, and that in July averaging 87/85 kg•m-2 per month in the northwest to 83/94 kg•m-2 per month in the southeast (Fig. 3). Table 3 presents the mean seasonal precipitation totals.
6. Evaluation of simulation data
The evaluation of the EURO-CORDEX RCM ensemble (Kotlarski et al. 2014) confirms the ability of the models to capture the basic features of the European climate, including their variability in space and time. Moreover, no negligible deficiencies are identified for the simulations in terms of selected metrics, regions, and seasons.
The ability of the EURO-CORDEX simulations to represent air temperature, precipitation and wind for the Belarus territory is investigated relative to the meteorological station observations. The evaluation strategy is based on the mean annual and seasonal values for each GCM-RCM simulation dataset and their medians compared against the mean annual and seasonal values of every meteorological station and their mean over the territory of Belarus. The evaluation is performed across the period of 1971-2000 for both the meteorological station dataset (i.e., observations) and simulations.
Figures 4 and 5 compare the observational records of the 1971-2000 changes in surface air temperature and precipitation to the simulated data from each EURO-CORDEX model and the respective multimodel median.
Fig. 4.
Evaluation of EURO-CORDEX regional climate model (RCM) simulations over Belarus for seasonal and yearly air temperatures. The analysis is conducted for 14 historical GCM-driven RCMs (colored lines), and their median (dark blue line) and mean seasonal and yearly air temperatures aggregated across 42 stations (red line). <Page>
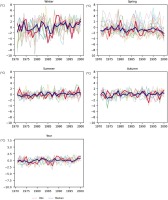
Fig. 5.
Evaluation of EURO-CORDEX regional climate model (RCM) simulations over Belarus for seasonal and annual precipitation. The analysis is conducted for 14 historical GCM-driven RCMs (colored lines), and their median (dark blue line) and mean seasonal and annual precipitation aggregated across 42 stations (green line).
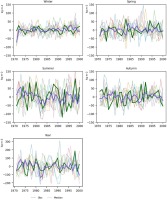
The interannual variability in the majority of the EURO-CORDEX simulations is qualitatively similar to that of the observed data, although there are several exceptions. For example, the magnitude of interannual variations in the observations is larger than the multimodel median. This is because the averaging of the multiple model results acts as a filter to the simulated variability (Flato 2013).
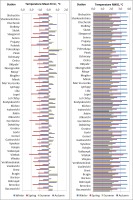
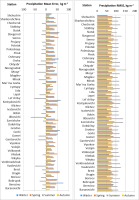
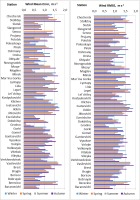
The quantitative performance of the models is evaluated by examining the mean error (ME), relative error (RE) and root mean square error (RMSE). Figures in Appendix A present the EURO-CORDEX model mean seasonal ME and RMSE of the surface air temperature, precipitation and wind (determined via the difference between the individual model simulations and observed station data).
According to Kotlarski et al. (2014) the EURO-CORDEX ensemble seasonally and regionally averaged temperature biases (the difference model-reference of spatially averaged climatological means) for the European domain generally do not exceed 1.5°C. The temperature bias spread across different configurations of an individual model can be of a similar magnitude as the spread across different models, demonstrating the strong influence of the specific choices in physical parameterizations and the experimental setup on the model performance.
The mean ME of all air temperature simulations is negative in winter and spring, and positive in summer and autumn. The largest MEs are obtained for spring (–1.5°C) and winter (−0.8°C). This may be associated with the model underestimations; the smallest errors were detected in summer and autumn with 0.4-0.5°C. The yearly ME does not exceed 0.4°C and the relative error of air temperature is approximately 24% in spring and 2% in summer.
The RMSE is largest in winter, reaching 3.7°C, and gradually decreases by season to 2°C in autumn. This is explained by the higher variability in air temperature in winter due to frequent changes in atmospheric circulation and flowing air masses from the Atlantic Ocean, Siberia and Arctic.
The precipitation ME is largest in winter and spring and equals approximately 40 kg•m-2 per season; however, the relative error is approximately 20% for winter and 30% for spring. The summer-autumn mean errors in precipitation are approximately 13-14 kg•m-2 and do not exceed 5-10%, while precipitation biases for the entire European domain are typically in the ±40% range (Kotlarski et al. 2014). However, the RMSE indicates the largest values of more than 100 kg•m-2 to occur in summer due to the high variability of precipitation and the complicated regime of frontal and convective precipitation during this season, which is difficult to parameterize. The smallest RMSE of 60 kg•m-2 is obtained in winter.
The simulated seasonal and yearly wind means are in modest agreement with the observations. The wind MEs are stable within seasons and vary from 1.0 to 1.2 m•s-1, with the largest values in autumn. However, at the relative scale, the MEs are quite large and reach 30% and 50% in winter and summer, respectively. The wind RMSE is largest in winter and autumn and corresponds to the wind speed seasonal increase.
The EURO-CORDEX simulations generally perform well in the qualitative (i.e., seasonal and geographical variations) and quantitative (i.e., errors) characterizations of the climate in Belarus. This demonstrates the ability of the EURO-CORDEX models to reproduce the general features of the annual and seasonal mean surface temperature, precipitation and wind, although the agreement between simulations and observations is limited in certain seasons.
7. Results
This section is structured into four subsections according to air temperature, precipitation, snow and wind. Each subsection consists of (a) the peculiarities of current climate changes in Belarus; (b) an assessment of multimodel median climate change signals for different emission scenarios; and (c) estimates of the projected extremes.
The spatial patterns associated with multimodel median projected climate changes across the territory of Belarus are not presented here due to the lack of clear spatial patterns of the meteorological characteristics per season.
7.1. Temperature
PECULIARITIES OF CURRENT CLIMATE CHANGES. The annual mean temperature in Belarus has exceeded the climatological norm (1961-1990) by 0.1-2.1°C almost every year since 1989. The linear trend of annual temperature for the post-WWII period varies from 0.25°C per decade in the north to 0.35°C in the south. The largest degree of warming occurs during the cold season. The trend of winter temperature change varies from 0.35°C per decade in the west and some southern regions to 0.45°C in the north and east. The trend in summer temperature changes is approximately 0.1°C per decade in the west and 0.25°C in the southern and central regions. The mean maximum temperature for the cold period has increased by 1.5-1.7°C, while that for the warm period has increased by 0.7-0.8°C. Moreover, the mean minimum temperature has increased by 1.8-2.0°C for the cold period and by 0.6-0.7°C for the warm period.
ASSESSMENT OF MULTIMODEL MEDIAN CLIMATE CHANGE. Figure 6 presents the air temperature ensemble projections as 20-year moving averages for the 2021-2099 period with respect to present conditions (1971-2000) for Belarus. The individual models project a general increase in air temperature from 1 to 7°C. Under the RCP2.6 scenario, the projected ensemble median exhibits an increase in the annual mean air temperature of up to 1.5°C by the middle of the century, followed by a subsequent decrease of 0.5°C by the end of the century.
Fig. 6.
Projected changes in air temperature in Belarus for the 2021-2099 period with respect to 1971-2000 as the 20-year running means.
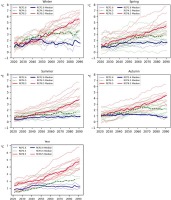
The largest growth under RCP2.6 is detected in the winter and spring (from 0.5 to 2.0°C) in different decades of the current century, while the smallest growth is observed in the summer. For winter, spring, and autumn, the temperature is expected to rise until the middle of the century, followed by a projected decrease until the end of the century. A gradual increase in air temperature of up to 1.0°C is projected for the summer.
The RCP4.5 ensemble scenario estimates an increase in the annual mean temperature ranging from 1.0°C to 2.8°C (from the beginning to the end of the century). The RCP8.5 scenario projections show an increase in the annual mean temperature ranging from 1.2°C at the beginning of the study period to 5.2°C at the end of the century. A gradual increase in winter and spring temperatures is expected to equal 4.5-5.5°C, and that of the summer-autumn period equal to 3.5-4.2°C.
ESTIMATES OF THE PROJECTED EXTREMES. Significant changes in winter extremes were detected for frost and ice days and the maximal frost period length, and in summer extremes for hot and summer days and for tropical nights.
The number of frost days is expected to decrease from 3-9 days during the current century under the RCP2.6 scenario to 4-33 days under the RCP4.5 and RCP8.5 scenarios. The number of ice days is also projected to decrease by 3-16 days under the RCP2.6 scenario, 4-18 days under the RCP4.5 scenario and 7-31 days under the RCP8.5 scenario. The maximum frost period length decreases from 7-17 days under the RCP2.6 scenario to 9-30 days under the RCP8.5 scenario. The winter indices generally exhibit maximal values for the 2041-2050 period under the RCP2.6 scenario and at the end of the century under the RCP4.5 and RCP8.5 scenarios.
During the summer, the number of hot days is expected to rise by a range from 1 day per season during the current century under the RCP2.6 scenario to up to 12 days under the RCP8.5 scenario. The number of summer days will increase by 3-21 days according to the RCP4.5 and RCP8.5 scenarios, while the number of tropical nights may rise by 2-8 days per season (more than twice the number under current conditions) after 2051-2060 under the RCP8.5 scenario.
The ice and frost days are projected to decrease during autumn and spring for every RCP scenario. Moreover, in autumn, an increase in summer days of up to 5 days per season is observed in the second half of the century under the RCP8.5 scenario.
7.2. Total precipitation
PECULIARITIES OF CURRENT CLIMATE CHANGES. The moisture regime in Belarus has changed in the recent decades. The mean precipitation exhibits a nonsignificant increase in the north (up to 5%) and southeast (up to 7%), while no changes are observed in the other regions of Belarus. The largest changes in precipitation are detected in the winter and may be explained by the atmospheric circulation peculiarities in the Atlantic-European sector (Partasenok et al. 2014). In the summer, an increase in precipitation occurred in July. Additionally, enhanced precipitation extremes are marked: the rainfall duration decreased while the absolute maximum precipitation amounts increased, particularly in the southern and central regions of the country. Despite the rise in precipitation, dry conditions are currently intensifying in Belarus, particularly during the growing season (Danilovich 2021).
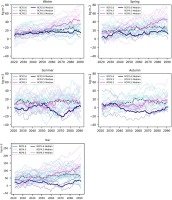
ASSESSMENT OF MULTIMODEL MEDIAN CLIMATE CHANGE. The different ensemble scenarios project an increase in precipitation across Belarus in all seasons. As shown in Figure 7, individual models projected increases in the winter and spring of the 2021-2099 period with respect to present conditions (1971-2000) for Belarus. The estimated growth of the multimodel median precipitation in the winter and spring exceeds 10 kg•m-2 (8%) under the RCP2.6 scenario, and reaches 20 kg•m-2 (15%) and 40 kg•m-2 (30%) under the RCP4.5 and RCP8.5 scenarios, respectively. In summer and autumn, changes in precipitation are more complex: the majority of simulations exhibit an increase in the seasonal precipitation totals of up to 10 kg•m-2 (4-6%); and mid-century decreases are projected under the RCP2.6 scenario. The higher-resolution EUR-11 projections tend to estimate stronger increases in mean annual precipitation compared to the coarser EUR-44 counterparts in previous studies (Partasenok et al. 2015; Danilovich, Geyer 2018).
Fig. 7.
Projected changes in precipitation for Belarus during the 2021-2099 period with respect to 1971-2000 as 20-year running means.
ESTIMATES OF THE PROJECTED EXTREMES. The number of precipitation days is projected to increase in the winter and spring by 1-3 days. In the summer and autumn, the deviations in the precipitation days are larger (up to 4 days) than in the cold season but have no clear increasing or decreasing trends during the current century. The largest deviations in the precipitation days during the century are projected under the RCP2.6 scenario.
An increase of 1-2 wet days is expected in the winter and spring under the RCP2.6 scenario and 2-4 days under the RCP4.5 and RCP8.5 scenarios. Negative deviations of up to 1-3 wet days are projected during summer and autumn.
A substantial increase is particularly apparent for the intense precipitation days, particularly in cold seasons. Signal strengths depend on the forcing and are most distinct for RCP8.5-driven ensemble scenarios.
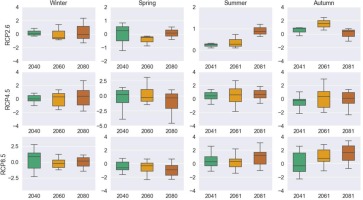
A projected intensification of extreme precipitation is expected over Belarus. For example, the 95th percentile of precipitation increases in all seasons but is stronger in spring; with a rise of 3-6 kg•m-2 under the RCP4.5 scenario and 3-8 kg•m-2 under the RCP8.5 scenario (Fig. 8).
Fig. 8.
The ensemble changes in the 95th percentile of precipitation for 2041-2099 with respect to present conditions (1971-2000) for Belarus. The year on the x-axis represents the start of each 20-year subperiod.
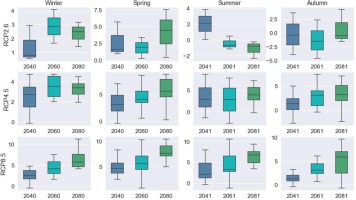
Figure 9 reveals the maximal dry period length changes to be the most complex. No significant trends are observed for the winter season, while the spring exhibits substantial decreases. The largest increase in the maximal dry period length is expected in the summer and autumn (with the exception of several decades) under the RCP2.6 scenario. The largest increase and decrease are projected under the RCP2.6 scenario.
Fig. 9.
Ensemble changes in the maximal dry period length for 2041-2099 with respect to present conditions (1971-2000) for Belarus. The year on the x-axis represents the start of each 20-year subperiod.
The models project stronger relative increases in single-day rainfall events compared to multiday precipitation spells.
7.3. Snow
PECULIARITIES OF CURRENT CLIMATE CHANGES. The changes in the snow regime strongly depend on cold-period temperature fluctuations. Following the positive tendency of air temperature in Belarus in recent decades, particularly in winter, the duration of solid precipitation has declined in recent decades by 11-26 hours per month or up to 5 days per cold season in the north and by 11-47 hours or up to 3-24 days in central and southern Belarus (Melnik 2019). The largest negative trend in falling snow duration occurs in January, at 20 hours per decade. In contrast, the liquid precipitation duration has increased for the entire country. The snow water equivalent (SWE) tends to decrease by more than 20 mm (25%) per cold season in the north and center, with slight changes in southern Belarus.
ASSESSMENT OF MULTIMODEL MEDIAN CLIMATE CHANGE. The general decrease is distinct for all models and scenarios in Belarus. However, several decades in the second half of the century exhibit increases under the RCP2.6 scenario. In the near-term period (2031-2050), the snow precipitation means is reduced by approximately 20 kg•m-2 per season. However, later snowfall is expected to decrease by up to 7-10 kg•m-2 per season. A significant reduction of 11-27 kg•m-2 per season is detected under the RCP4.5 scenario, and 9-47 kg•m-2 per season under the RCP8.5 scenario.
ESTIMATES OF THE PROJECTED EXTREMES. Among the snow precipitation climate indices, significant changes were detected for the numbers of precipitation days and wet days.
The snow precipitation days are expected to change by 1-10 days under the RCP2.6 scenario, with the largest negative deviation in the near-term period of 2031-2050 and at the end of the century, from 2091-2099. The decrease in snow precipitation days is projected to be 8-18 days under the RCP4.5 scenario and 4-32 days under the RCP8.5 scenario.
The number of snow wet days is projected to decrease by 2-5, 4-8 and 3-14 days under the RCP2.6, RCP4.5 and RCP8.5 scenarios, respectively.
7.4. Wind
PECULIARITIES OF CURRENT CLIMATE CHANGES. The wind regime in Belarus, which is influenced by atmospheric circulation over Europe and the Atlantic Ocean, is determined by baric center activity. During the cold season, winds from the west and southwest prevail (repeatability 45-50%), whereas those from the east (15%), northwest (9-12%), and north (5-8%) are less dominant. In the summer, west-erly (NW+W+SW) winds prevail (50%), with wind repeatability from the east up to 30% and from the south at 12%.
The wind strength has decreased by 0.9-1.0 m•s-1 since the 1970s over the territory of Belarus, and the mean annual wind speed varies from 2.5 to 2.8 m•s-1. The absolute maximum wind gust has also declined by 1.2 m•s-1 in the central and southern regions of the country, while no changes are observed in northern Belarus. The negative trend of the maximum wind gust is approximately equal to 0.1-0.2 m•s-1 per decade since the 1970s.
ASSESSMENT OF MULTIMODEL MEDIAN CLIMATE CHANGE. The ensemble reveals slight nonsignificant changes in seasonal and annual wind speeds. The overall change in wind speed varies from 0.2 to −0.4 m•s-1 in all seasons (Fig. 10).
Fig. 10.
Projected changes in wind over Belarus for the 2021-2099 period with respect to 1971-2000 as 20-year running means.
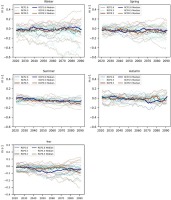
The ensemble median is reduced by 0.05 m•s-1 in the winter during the current century, with a more marked decrease of up to 0.1 m•s-1 projected up until the end of the century in spring and summer. The wind speed change in autumn is expected to stay close to the norm (1971-2000) under the RCP4.5 and RCP8.5 scenarios and deviate under the RCP2.6 scenario, growing by 0.05 m•s-1 in the recent decades to 0.15 m•s-1 in the middle of the century. The maximal wind speed is expected to increase in the second half of the century by 0.1-0.2 m•s-1 and decrease in summer by 0.1-0.25 m•s-1. In autumn, the maximal wind speed will vary strongly under RCP2.6, with an increase of 0.25 m•s-1 in the first half of the current century and subsequent reduction of 0.15-0.5 m•s-1. RCP4.5 and RCP8.5 exhibited nonsignificant variations in the maximal wind speed in autumn.
ESTIMATES OF THE PROJECTED EXTREMES. A significant climate change signal is detected for strong-breeze days and storm days.
Under the RCP2.6 scenario, the number of strong breeze days increases by 2 days in winter and autumn, and decreases by 1-3 days in spring and summer. Mid-century strong breeze days are expected to increase in the winter for a short period under the RCP4.5 scenario. Other seasons are projected to experience changes ranging between 1.0 and 1.5 days, with the largest negative values in the summer. The RCP8.5 scenario predicts a gradual increase of up to 2 strong-breeze days in winter and spring, while in the summer, a decrease of 3 days is detected in the second half of the current century.
The climate change signal is stronger for storm days during the current century (2021-2099) under the RCP2.6 scenario. A general decrease in the number of storm days of 0.5-1 days is observed in the winter, spring and autumn, with the largest magnitude in the winter. In autumn, an increase in the number of storm days of 0.5-1 days is expected in the first half of the century. The changes in storm days are nonsignificant under the other scenarios.
8. Discussion
This study estimates the current and future changes in mean and extreme values of air temperature, liquid and solid precipitation, and wind over the territory of Belarus. Table 4 summarizes the study results for the territory of Belarus and the comparative climate characteristics for neighboring countries.
Table 4.
Assessments of current and projected climate changes in neighboring countries of Belarus
Regional climate assessments typically consider the macro-region in order to comprehensively demonstrate the climate change trends in the study domain. However, this may result in the loss of some climate change features in smaller regions (countries).
The air temperature estimates in Europe are robust in their conclusions and indicate a gradual increase over the region. The mean annual air temperature in Europe was observed to rise by 1.3°C in 2002-2011 and 1.6°C in 2009-2019 (C3S 2020). The air temperature increased by 1.3°C during 1989-2018 in Belarus, slightly differing from that in neighboring countries. Similar increasing trends in air temperature are detected (from 1.2 to 1.5°C) in the European part of Russia (Kryshnakova 2008; Roshydromet 2008), Ukraine (Shevchenko 2019) and Poland in spring (Czernecki 2017); while in Latvia (Klavins 2002; Summary Report 2017), Lithuania (Lithuania's 5th National Communication 2010) and Poland (Fortuniak et al. 2001; Kożuchowski, Żmudzka 2001), lower mean yearly air temperature changes of 0.7-0.9°C are observed, yet they were analyzed for a longer period (1961-2010).
The mean annual precipitation changes exhibited nonsignificant and generally positive deviations within 5-10% from climatological norms in all neighboring countries (Latvia`s 4th National Communication 2006; Roshydromet 2008; Summary Report 2017; Tripolskaja 2013; Jaagus 2018; Shevchenko 2019; Szwed 2019) and Belarus, while positive changes in intense precipitation were more marked (Roshydromet 2008; Reckermann 2011; Summary Report 2017; Balabukh 2018a; Pińskwar et al. 2018a).
With regards to precipitation, the territory of Belarus is located in the neutral zone between northern Europe (with a general increase in mean annual precipitation) and southern Europe (where drying conditions have increased since the second part of the 20th century). Despite the nonsignificant changes in the mean annual precipitation across recent decades over Belarus, the maximal precipitation totals have increased significantly in the summer by 15-25%. Moreover, drought frequency has also increased by up to 3-19% across the country (Danilovich 2021). Analysis of drying conditions over Eastern Europe based on the SPI (standardized precipitation index) and SPEI (standardized precipitation evapotranspiration index) revealed nonsignificant changes for the territory of Belarus (Jaagus et al. 2018), while SPI repeatability demonstrated a significant increase in drying conditions on the majority of Belarussian meteorological stations.
Snow precipitation and snow cover have declined in neighboring countries in recent decades due to temperature increases (Latvia`s 4th National Communication 2006; Roshydromet 2008; Rimkus 2014; Szwed 2017; Balabukh 2018).
In terms of wind regime, the mean and maximal speeds decreased in neighboring countries (Roshydromet 2014; Summary Report 2017; Balabukh 2018b), while whirlwinds and tornados in Poland (Project Klimada, Kożuchowski 2011) and extreme squalls in Ukraine (Balabukh 2018b) have become more frequent.
The regional assessments of climate projections for Poland, Lithuania, Latvia, Ukraine, the European part of Russia and Belarus generally confirm that future climate changes will follow current climate changes, which have been recorded since the second part of the previous century (e.g., increases in air temperature by 1 to 6°C over neighboring territories). The projected increase in Belarus territory is expected to be similar to that in Latvia (Summary Report 2017), Lithuania (Kriaučiūniene 2008, 2018) and Ukraine (Christensen 2007; Met Office 2010; Balabukh 2018b), with variations from 2.5 to 5.5°C by the end of the current century. The expected air temperature increases in Poland (Mezghani et al. 2016a) and the European part of Russia (Shkolnik et al. 2006; Kokorev 2013) are smaller than those in other countries by 1.0-3.8°C, with a projected total of 1-4°C.
The mean annual precipitation is projected to exhibit a nonsignificant growth in Lithuania (Kriaučiūniene 2008), while significant increases are expected of up to 10-15% in Poland, Latvia, Ukraine and Belarus, (Christensen 2007; Met Office 2010; Mezghani et al. 2016; Boychenko 2017; Summary Report 2017), and up to 20% in the European part of Russia (Shkolnik et al. 2006). A noticeable increase in intense precipitation is expected for all neighboring countries (Bukantis 2010; Kattsov 2017; Summary Report 2017; Pińskwar, Dobler 2018).
Snow projections demonstrated a substantial reduction in snow cover over the European part of Russia (Mokhov 2008) and in Belarus. Moreover, a complete lack of snow cover is expected in the western and southern neighbors of Belarus (Helcome 2006).
Wind speed projections are diverse among countries, with increases of 5-10% in the Baltic Sea basin (Nikulin 2011), while a rise of 4-13% and 0-6% is estimated in Latvia under the RCP4.5 and RCP8.5 scenarios (Summary Report 2017). At the same time, wind speed will continue to decrease in the future over Belarus and the European part of Russia (Kattsov 2017). This may be explained by northerly cyclone track shifts (Partasenok et al. 2014) and their continuation in the future.
9. Summary
This study presents the results of current and future climate changes over the territory of Belarus. We attempted to connect the regional peculiarities of ongoing climate changes and projected means of air temperature, precipitation and wind. While Belarus is an agrarian country, adaptation to climate change is part of the country’s sustainable development strategy. The climate information based on in situ data and numerical modelling in the present study is in high demand. The main tendencies of current and projected climate changes are summarized below.
TEMPERATURE: In recent decades, a temperature increase of 1.3°C has occurred over the territory of Bela-rus. The largest increase in air temperature (2.1-2.4°C) is detected in the cold season. Increases in minimum temperatures exceed those of maximum temperatures in the winter, while no equivalent difference is observed for summer.
The different ensemble scenarios project an increase of 1-5°C in the mean annual air temperature until the end of the current century. The largest growth (1-6°C) is projected in the cold season, while the growth in the warm season is projected to be 1-4°C. The RCP8.5 scenario demonstrates the largest changes. For winter, spring, and autumn, the temperature is expected to rise until the middle of the century, followed by a subsequent decrease.
TOTAL PRECIPITATION: Mean annual totals were observed to increase by up to 57%, with summer extremes in precipitation of up to 20-25%. However, drying conditions also intensified in Belarus, particularly during the growing season.
An increase in precipitation across Belarus was projected in all seasons. The mean annual precipitation is expected to rise by 30-120 kg•m-2 or by 5-15% at the end of the century. Models simulate increases in single rainfall events compared to multiday precipitation events. The 95th percentile of precipitation is observed to rise in all seasons by 4-7 kg•m-2. In summer and autumn, the largest increase in maximal dry period length is estimated as 0.5-1.5 days, with the exception of some decades under the RCP2.6 scenario.
The largest deviations in the precipitation days and dry periods during the century are projected for the RCP2.6 scenario.
SNOW: In recent decades, the winter precipitation amount increased in northern Belarus, while no significant changes were observed in the center and south of the country. The duration of solid precipitation decreased by 5-23 days, particularly in the south, and the duration of liquid precipitation in winter increased over the entire territory of Belarus.
The models projected a general decrease in snowfall of 10-45 kg•m-2 in Belarus for the current century. However, increases were detected during the second half of the century under the RCP2.6 scenario.
Among the climate indices used for snow precipitation, the most significant negative deviations (by 10-35 days) were detected for the numbers of precipitation days and wet days.
WIND: The wind strength has declined by 0.9-1.0 m•s-1 since the 1970s over the territory of Belarus.
The ensemble models reveal slight nonsignificant changes from 0.2 to −0.4 m•s-1 in seasonal and annual wind strength. In addition, a significant climate change signal in the wind regime is detected for strong-breeze days and storm days. In general, all models determined the number of strong-breeze days to increase in winter and summer by 2-2.5 and 3 days, respectively. Furthermore a 1 day decrease in the number storm days was observed in the winter, and a 1 day increase for autumn.

