1. Introduction
Lebanon has a Mediterranean climate and is vulnerable to hydrologic and rainfall droughts in most of its basins. Hydrologic and rainfall droughts will be some of the biggest natural disasters that future generations will face because average rainfall in Lebanon has declined from 740 mm (1901-1930) to 638 mm (1991-2020). This reduction caused a significant decrease in runoff; the annual flow in Lebanon (total streamflow) was 4,300 Mm3/year in 1970, dropping to 3,171 Mm3/year in 2009, accompanied by depletion of groundwater levels and declines in many wells and springs1.
The purpose of the present study is not to show the onset of drought in the Lebanese basins. As Tannehill (1947) wrote more than seventy years ago: “Drought has no beginning of it to have an end.” Rather, the purpose is to examine the drought characteristics in Lebanon through SDI and SPI indices and to test the significance of the correlations between them, over seven selected basins that represent the different climatic zones. The adoption of data in certain basins of Lebanon does not imply that the drought began on any specific date. However, relying on secular data can enable projections for the future by using arithmetic methods and models.
Hydrological drought2 is the decrease of water in all elements of the hydrological cycle. It means less water flowing through rivers and stored in lakes, but also lower levels of groundwater flow. Hydrological droughts are complex, recurring hazards that can cause water shortages in streams or storage entities such as reservoirs, lakes, and groundwater. Hydrological drought occurs when low water supply becomes evident, especially in streams and groundwater, usually after many months of meteorological drought. Meteorological drought3 is defined as a shortfall of precipitation over some period of time. It is measured by comparing the amount of precipitation, e.g., for a season or a year, to an average over a longer time series (e.g., many seasons or years).
Hydrological drought is based on the impact of rainfall deficits (including snowfall) in a specific area (as a basin) and time (as month, season, and year) on the water supply, such as streamflow, reservoir and lake levels, and groundwater table (Wilhite, Glantz 1985). The climatic zone must be considered because rainfall varies widely from one climatic zone to another (The National Weather Service).
The question is, to what extent has hydrological drought affected the basins of Lebanon over the years? To answer this question, this research entails discussing and analyzing hydrologic pluvial droughts in some Lebanese basins and climatic zones during periods when data are available. The droughts are characterized by calculating the correlation between hydrologic pluvial droughts and their spatiotemporal variability based on basin characteristics.
An extensive rainfall dataset for five climate zones (1901 to 2020) was available. Water measurements are not available over such long periods; some of these measurements began in 1939, and others more recently. The overall range of drainage measurement in the selected basins is from 1939 to 2020, beginning in 1939 (El Litany), 1949 (El Awali western drainage), 1966 (El Bared), 1991 (El Assi), 1994 (Ed Damour), 1995 (Abu Ali), and 2002 (El Hassbani). All are based on thematic information for each basin, e.g., topography, mean flow, and precipitation.
2. Study area
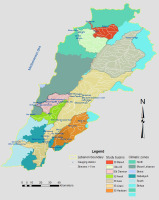
The basins were selected based on their different flow directions (north, south, and east) and their representation of different climatic zones (Fig. 1)4. The flow direction of El Bared, Abou Ali (located in the northern climatic zone), El Awali, and Ed Damour (located in the Mount Lebanon climatic zone) is westward, and that of El Assi (located in the Beqaa climatic zone) is northward. The El Hassbani and El Litani (located in the Beqaa, Nabatieh climatic zones, and South climatic zone for El Litani only), flow southward, and then the Litani turns westward. The river basins selected all have permanent flows (Table 1).
Table 1.
Some characteristics of the 7 selected basins in Lebanon.
1 – Jezzin; 2 – El-Barouk; 3 – Ain Ez-Zarqa; 4 – Labouh; 5 – Anjar; 6 – Ez-Zarqa, 7 – Hasbani; 8 – Wazzani.
NB: “Flows are never natural due to human interventions and manipulations: pumping, influence of dams, over- or underestimated, or calculated, interpolated flows”. (FAO 1974).
2.1. Physical characteristics of the selected basins
The topography of the major river basins is described by the Digital Elevation Model (DEM), which was obtained from “ASTER GDEM is a product of METI and NASA” with a spatial resolution of 30 m × 30 m. The river network and basin boundary are automatically extracted from the DEM itself with ArcGIS software. Accordingly, the maximum altitude of the basins is from 3,093 m at Abu Ali to 1,863 m at Ed Damour. Slight slopes are 35.1% and 33.7% at El Litani and El Assi, respectively. El Bared, Abu Ali, El Damour, El Awali, and El Hasbani have strong slopes, ranging from 32.6 to 41.8%.
A brief description of the characteristics of rivers of the selected basins follows. El Bared originates from Jurd al-Danniyeh. The three main springs are the Sukkar (1.15 m3/s), Sanubar, and Brisa. The river has a confluence with the Mussa River. Abu Ali originates from the Qadisha (0.72 m3/s) and Thahre El Qadib in Jabal El Makmel.
Ed Damour descends from the springs of El Safa (1.42 m3/s) and those of Jabal El-Barouk and is characterized by permanent flow and many valleys. El Awali arises mainly from El Barouk Spring (1.58 m3/s) in Jebal El Barouk-Niha. It also receives water from the artificial Lake Qanan.
El Litani is the longest Lebanese river (174 km, entirely inside Lebanon), extending over the Beqaa Plain and to the south, then heading westward to the sea. The principal springs of El Litani are Ez Zarka (38.5 m3/s) and Anjar (31.8 m3/s). Hasbani is a transboundary river, a major tributary of the Jordan River, descended from Jabal Hermon and runs about 25 km in Lebanon. The principal springs are El Hasbani (1.21 m3/s) and El Wazzani (1.9 m3/s); other springs are located in the southeastern part of Beqaa and flow southwards.
El Assi is also a transboundary river shared by Lebanon, Syria, and Turkey, it is about 33 km in length in Lebanon, and the main springs are Ain Zarqa (2.44 m3/s) and Labouh (0.95 m3/s).
2.2. Hydrological drought history of the basins studied
The signs of drought include decreases in the minimum average of the base flow index, such as those recorded in Table 1. El Damour is an example at the Sea Mouth gauge with an index of 0.01.
The historical drought study is based on the available data for hydrological measurement periods ranging from 15 to 79 years (Table 2). This table shows that, in downstream coastal rivers, drought events occurred 4 to 23 times, with flows falling an average of 30 to 88%. For the interior rivers, drought events occurred 7-36 times, with the flow rate dropping 30-91% below average. It must be said that flow measurements, at most gauging stations, are “observed, not natural” flows due to human interventions and manipulations such as pumping and the influence of dams that lead to under- or over-estimated and calculated flows (FAO 1974).
Table 2.
Hydrological drought history of 7 rivers selected in Lebanon.
3. Availability of hydrologic and rainfall data in the study area
The SDI index was computed for fourteen hydrological stations with different measurement periods ranging from 1931 to 2020, and the SPI was calculated for five climatic zones with data covering 1901-2020. For comparison of annual drainage and precipitation in a basin, the periods were matched for the two types of data.
3.1 Rainfall characteristics of 7 climatic zones
Climate zone identification and the rainfall dataset are based on the work of the World Bank5, which presents high-level information on Lebanon’s climate zones and the seasonal cycle of precipitation for the latest climate data 1901-2020. Climate zone classifications are derived from the Koppen-Geiger climate classification system based on seasonal rainfall and temperature patterns, which separates six main climatic areas: Beirut, Mt. Lebanon, North, Beqaa, South, and Nabatieh.
The average annual rainfall declined over a century from 719 to 651 mm, with 60% falling in the rainy season (Nov.-May). According to FAO (2018), the rainfall has decreased by 40-50%, and as a result, many springs and wells have dried up. It should be noted that the decrease in rainfall affects all seven climatic zones but to different extents. Many studies attribute the decrease in runoff rates to a reduction in rainfall and snowfall (Haddad et al. 2014) that affects the recharge of the groundwater table and the springs.
3.2. Annual and seasonal average values of rainfall for climatic zones
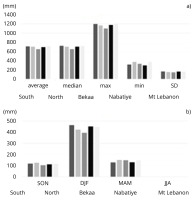
Statistical analysis of the annual and seasonal average rainfall for the climatic zones in Lebanon shows that the second season (December, January, and February) has the most abundant precipitation (Fig. 2). Note that the annual and seasonal average rainfall in the Beqaa climatic zone has the lowest average without calculating the amount of equivalent snow water. The lowest average is recorded in June, July, and August. The annual and monthly rainfall for all zones has the characteristics of a Mediterranean climate, with the highest total rainfall recorded in Jan. The lowest rainfall total is observed in Aug. About 70% of the annual rainfall occurs in the winter months, from December to February, and 21-24% in spring and autumn.
3.3. Hydrological statistics of the river basins
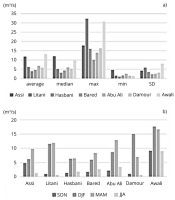
The Hydrological Service of Office National of El Litani provides hydrometric data for different periods at the stations of seven basins (Table 3). Fourteen of the 29 gauging stations were accredited by the long measurement period, despite a gap for some years (especially 1975-1989), and 15 were rejected due to the short duration of the measurement. A period of 25 to 70 years was selected for the hydrological drought study based on data quality, recorded length, and area coverage. For each basin, a discharge time series was available for various periods between 1931 and 2020 (Fig. 3).
Table 3.
The average annual flow of the gauging stations and the corresponding recording date of 7 rivers in Lebanon.
| Basin | Stations6 | Area (km2) | Elva (m) | Latitude DD | Longitude DD | Recorded years | Discharge (Mm3) | Runoff (mm) |
|---|---|---|---|---|---|---|---|---|
| El Bared | Tirane | 40 | 510 | 34.405 | 36.03 | 1967-1969 | 116.2 | 2916 |
| Qabaait | 161 | 390 | 34.4533 | 36.12 | 1967-1969 | 114 | 708 | |
| Sea Mouth | 262 | 0.5 | 34.4983 | 35.9733 | 1960-2020 | 149.07 | 569 | |
| Abu Ali | Tirane | 40 | 510 | 34.405 | 36.03 | 1967-1969 | 116.2 | 2916 |
| Qabaait | 161 | 390 | 34.4533 | 36.12 | 1967-1969 | 114 | 708 | |
| Sea Mouth | 262 | 0.5 | 34.4983 | 35.9733 | 1960-2020 | 149.07 | 569 | |
| Ed Damour | EL Safa | 40 | 518 | 33.7133 | 35.6533 | 1960-1979 1990-2001 | 30.33 | 758 |
| Rachmaya | 52 | 447 | 33.735 | 35.6383 | 1960-2001 | 55.43 | 1066 | |
| El Hamam | 77 | 45 | 33.6816 | 35.49 | 1966-1973 | 36.78 | 478 | |
| Jisr El Qadi | 185 | 250 | 33.7133 | 35.5666 | 1960-2001 | 127.52 | 689 | |
| Sea Mouth | 302 | 0 | 33.7061 | 35.4594 | 1994-2020 | 157.39 | 521 | |
| El Awali | Bisri | 222 | 385.8 | 33.4233 | 35.5616 | 1950-1989 2001-2020 | 115 | 518 |
| Saida -Sea M. | 298 | 3.5 | 33.4116 | 35.4083 | 1940-2020 | 352 | 1181 | |
| El Assi | Hermel | 1370 | 585 | 34.34 | 36.38 | 1931-1979 1990-2019 | 369.00 | 269 |
| Wazzani Spring | - | 271.2 | 33.2683 | 35.63 | 1960-1969 2003-2018 | 102.95 | - | |
| Before spring | 340 | 548 | 33.4133 | 35.6966 | 1960-1979 | 25.73 | 76 | |
| Fardis Bridge | 448 | 494.6 | 33.3666 | 35.6533 | 1960-1979 2002-2018 | 60.29 | 135 | |
| Aft. Wazzani spr. | 526 | 183 | 33.2572 | 35.6216 | 2002-2018 | 127.30 | 273 | |
| El Litani | Qabb elias | 19 | 914 | 33.79 | 35.83 | 1960-1979 1990-2001 | 18.76 | 987 |
| Jelala | 22 | 890 | 33.7883 | 35.8683 | 1960-1979 | 6.67 | 303 | |
| Berdaouni | 77 | 866 | 33.7783 | 35.895 | 1950-2001 | 33.32 | 433 | |
| Ghzayel | 126 | 867 | 33.7533 | 35.9166 | 1990-2001 | 107.84 | 856 | |
| Mansourah | 1345 | 859.3 | 33.68 | 35.6616 | 1931-1969 | 247.05 | 184 | |
| Qaroun dam | 1545 | 866 | 33.7666 | 35.8966 | 1939-1947 1969-2011 | 327.56 | 212 | |
| Quelieh | 1680 | 521 | 33.44 | 35.6633 | 1930-2011 | 358.63 | 213 | |
| Khardale | 1808 | 239.2 | 33.3216 | 35.5483 | 1931-2018 | 379.30 | 210 | |
| Ghandourah | 2066 | 859.3 | 33.68 | 35.6616 | 1960-2012 | 298.50 | 144 | |
| Qasmieh | 2153 | 0 | 33.3216 | 35.25 | 1960-1970 1990-2018 | 279.62 | 130 |
Fig. 3.
Annual statistics (a) and seasonal average (b) of discharges of 7 basins in Lebanon (Cf. Table 3). The stations with long periods of measurement were adopted.
The streamflow stations in El Bared and Ed Damour basins have more missing data, and it was difficult to analyze drought with minimum data availability. For these two basins, the gauging stations used are El Bared at Sea Mouth, Abu Ali at Kousba, and Abou Samra, which have a minimum of 25 years of data. But the other five basins fulfill the minimum data length required (30 years) for drought analysis: Ed Damour at EsSafa, Jisr El-Qadi, and Sea Mouth. El Awali at Bisri and Sea Mouth, El Assi at Hermel, El Hasbani at Wazzani Spring and Fardis Bridge, El Litani at Qaroun Dam, Khardale, and Qasmieh.
The annual discharge at sea mouths of rivers El Bared, Abu Ali, Ed Damour, El Awali, and El Litani ranges between 149.07 and 379.3 Mm3. The annual discharges of El-Hasbani and El-Assi before leaving the Lebanese territories are respectively between 127.3 and 369 Mm3.
Comparing measuring stations, El Litani at Khardale has a high flow, followed by El Assi at El Hermel. El Litani is the only one of these rivers on which a dam is located (at Qaraoun). Nevertheless, the discharge at El Khardale is the most susceptible, as it has been decreasing dramatically (as shown later).
In four of seven basins (El Litani, El Hasbani, El Damour, and El Awali), the average runoff has one peak in the winter (in January, February or March) before snowmelt. In the three others (El Assi, El Bared, and Abu Ali), the average runoff has one peak in the spring (April). The lowest runoff for all rivers occurs in the summer, from July to September, except in El Hasbani and El Assi, where minimum flows are from October to December.
The drainage of rivers depends on seasonal rainfall, and it varies widely from the rainy to the dry season (Ed Damour, El-Hassbani). The drainage of rivers that depend on melting snow and water springs decreases the difference between seasons (El Assi and El Bared). The drainage of the El Awali and El Litani rivers cannot be relied upon due to pumping (El Awali) or retention of the discharge (Qaraoun Dam) for technical reasons.
For each basin, one close-by climatic zone was chosen that seemed representative of the climatic conditions of the basin, and that was the most representative of topographical factors such as elevation and exposition.
4. Methodology
Managing water resources requires establishing drought characteristics in the form of published indices that are easy to interpret and can be applied to improve knowledge of the intensity and severity of drought.
Despite various ways of evaluating and defining hydrological drought, all are focused on the same issues with a time-step evaluation of the phenomenon (day, decade, month, season, and year). By accepting the definition of low flow for a period, the criterion for the threshold selection and separation of hydrological droughts from a series of low-flow events followed the classification proposed by Dracup et al. (1980).
Hence, the threshold level in this study depends on deviation from normal mean discharge for an average period of months, seasons, and years. Another distinguishing feature of drought is its duration, taking two to three months to become established, and possibly continuing for months or years. In a country with a small area, such as Lebanon, the entire country may be affected since droughts are usually regional phenomena; they result from large-scale anomalies in atmospheric circulation patterns that become established and persist over periods of months, seasons, or longer.
Drought is quantified in the form of simple indicators. Among these indicators7, are two that will fit this threshold and have advantages:
The standardized precipitation index (SPI) is a statistical indicator comparing the total precipitation received at a particular location during n months with the long-term rainfall distribution of the same period at that location. It applies to all climate regimes.
The streamflow drought index (SDI) uses monthly streamflow values to monitor and identify drought events represented by a particular gauge. The advantage of this indicator is that missing data is allowed, that is, although some years may be missing (Table 3), as in this study, the longer the streamflow record, the more accurate the results. As with SPI, various timescales can be examined. The streamflow drought index is defined as a decrease in the amount of available water in all of its forms.
4.1. Assessment of hydrological and rainfall droughts in seven selected basins in Lebanon
4.1.1. Rainfall drought analysis using Standardized Precipitation Index (SPI)
The Standardized Precipitation Index (SPI) has been recognized as a standard index that should be used for quantifying and reporting rainfall drought; SPI is based on time series drought characteristics:
where: xi is the monthly precipitation for the climatic zone (1901-2020);
The calculation of SPI reveals temporal and spatial relationships of series, allowing quantification and comparison with different durations and providing information on differences in drought behavior among climatic zones.
The monthly precipitation data were analyzed and processed by calculating the SPI using the Software DrinC8. This software for SPI is used to derive 6-months SPI values for each climatic zone, where the 6-monthly value gives intermediate-term drought. The drought categories are defined by the classification based on SPI (Edossa et al. 2009) and SDI (Hong et al. 2014). The result obtained from software based on 6-months SPI time series, the maximum drought severity that occurred in the two climatic zones of Nabatieh and south, was respectively –4.67 and –4.37 in the second 6-months (Apr.-Sep.) of the year 1989. The drought frequency (%) in the third category shows that the extreme drought (<–2.0) occurred in the first 6- months (Oct.-Mar.) in Nabatieh and in the second 6-months in the Beqaa (Table 4). The maximum moderate and severe drought frequency ranges between 0.62 (North) and 0.3 (Beqaa) in the first 6-months of the year.
Table 4.
Drought frequency9 in the severity category according to SPI of the climatic zones in Lebanon.
The probability of occurrence of drought, calculated in this study, for climate zones in South, Beqaa, Nabatieh, Mount Lebanon, and North, relative to the year and severity of events is:
| Oct.-Mar. | Apr.-Sept. | |
| Moderate | 1 in 15 to | 1 in 20 years |
| Severe | 1 in 20 to | 1 in 40 years |
| Extreme | 1 in 24 to | 1 in 40 years |
During 120 years in all climatic zones, drought ranged from 30% to 14%. In the north, a drought recurrence was recorded in 30.8% of the years, followed by Mt. Lebanon and the Beqaa with 29.8% of the years as a recurring drought. In the South and Nabatieh, 14% and 25.7% of drought recurrences were recorded.
The maximum of extreme drought recurrence was observed in the Beqaa for 4 years:1927-28,1965-66,1984- 85 and 2009-10 (Apr.-Sep.), in the North for 5 years: 1932-33, 1959-60, 1972-73, 2007-08 and 2013-14 (Oct.-Mar.) and in the Nabatieh also for five years: 1932-33, 1950-51, 1959-60, 1978-79 and 1998-99 (Oct.-Mar.).
4.1.2. Hydrological drought analysis using the Streamflow Drought Index
The SDI method, developed by Nalbantis (2008), was used to characterize the hydrological drought events for the studied area. To compute the SDI values, the monthly observed flows of the time series are assumed. Its calculation is similar to SPI and, therefore, has the same characteristics of simplicity and efficiency. The SDI is based on monthly observed streamflow volumes at different time scales and thus offers the advantage of representing streamflow drought in the short, medium, and long term. The formula is (Gumus, Algin 2017):
where: Qij is river discharge for hydrological year (i), and month (j) within that hydrological year (October through September). Based on these series, the cumulative streamflow volume is computed where k = 1 and k = 2 are the first 6 months (Oct.-Mar.) and second 6 months (Apr.-Sept.) periods, respectively in a hydrological year.
The SDI values have been classified by (Hong et al. 2014) into eight classes that vary from extreme wet to extreme drought. The classes of wetness and dryness of SDI range between –2 and +2.
Hydrological drought is characterized by duration (D), severity (S), magnitude (M), and relative frequency (RF). Drought duration is the time between consecutive drought events (onset and end of drought). The duration (D) is from the initiation of a negative SDI until the flow returns to a positive SDI value (Tareke, Awoke 2022).
The relative drought frequency is the ratio of the number of droughts (n) with negative SDI in drought duration and the total number of drought years in the analysis (N), and RF is defined as (Tareke, Awoke 2022):
4.1.3. Spatial distribution of droughts in the selected basins and climatic zones using Inverse Distance Weighting
The spatial distribution maps are rendered using the method of inverse distance weighting (IDW). This method is a powerful deterministic technique for the spatial interpolation of results, and it is an inherent advantage that is relatively fast in computation, which improves the ease of interpretation (Shepard 1968; Lu, Wong 2008). Commercially available software (ArcGIS) was used to obtain the spatial distribution, and the maps were generated using ArcGIS 10.7 for the studied area. The IDW technique assumes that unmeasured near points have a higher probability of weighting than far points (Gumus, Algin 2017).
Researchers assume that the IDW method provides a similar output map to that of the Gaussian process regression method (Kriging), which is useful for smaller areas or in the case of high station density (Gemmer et al. 2004). The power parameter (which controls the values of the interpolated sample over the expected location of a searched radius) is the main factor affecting the accuracy of the IDW method. Higher power values result from nearby samples, which affect estimation, and the resulting spatial interpolation surfaces become more detailed.
4.2. Correlation between hydrologic and rainfall drought indicators
Pearson’s correlation coefficient (r) describes the strength and direction of a linear relationship between two quantitative variables, although the interpretation of the strength of this relationship varies between disciplines. The strength of r values has been interpreted as “greater than +0.5 (strongly positive) and less than –0.5 (strongly negative).” As an inferential statistic, r is used to test statistical hypotheses of significance for a linear relationship between two variables. However, the reliability of the linear model also depends on the length of data in the sample.
The significance of the correlation coefficient is used in this study to decide whether the linear relationship between the SPI and SDI is strong, moderate, or weak. The hypothesis t-test, comparing SPI and SDI correlation coefficients, addresses whether there is a linear relationship between them by using the t observed and the r-value.
5. Results
The study of SPI and SDI indices based on the hydrologic and rainfall data of the seven river basins and the five climatic zones, which were calculated on timescales of 6-months, clarifies how the hydrologic and rainfall droughts in the critical situation are achieved.
5.1. Hydrologic and rainfall drought statistical analysis
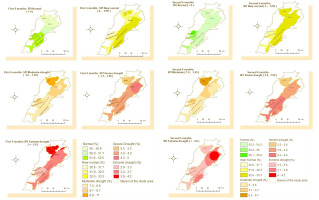
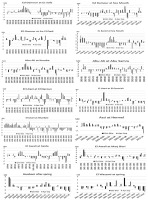
The spatial distributions covering climatic zones based on the SPI values demonstrate the highest severe and extreme drought events observed in the first 6-months for the years: 1902/03, 1921/22, 1927/28, 1965/66, 1986/87, 1988/89, 2009/10, and for the second 6-months for the years: 1932/33, 1959/60, 1972/73, 1978/79, 1998/99, 2007/08, 2013/14 (Fig. 4). The spatial distributions based on the SDI values (Fig. 5) indicate the highest severe and extreme drought events for the first and second 6-months are encountered in the years 1985/86, 1989/90, 1998/99, 2000/01, 2007/08, 2013/14 (at most of the stations for this year), and 2017/18, with an occurrence of 4 to 18%.
Fig. 4.
Temporal standardized precipitation index (SPI) values of the five climatic zones in Lebanon according to two seasonal periods (Oct.-Mar. and Apr.-Sept.) (1901/1902-2019/2020).
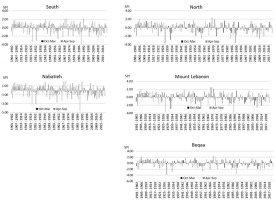
Fig. 5.
Temporal drought index (SDI) values of selected stations in river Lebanon according to two seasonal periods (Oct.-Mar. and Apr.-Sept.).
5.1.1. Statistical Analysis of the Standardized Precipitation Index
The SPI distributions demonstrate that some climatic zones (Tables 4 and 5) exceed the threshold of classes of extreme drought (SPI < –2) and extreme wet (SPI > 2). The variation in SPI mean values shows that the second 6-months period of the years 1927/28, 1932/33, and 1988/89 are characterized as extreme drought events.
Table 5.
Severity category according to SPI of climatic zones supplying studied basins (1901-2020).
The median of the SPI (Table 6) of the first and second 6-months periods at climatic zones in Lebanon from 1901 to 2020 is about mildly wet. The recurrence of extreme drought in the south, in Beqaa, Nabatieh, Mt. Lebanon, and North, ranged from 3 to 5 times over 120 years.
Table 6.
The median of SPI at climatic zones in Lebanon (1901-2020).
| Climatic zone | Median of SPI | Description | Value | |
|---|---|---|---|---|
| Oct.-Mar. | Apr.-Sep. | |||
| South | 0.12 | 0.15 | Mildly wet | –0.99, 0.99 |
| North | 0.01 | 0.09 | ||
| Nabatieh | 0.08 | 0.18 | ||
| Mt Lebanon | 0.05 | 0.09 | ||
| Beqaa | 0.02 | 0.09 | ||
In the first 6-months period, the greatest drought is recorded in the north climatic zone, and in the second 6-months period, it is recorded in the northeastern Beqaa zone.
The percentage of severe and extreme droughts ranged between 2.5 and 5% in the five climatic zones. The frequency of normal conditions was 52.5% in the first 6-months periods and 55.8% in the second 6-months period over all five zones.
The median SPI for the first and second 6-months was calculated for each climate zone from 1901/02 to 2019/20.
The median of the five climatic zones (Table 6) for the first and second 6-months periods SPI is mildly wet. It ranged between 0.01 in the first 6 months (North climatic zone) and 0.18 in the second 6 months (Nabatiyeh climatic zone). The probability of the median is at least 50% will be less or greater than or equal to –0.99 and +0.99, which means mildly wet conditions should be expected to occur in one out of two years.
5.1.2. Statistical Analysis of the Streamflow Drought Index
Since SDI is a point or site-specific drought indicator, the discussion here considers the fourteen gauging stations of the basin. Hydrological drought is progressing gradually due to the scarcity of rainfall, which stops or decreases for some consecutive months from April to November. Therefore, this study focuses on two seasons based on the first and second SDI-6 of hydrological drought analysis that can summarize the annual drought conditions. The result indicates that the frequency of drought based on SDI is similar for both 6- months seasons and seven studied basins(Table 7), even though the drought is not very strong. The temporal and spatial variation of streamflow drought in the study area using SDI indicates that the lowest negative SDI value (–2) was registered for one year at nine measurement stations out of 14, as shown in Figure 5.
Table 7.
Frequency of hydrologic droughts in 7 basins of Lebanon.
Moderate, severe, and extreme droughts, occurring several times over the years of record at various gauging stations, indicate that the El Litani River basin was highly affected by three extreme droughts, followed by the El Awali River basin at Saida with two extreme droughts. The analysis implies that El Damour, El Bared, and Abu Ali at Abu Samra and El Awali have had similar drought occurrence seasons at least in the past ten years. The drought analysis shows that El Hassbani and the lower and central parts of El Litani recorded a constant drought for several years.
For consecutive years, the majority of the river basins were affected by severe to extreme drought. Besides these drought events, some periods were dominated by moderate drought conditions at most stations, and some other stations were affected by extreme drought in both the first and second SDI.
The sum of drought events ranges from 8% for the second 6 months (El Litani at Qasmieh) to 20% for both the first and the second 6-months periods (Abu Ali at Kousba). Although 80% of the averages of all events were in the normal or near-normal range of wetness, 30% experienced a hydrological drought (Table 7).
According to the SDI, 10 out of 14 monitoring stations were affected by a near-drought once every two years in the first season, and five out of 14 monitoring stations were affected by near-drought in the first and second seasons. Other than that, the median of the SDI did not exceed near-normal or mildly wet (Table 8).
Table 8.
The median of the Streamflow Drought Index at the hydrological gauging stations studied (reference of date to Table 3).
The median SDI of the first and second 6-months periods for each hydrological gauge station was calculated for different periods (Table 3).
The median of the first and second 6-months of SDI for 14 hydrological gauging stations (Table 8) was mildly wet, ranging from –0.24 in the first 6-months period (Kousba) to +0.45 in the second 6-months period (El Hermel). The probability of mildly wet conditions in SDI is 50%, which means they occur one out of two years.
5.2. Extreme hydrologic drought events
The SDI values of the hydrological drought events indicate that some stations encounter extreme drought conditions. Extreme drought events occurred in the second 6-months period at El Damour Sea Mouth (2013/14), Khardale (1985/86, 1989/90, and 1998/99), Kousba, and Marj Bisri (2013/14), Qaroun (1989/90, 2007/08), and Saida (2013/14). Accordingly, the effect of extreme drought in rainfall appears as a severe hydrological drought for the same timescale in the following year (1989/90). Commonly, the most extreme streamflow drought year for all gauging stations in the basins of the study area was obtained in hydrological years 2013/14 (Abu Samra, El Hermel, El Bared Sea Mouth, Ed Damour Sea Mouth, Es Safa, Kousba, Marj Bisri), 1985/86, 1989/90 and 1998/99 (Khardale ), 1989/90, 2000/01 and 2007/08 (Qaroun) and in 2017/18 (Saida).
Extreme drought in the study basins recurred a maximum of 3 times over 49 years (Qaroun) and over 79 years (El Khardale), which means the severity of events is 1/16 years at Qaroun and 1/26 years in Khardale.
5.3. Spatial distribution of hydrologic and rainfall drought
The spatial distribution maps obtained using the IDW method are shown in Figures 6 and 7. The figures indicate the occurrence of drought events based on the values of SPI and SDI by considering classes from normal to extreme drought. Figure 6 shows the occurrence rates of moderate, severe, and extreme drought in the entire climatic zones, in the range for the first 6-months period were 7.5-11%, 2.5-5%, and 2.9-4.2%, respectively. The SPI for the second 6-months period ranged from 5-6.7%, 3.3-4.6%, and 3.3-4.2% for moderate, severe, and extreme drought, respectively. The greatest rainfall drought level, 3.8-4.2%, was observed in the northern climatic zone, which affects the basin of El Bared and Abu Ali, based on SPI for the first 6-months period, and 4-4.2 in the climatic zone of the Beqaa, which affects the basin of El Assi, based on SPI for the second 6-months period.
Fig. 7.
SDI for 6-months periods at the selected streamflow sites in Lebanon (dates according to Table 3).
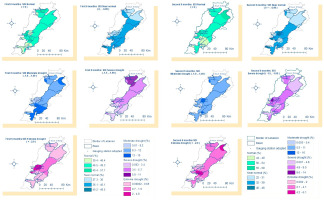
Considering the entire basins at all timescales, the lowest drought occurrence was 17.5% (North) for SPI in the first 6-months period and 20% (Abu Ali) for SDI, also in the first 6 months. Percentage drought occurrence with varying intensities is shown in Figures 6 and 7 for SPI and SDI for the first and second 6- months periods. Extreme drought events, per SPI, were observed in the zone of the basins of El Bared, Abu Ali, and El Assi. Per SDI, extreme drought was encountered in the northwest of El Damour basin, West of El Awali, north of El Assi, and middle of El Litani.
The spatial distributions of the most drought events occurring for various periods are shown in Figure 7 for SDI. The figure shows that the highest severe and extreme drought events (first 6-months period) are observed at Ed Damour stations Sea Mouth and Marj Bisri, as well as in El Bared at Sea Mouth, Abu Ali at Abu Samra, and in El Assi at El Hermel.
Based on SDI, drought intensities of moderate, severe, and extreme in most of the basins are respectively in the range of 0.01-19%, 0.003-11%, and from 0-4.8% (first 6-months period) and 0-16%, 0-14%, and 0-6.1% for the second 6-months period. Severe drought events were observed in the climatic zones of Beqaa, Mt Lebanon, South, and Nabatieh, as in the basins of El Bared, most of the Abu Ali, and the middle and mouth of Ed Damour basin.
Extreme droughts based on SPI ranged between 2.9-4.2% and 3.3-4.2% (first and second 6-months periods), and, based on SDI, were between 0-4.8 and 0.002-6.1 for the study basins. For combined 6-months periods, severe droughts were 2.5-5% per SPI, and for most of the study basins per SDI, they were in the range of 0-14%.
5.4. Correlation between SDI and SPI indices
The investigation has been analyzed by examining the strength of the relationships between SDI and SPI using bivariate correlation analysis (Table 9). The correlation coefficients (Pearson’s r) based on the values of SPI and SDI for the various timescales10 are provided in Figure 8.
Table 9.
SDI and SPI correlation in selected basins in various climate zones of Lebanon (reference of date to Table 3).
Fig. 8.
Correlation SDI-SPI for the first and second 6-months periods in basins of Lebanon (reference of date to Table 3).
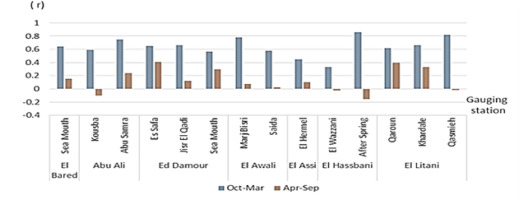
Given that the critical thresholds for a strong correlation are –0.50 or +0.50, there is a strong positive relationship between SPI and SDI for the first 6-months period (Oct.-Mar.) for 12 stations, ranging from 0.86 (El Hassbani after spring) to 0.57 (Ed Damour at Sea Mouth). are weak positive relationships for two stations: 0.45 (El Assi at El Hermel) and 0.33 (El Hassbani at El-Wazzani). The correlation between SPI and SDI in the second 6-months period (Apr.-Sept.) is very weak, with values ranging from a minimum of –0.01 to –0.15 to a maximum of 0.02 to 0.40 for 12 stations. Correlations are modest (0.40) for the two remaining stations (El-Safa and El-Qaraoun).
The significance of r from a set of data points that appear to have a linear relationship is presented in Table 9. Correlations between SDI and SPI were not significant (p > 0.05), except for El Safa, which is statistically significant (p = 3.79).
6. Discussion and conclusion
To answer the research question that deals with the characteristics of hydrologic and rainfall drought and their spatial and temporal distribution in the basins of different climatic zones in Lebanon, the results show an unevenly, mildly wet to mild drought conditions, with a 14.5% decline in rainfall from 1901 to 2020. The results for rainfall drought are similar to those from previous studies, which range from 12 to 16% (Shaban 2015). The decrease is larger in the case of rivers, where the hydrologic drought ranges from 21.3% (El Bared at the Sea Mouth (1966-2020) to 58.5% (El Litani at Khardale, 1939-2018), which differs from Shaaban (2018), who reported a difference between 23 and 29%.
The temporal variation for the first and the second 6-months periods in median values of SPI, represents mildly wet events in climatic zones in Lebanon occur with a probability of one out of two years.
The study indicates that the greatest drought for the first season was recorded in the northern climatic zone, and in the northeastern Bekaa climatic zone for the second season. The climatic zones most vulnerable to rain drought are Bekaa and the north.
While severe drought is frequent in most zones, this result can be compared with Faour’s (2015) studies, which specify moderate to extreme drought in the Bekaa Valley, and a moderate to severe drought in the Amioun area (located in the northern climatic zone).
The temporal variation in median SDI based on the first and second 6-months periods oscillates between mild drought (-) and wet (+) events in basins studied in Lebanon.
Measurement stations have generally been affected by moderate, and, in recent years, occasionally severe and extreme droughts. It must be said that each basin constitutes a case of moderate drought due to the difference in the measurement period and the lack of data for several years. Unfortunately, it is not possible to compare the results of the hydrological drought index for the study basins of Lebanon with previous ones, where similar studies are not available in the literature.
The spatial and temporal maps displaying the distribution of 14 water metering stations contributed to this study to understand the ratio and locations vulnerable to hydrologic and rainfall drought. The climatic zones with severe drought, for the first 6-months periods, are in the north, and for the second 6-months periods are in the northern Bekaa. The basins with severe drought, for the first 6-months periods, are in El Damour and El Awali, and for the second 6-months periods are in northern and central Bekaa.
The relationship between SPI and SDI fined in the first and second 6-months periods is weak, so it is not statistically significant. Since the values of SPI and SDI are not matched, one might assume the correlation between SPI and SDI values is weak. Calculating the correlation coefficient for these variables based on hydrologic and rainfall data reveals an inconsistent correlation over different periods.
These insignificant relationships reinforce the result of this study that the decline in discharge at the studied measurement stations is not only associated with the decrease in precipitation but may be related to other factors, including human intervention.
In all cases, the status is quite alarming and demands immediate water management plans to conserve water resources in the study basins, which are heavily populated and cover large investment areas. It is important to conduct additional investigations into hydrological drought and to develop drought early warning systems. Therefore, this study gives important information to decision-makers, about hydrologic and rainfall drought conditions for five climatic zones and seven river basins representing most flow directions to mitigate these effects.

