1. Introduction
The impact of hurricanes in coastal regions is a significant threat to human life, urban infrastructure, and economic stability, particularly in vulnerable areas with high population density. In recent decades, hurricanes Pauline [1997], John [1978], and more recently, Otis [2023] have caused significant destruction to the port of Acapulco, Mexico, resulting in substantial human casualties, forced displacement, and economic devastation. The intensity of these events is not solely attributable to the strength of the winds or the amount of precipitation, but also to structural factors such as unplanned urban expansion, the fragility of the electrical system, and the lack of institutional preparedness (Hallegatte et al. 2018; Simpson et al. 2023). Recent studies on hurricanes with similar impacts, such as Sandy [2012] in the United States and Dorian [2019] in the Bahamas, have allowed more accurate modeling of the relationship between storm size, wind speed, and resulting economic losses. For instance, Collins et al. (2021) demonstrated that economic damages are influenced by factors beyond maximum sustained wind, including tropical storm wind radius, sea level, and territorial exposure. These quantitative approaches have been validated using Bayesian methods and machine learning models. This validation process has revealed the complexity of damage attribution (Chavas et al. 2016; Geiger et al. 2018). Additionally, compound events, such as “hurricane-blackout-heat wave,” are emerging as new forms of systemic risk in urban and coastal areas. Research on vulnerable electrical systems in Gulf of Mexico and Southeast Asian regions has elucidated this phenomenon, demonstrating but I’m that the loss of electrical power exponentially increases the risk to public health during and after tropical cyclones (Feng et al. 2025; Lewis 2022). This phenomenon was evident after Otis passed through Acapulco, where communication and medical care systems collapsed for more than 72 hours. From a socioeconomic perspective, disasters such as Pauline and Otis should be understood as “socially constructed disasters,” where poverty, urban planning, and institutional weakness amplify the damage caused by natural phenomena. The work of Koks et al. (2019) demonstrates that indirect effects, such as job losses, school disruptions, and forced migration can exceed the direct losses estimated by insurers and governments. Due to the increased frequency and intensity of extreme weather events exacerbated by climate change, there is an urgent need to develop a comprehensive risk management strategy that incorporates climate monitoring, resilient land use planning, and improved rapid response systems. More robust approaches to hurricane risk management are being proposed, including integrated predictive models, multi-hazard analysis, and data science-based strategies (Zscheischler et al. 2018; Gran Castro, Ramos De Robles 2019). Floods can be extreme events in most countries in Latin America and the Caribbean (LAC) (Molina-Aguilar, Gutierrez-Lopez 2020). In general, these floods result from torrential rains produced by convective systems (Khurana et al. 2017). Many of these extreme storms are also caused by hurricane-cyclones that affect the Pacific Ocean coast, the Gulf of Mexico, and the Caribbean region (Hallegatte et al. 2013). Although hurricane rains can sometimes benefit cultivated areas and fill reservoirs (Breña-Naranjo et al. 2015), in most cases, they cause disasters (Jaimes et al. 2014). However, in developing countries, such as most LAC countries, there is often a lack of effort in following the development and tracking of these extreme phenomena (Leroux et al. 2018). Due to the limited number of radars, meteorological satellites, and ground-based warning systems, predicting the impact site of hurricane-cyclones in LAC remains a challenging task (Heming et al. 2019; Magnusson et al. 2019). Recent studies have mapped the East Coast of the United States, using colors to indicate the probability of a hurricane occurrence at each site (Gori et al. 2022). Monitoring extreme phenomena like hurricanes and the rain-fields they produce is critical for mitigating the risks of flooding, particularly in coastal areas. For example, Hurricane Otis in October 2023 and Hurricane Pauline in October 1997 devastated the city of Acapulco on the Pacific-coast of Mexico. Forecasting of storm tracks is typically carried out using data from sensors installed on specialized aircraft (Aberson, Franklin 1999). Forecasting can also employ global models (Chen et al. 2013; Nishimura, Yamaguchi 2015; Hon 2020), high-definition satellite imagery (Weng et al. 2007; Cui et al. 2013), or even fuzzy clustering techniques (Nath et al. 2015). Currently, few studies use wind speed and pressure data to predict hurricane tracks based on probabilistic estimates of simultaneous occurrence. This paper utilizes statistical data to analyze the climatology and track of hurricane-cyclones that have impacted the coasts of Mexico from 1851 to 2022. The aim is to map the zones of joint probability of occurrence of wind speed and pressure data using a Bayesian formulation.
2. Materials and methods
This work is based on the premise that a mathematical model for track forecasting, which accounts for the physiographic and meteorological conditions of a hurricane, can accurately represent and predict the behavior of hurricane rainfall in space and time. The variability of the rainfall fields produced by hurricanes is directly proportional to the joint probability calculated with the wind and atmospheric pressure data.
2.1. Parameters for data collection
Data selection was based on research needs and recommendations from previous studies. Specifically, Knapp et al. (2010) used the International Best Track Archive for Climate Stewardship (IBTrACS). Tropical hurricanes and tropical storms track data were carefully collected from the International Best Track Archive for Climate Stewardship (IBTrACS). It is the most complete global collection of tropical cyclones available. It merges recent and historical tropical cyclone data from multiple agencies to create a unified, publicly available, best-track dataset that improves inter-agency comparisons. IBTrACS was developed collaboratively through all the World Meteorological Organization (WMO) Regional Specialized Meteorological Centers, as well as other organizations and individuals from around the world (available at: https://www.ncei.noaa.gov/data/international-best-track-archive-for-climate-stewardshipibtracs/v04r00/access/csv/). The data were built as a time-series database in Excel (CSV). Probabilistic models for extreme values and a Bayesian analysis were performed using a Visual Basic program. The data collected are for the area between longitudes 116° and 85° west and latitudes 12° and 30° north.
2.2 Description of data collection
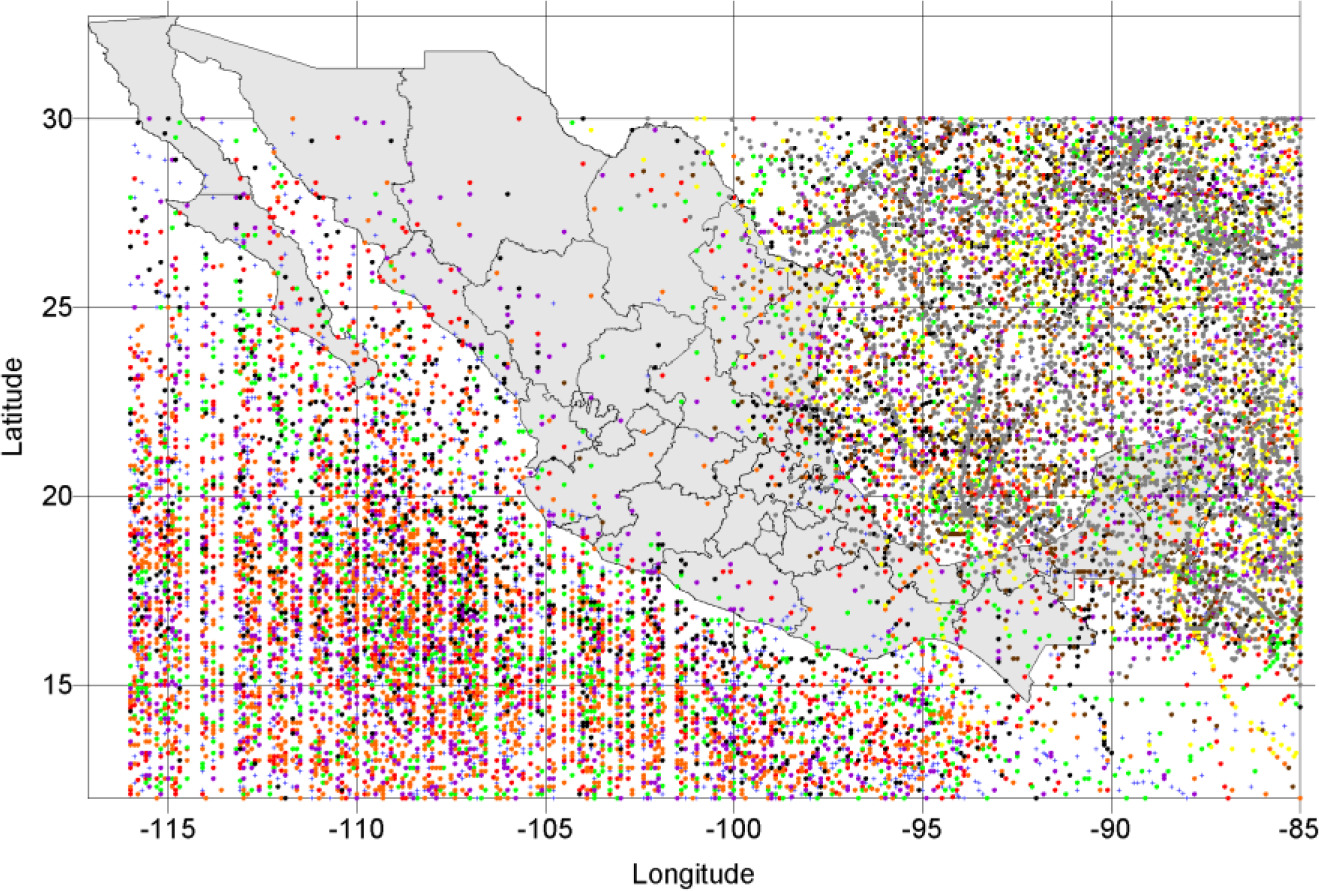
Historical data for hurricanes and tropical storms are available from 1851 to 2022. The original database is composed of storm identifier, year, basin, sub-basin, data-name provided by the agency, time in Universal Time Coordinates (UTC), nature of event (disturbance, tropical, extratropical, or subtropical), latitude, longitude, maximum sustained wind speed from the WMO agency for the current location, and atmospheric pressure at the ocean surface in hectopascals. After processing the original data, the resulting files contain in addition the following results: frequency in years of wind speed occurrence, probability of wind speed occurrence, reduced Gumbel variable for wind speed, and estimated value of wind speed based on the extreme event model. Other variables include: frequency in years of pressure occurrence, probability of pressure occurrence, reduced Gumbel variable for pressure, and estimated value of pressure based on the extreme event model. From the Bayesian analysis, we derived the probability that a hurricane or tropical storm with a certain wind magnitude will happen at a specific latitude and longitude, given that a specific pressure event occurs. The general scheme of all available data is shown in Figure 1. In summary, there are 19,246 records with a total of 288,690 data points.
3. Results
3.1 Generalized Extreme-Value Distribution (GEV)
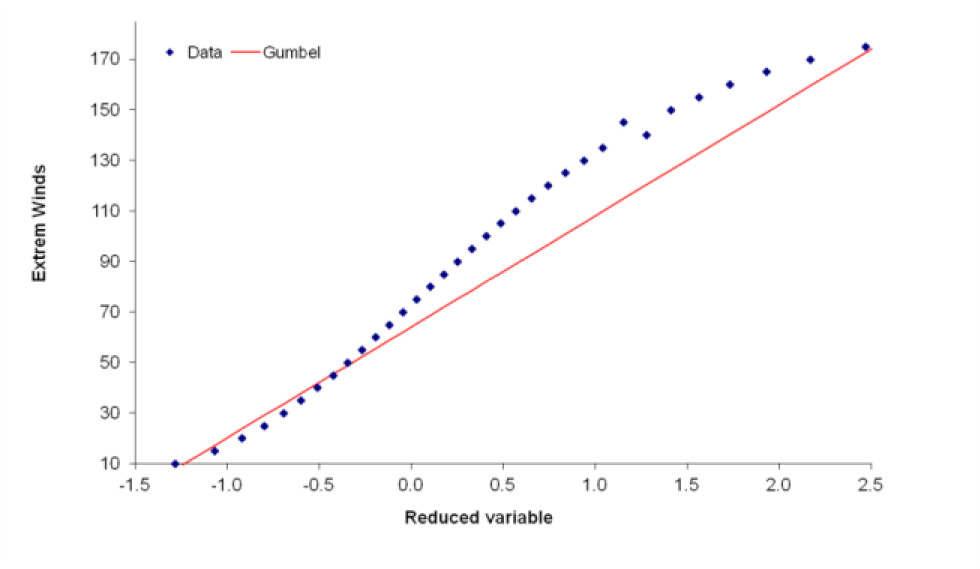
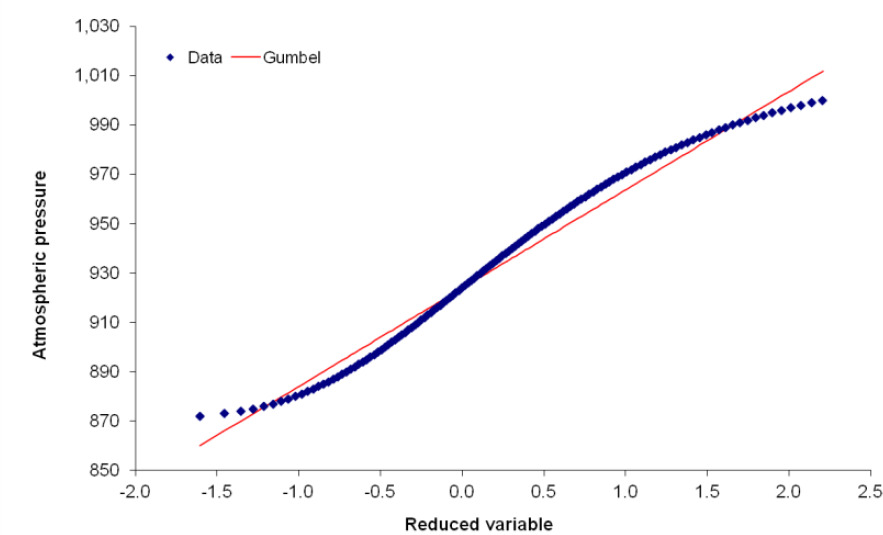
All available data were transformed into a time series. Frequency analysis was applied as described in Gutierrez-Lopez (2022). The Generalized Extreme Value distribution (GEV) was used to model extreme wind speed and atmospheric pressure for all events at all sites. Figures 2 and 3 show the result of this fit to the characteristic climatological variable data. The theory of extreme values is concerned with events at the tails of probability distributions. Gumbel proposed the characteristic function of these extremes, which allows for their adjustment based on the sample size of the maximum events of a time series (Molina-Aguilar et al. 2019).
Equation (1) represents the (GEV and establishes three types of distribution, which graphically generate asymptotic behaviors according to the values adopted from the parameters of location (ε), scale (λ) and shape (k). F represents the probability of non-exceedance for the probability distribution function; qi is the order assigned to the maximum annual expenditure in the time series. In the case where k tends to 0 and –∞ < qi < ∞ is defined as Type I (EV1) called the Gumbel function. If k < 0 and ε + λ/k < qi < ∞ is defined as Type II, known as the Frechet function. Finally, if k > 0 and –∞ < qi < ε + λ/k, a Type III or Weibull function is generated. Its probability density function (fdp), is obtained from the ratio of change (qi) with respect to the independent variable Q, with the form:
The Gumbel distribution (EV1) is one of the three distributions generated from the GEV, in which the random variable presents bias to the right.
fdp for EV1 is:
3.2. Bayesian model
For a given value of q, X follows a binomial law B(n;q). The set of possible values of q can be characterized probabilistically according to a Bayesian model (Saporta 2011). The model is based on previous events which allow establishing the frequency of occurrence of q. Everything comes down to the fact that q is a variable between (0,1) that has a prior probability distribution f(q). Thus, we obtain a model that attempts to deduce q from X. Then it aims to find the posterior probability distribution of q; that is:
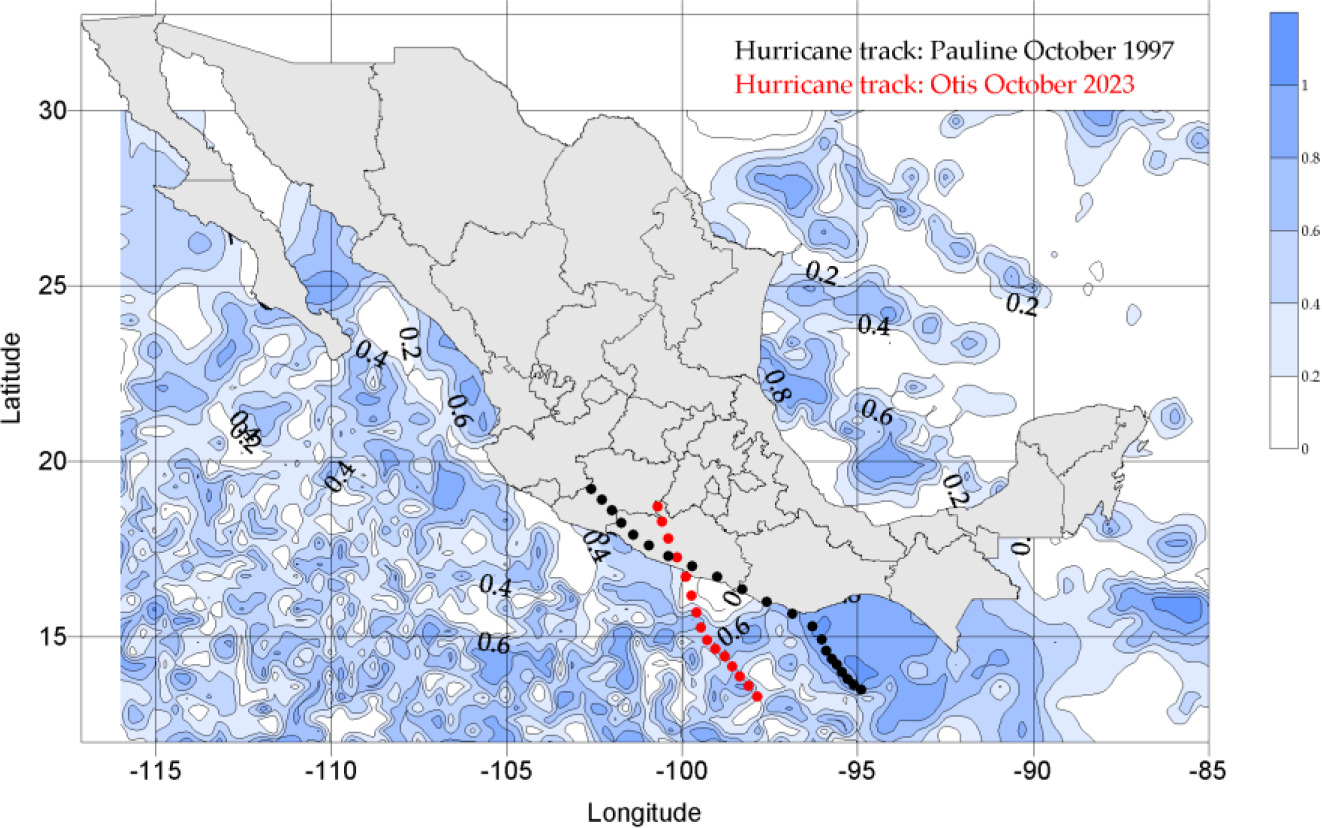
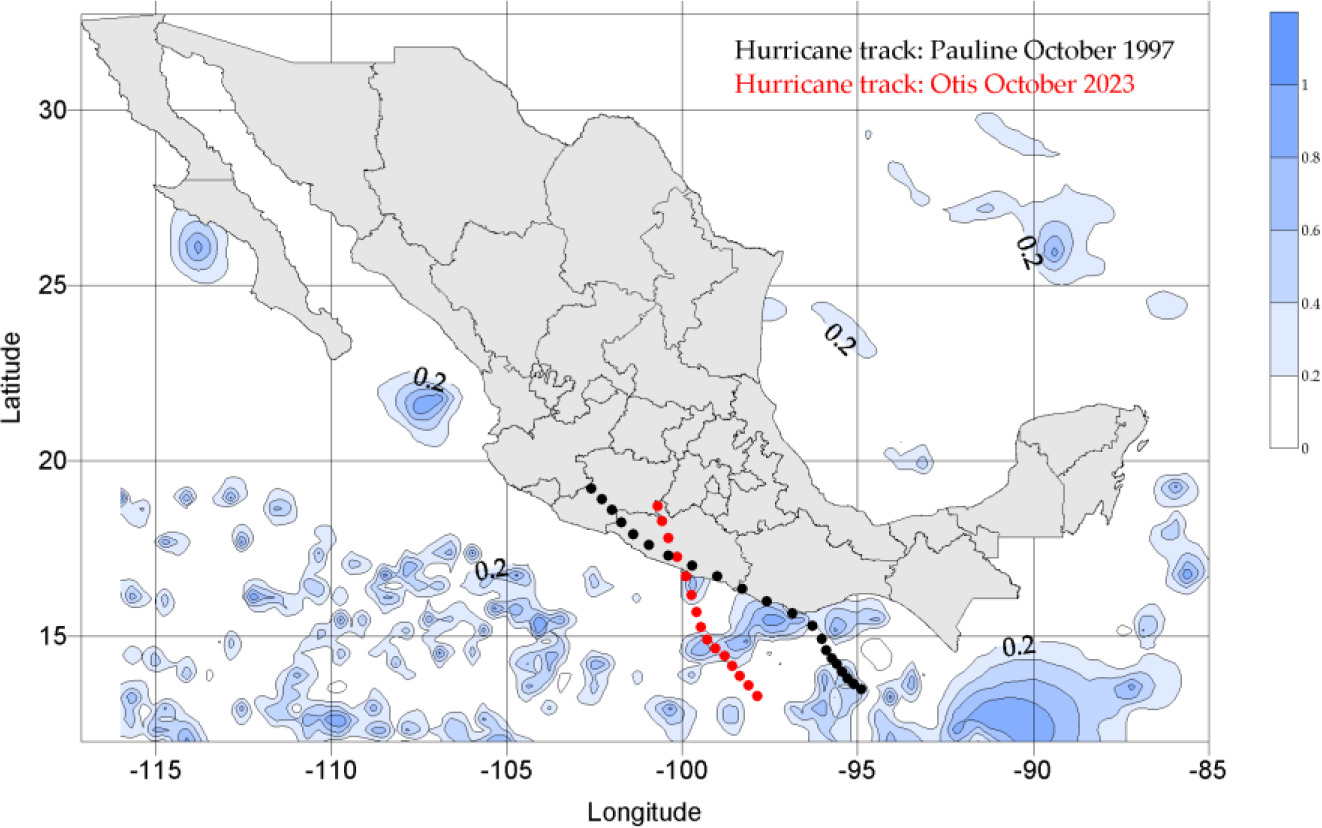
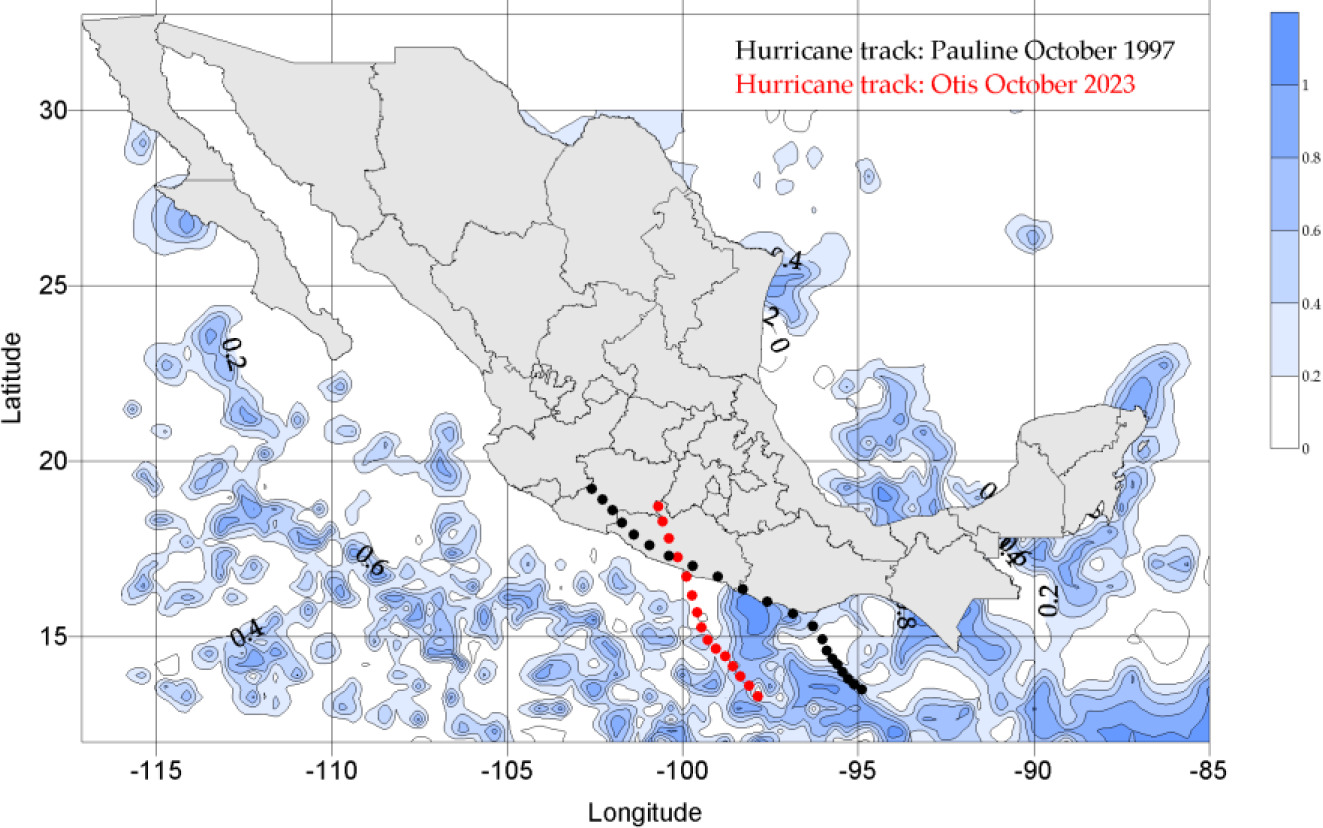
In this sense, q can be estimated by choosing either the mean posterior probable value or the extreme posterior value. Figures 4, 5, and 6 show some examples of the results of this procedure for different time lags. Fig. 4. Probability that a hurricane or tropical storm with a specific wind magnitude will happen at (latitude, longitude) given that a specific atmospheric pressure occurs (1980-1995). Fig. 5. Probability that a hurricane or tropical storm with specific wind magnitude will happen at (latitude, longitude) given that a specific atmospheric pressure occurs (2006-2013).
Fig. 4.
Probability that a hurricane or tropical storm with a specific wind magnitude will happen at (latitude, longitude) given that a specific atmospheric pressure occurs (1980-1995).
4. Damage assessment: Hurricanes Pauline [1997] and Otis [2023] in Acapulco
4.1. Hurricane Pauline [1997]
On October 8, 1997, Hurricane Pauline hit Acapulco as a Category 4 storm. It caused extreme rainfall (up to 411 mm in less than 24 hours), which led to flash floods, debris flows, and landslides. The most affected areas were hillsides and marginal urban areas. Homes built in highly vulnerable conditions collapsed in these areas. There were approximately 160 deaths and more than 260 missing persons, in addition to hundreds of injured and displaced individuals. The urban infrastructure was severely damaged. Streets were destroyed, bridges collapsed, and the water and drainage networks were rendered useless. Homes were swept away by floodwaters. The direct economic losses resulting from the disaster were estimated at $450 million, primarily affecting the housing, commercial, and tourism sectors. Hydrological studies of the La Sabana River basin demonstrate how geomorphology and land use influenced the torrential response, exacerbating the effects of the rainfall associated with Pauline (Rodríguez Esteves 2017).
Hurricane Otis [2023]
On October 25, 2023, Hurricane Otis made landfall as a Category 5 cyclone, with sustained winds of 270 km/h and gusts up to 330 km/h. It became the strongest hurricane ever recorded on the Mexican Pacific coast. Its rapid intensification was unusual: it went from a tropical storm to a Category 5 hurricane in less than 12 hours, leaving little time for preparation or evacuation. The damage ranged from severe coastal erosion (up to 76 meters on some beaches) and collapsed storm drains to the complete disruption of communication, electricity, and drinking water networks. The estimated cost of the damage ranges from $9.9 billion to $14.8 billion. This has had a severe impact on the region’s tourism economy, as well as on thousands of homes, hotels, schools, and hospitals. Post-event satellite images reveal geographical alterations along the coastline and the presence of new landslides, confirming the multi-threat nature of Otis’s impact (Ramírez-Herrera et al. 2025). However, a study by the University of California indicates that the historical loss of mangroves in Acapulco since the 1980s has contributed significantly to the area’s current vulnerability. Adequate mangrove coverage is estimated to have dampened up to 25% of the storm’s energy in low-lying coastal areas (Hook 2025).
5. Discussion
Mexico is the most affected country in the world by hurricanes and tropical storms, which can strike its two coasts simultaneously. Because of its location and atmospheric conditions, in 2013, hurricanes Ingrid and Manuel hit Mexico’s coasts at the same time. It is extremely urgent to provide a database with all the hurricanes and tropical storms that have occurred in this area (Molina-Aguilar, Gutiérrez-López 2020). The original database presents hurricane or tropical storm name, location, wind speed, and atmospheric pressure information for all events from 1851 to 2022. This information is not directly available anywhere in Mexico. Therefore, this database and its computational tool for look-up are of significant importance. The processed extreme wind and pressure data are fitted to a probability distribution of extreme value type I; the database shows the estimated values for the wind and atmospheric pressure for each of the 539 hurricanes and tropical storms analyzed. After processing the primary data, the files contain the following results: date, name, latitude, longitude, frequency in years of winds and atmospheric pressure occurrence (Leroux et al. 2018; Bieli et al. 2019), probability and frequency of extreme winds and pressure, estimated value of extreme winds and atmospheric pressure based on the extreme event model, and the probability that a hurricane or tropical storm with some wind magnitude will happen at a location where a specific pressure event occurs. The calculation of the conditional probability over the whole study area is the initial step to estimate hurricane and tropical storm tracks (Khurana et al. 2017; Heming et al. 2019).
6. Conclusions
The maps shown in Figures 4-6 provide information on the probability of a hurricane occurring with a specific wind speed and atmospheric pressure. The use of Bayesian analysis allows for the observation of vulnerable coastal zones as well as areas at sea susceptible to the occurrence of a hurricane with this combination of wind speed and atmospheric pressure. The frequency of cyclones is greater in the Mexican Pacific (1.8/year) than in the Gulf of Mexico (0.4/year). During the August-September period, when the incidence is at its highest, rainfall increases up to three to four times the normal average. The tracks of Hurricanes Otis and Pauline correspond to the maximum probability zones for these areas. To prevent damage caused by hurricanes of extraordinary intensity, it is important to explore general concepts. This work uses only two variables, but it should be complemented with data on high tide, storm-waves, precipitation, and other relevant factors. The analysis of frequencies using extreme distributions is appropriate and allows for the calculation of probabilities of occurrence.
6.1. Expected use of results
The first step in estimating cyclone tracks (Nath et al. 2015; Magnusson et al. 2019; Hon 2020) is to calculate the conditional probability over the entire study area, followed by a geostatistical analysis (variogram) of the predominant directions. With the estimated probability, it is possible to determine future tracks with a significant degree of accuracy (Nishimura, Yamaguchi 2015; Tang et al. 2021; Trošelj, Lee 2021).