1. Introduction
Water is an indispensable element in human life. Freshwater is of great importance in terms of agricultural productivity, human health, and the economic activities of a growing population. Nevertheless, many regions in the world face water shortages triggered by climate change and anthropogenic factors. Freshwater accounts for less than 3% of the total amount of water on Earth and is mainly stored in polar glaciers or underground (Chao et al. 2018). For the sustainable management of water, it is essential to assess variations in groundwater storage(Famiglietti et al. 2011; Jiao et al. 2015; Yin et al. 2020).
In many regions of the world, especially in developing countries, valuable water resources tend to decrease due to reasons such as overconsumption of groundwater or inadequate water management (Salem et al. 2017; Moghim 2020). This is also an issue in the Middle East, which is facing severe water scarcity (Voss et al. 2013; Madani 2014; Al-Zyoud et al. 2015; Forootan et al. 2016). Consequently, one of the vital problems for countries of the Middle East is how they can most efficiently use their water resources (FAO 2021). Southeastern Anatolia, through which the rivers Euphrates and Tigris flow, has a strategic importance for the Middle East region, and these rivers have always been a crucial water resource for Middle East countries. In this context, the GAP (Southeastern Anatolia Project) has been running since the beginning of the 1990s, with the aim to optimize the exploitation of the water resources of the region for hydropower and irrigation (Yılmaz et al. 2019). Water storage changes in Southeastern Anatolia will affect not only the region but also the surrounding countries.
Quantitative models and estimations regarding the temporal-spatial variations of water storage are required for an effective sustainable water resources management in this region (Joodaki et al. 2014). In this context, the Gravity Recovery and Climate Experiment (GRACE) mission can provide valuable gravity data for monitoring global/regional water resource changes (Tapley et al. 2004a; Wouters et al. 2014; Godah et al. 2018; Öztürk et al. 2018, 2020; Öztürk 2020). Trustworthy large-scale values can be obtained from GRACE, and many extensive studies about groundwater changes, using GRACE data, have been carried out in several parts of the world (Rodell et al. 2009; Tiwari et al. 2009; Voss et al. 2013; Nie et al. 2018; Hussain et al. 2021; Massoud et al. 2021; Akhtar et al. 2022; Ali et al. 2022; Wang et al. 2022; Zhang et al. 2022). Tiwari et al. (2011) stated that hydrological variations have strong effects on GRACE measurements. Also, Scanlon et al. (2012) indicated that GRACE has the unique ability to provide gravity data for the assessment of groundwater changes; the authors demonstrated the 2006-2010 drought in the California Central Valley, USA, which showed a decreasing trend in groundwater storage.
The Global Land Data Assimilation System (GLDAS) has also been widely employed for the estimation of groundwater changes (Feng et al. 2013; Huang et al. 2015; Long et al. 2016; Sahoo et al. 2021; Zhang et al. 2021; Dubey et al. 2022; Öztürk 2022; Zheng et al. 2022); it provides the hydrological status of the Earth at a 0.25° resolution (Rodell et al. 2004). In 2008, Syed et al. (2008) combined GRACE and GLDAS data to evaluate terrestrial water storage (TWS) and stated that they are consistent with each other. All these studies have shown that the TWS dataset obtained from GRACE and GLDAS can be useful for the evaluation and analysis of variations in water resources.
This study was carried out in the southeastern region of Turkey, where hydrology models and satellite gravimetry data from GRACE had not been used before for the analysis of water resource changes. The aim was to investigate the temporal and spatial features of water storage changes as well as the effects of climate change in the region. Additionally, the performances of TWS, estimated from the GLDAS, and liquid water equivalent (LWE) measurements, estimated from GRACE, were evaluated. Since insufficient observations limit hydro-climatological studies in the region, the results of this study are important in terms of the future of the resources and the influence of climatic changes.
2. Materials and methods
2.1. Study area
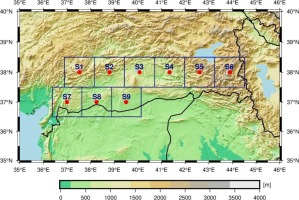
The study was performed in the southeastern region of Turkey, over latitude 36.5ºN–38.5ºN and longitude 36.3ºE–44.5ºE. The region comprises fertile plains and rugged mountains, of which the Cilo Mountain is the highest part of the study area, with a peak elevation of 4,135 m above sea level. The climate is diverse; the western parts receive more precipitation and have milder temperatures compared to the eastern parts. The eastern region is covered with a layer of snow in winter; the number of days with snow cover exceeds 80 in the provinces of Van and Hakkari in Subarea 6 (Günal 2013). The research area was divided into nine equal sub-areas, considering the centers of the mass concentrations (mascons) provided by the Goddard Space Flight Center (GSFC), as shown in Figure 1.
2.2. Data and methodology
The terrestrial water budget consists of four major components, shown in Equation 1 (Zhang et al. 2018; Moghim 2020):
Where P, G, R, ET, and ΔTWS symbolize precipitation, groundwater, runoff, evapotranspiration, and total water storage changes, respectively. We used satellite data and a hydrological model to analyze water storage changes in southeastern Anatolia. To define the relationship between LWE and climate change more clearly, time-lagged cross-correlations between LWE and climatic variables were estimated as follows:
where V shows the climatic variables (precipitation and temperature) and l is the time lag, varying from 0 to 3 months.
2.2.1. GRACE Mascon products
The GRACE satellite mission is a joint project of NASA (National Aeronautics and Space Administration) and DLR (German Aerospace Center) (Tapley et al. 2004b). The GRACE satellite mission, launched in 2002, measures the time-variable gravity field. These measured variations are exploited for the estimation of mass changes, thus water storage changes; the monthly equivalent water thickness values in a region reveal water storage variation. This research spans 156 months, from January 2003 to December 2015. The equivalent water thickness (liquid water equivalent, LWE) from GRACE mascon solutions, provided by the GSFC, consists of soil moisture, plant canopy surface water, accumulated snow, and surface and groundwater (Moghim 2020). The GSFC mascons with a 1×1 spatial resolution can capture all signals from GRACE and can be employed without further processing; they are available at GSFC (2022). Gaps in the data were filled by means of linear interpolation. Since the TWS is used for the total water storage changes obtained with the GLDAS, the total water storage changes obtained with GRACE is shown as LWE to avoid confusion.
2.2.2. GLDAS Noah Land Surface Model
The GLDAS has been jointly produced by the National Oceanic and Atmospheric Administration (NOAA) and NASA (Rodell et al. 2004). It provides 3-hourly and monthly global data, including hydrological components, heat fluxes, meteorological variables, and radiation, from 1948 onward. In this study, GLDAS-2 0.25-degree products (GLDAS_NOAH025_M) were used. Compared to previous versions, some improvements have been carried out in GLDAS-2. This version has a model version upgrade, uses modified MODIS 20-category vegetation, GTOPO30 for elevation, and Hybrid STATSGO/FAO for soil texture. In this study, GLDAS products of monthly precipitation, temperature, and terrestrial water storage, including plant canopy surface water, snow water equivalent, and soil moisture from January 2003 to December 2015, were employed. The GLDAS datasets are available at GES DISC (2022).
Terrestrial hydro-climatology data obtained from the GLDAS can be used to conveniently assess water storage variations. Terrestrial water storage (TWS) consists of all surface and groundwater; it is derived from the GLDAS can be defined as follows (Moghim 2020; Zhang et al. 2021):
where SWE is the snow water equivalent, SM is the soil moisture composed of four layers which have different depths (0-10 cm, 10-40 cm, 40-100 cm, 100-200 cm; 0-200 cm were used in this study), and PCSW represents plant canopy surface water. To assess the relationship between the LWE from GRACE and the TWS from the GLDAS, monthly anomalies (Δanom) were estimated with the following equation:
where Pmonthly reflects monthly the GLDAS and GRACE variables and Pmean is the mean value of the variables in the study period (2003-2016).
3. Results and discussion
3.1. LWE from GRACE
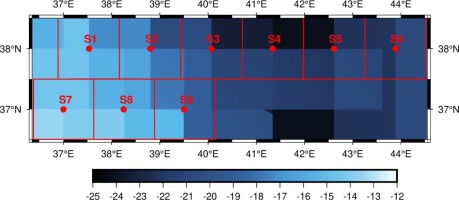
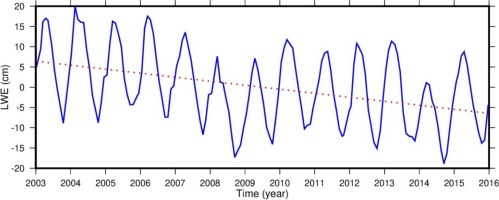
When the monthly LWE data were analyzed, the maximum change in the water storage in the region was observed for September 2014. Figure 2 illustrates the spatial variations in water storage in the southeastern region of Turkey in September 2014. The maximum decrease in water storage was recorded in Subareas 3, 4, and 5. The same subareas experienced both the most increase and decrease in mass variations in 2004 and 2014, respectively. The time series of the LWE average value for all subareas is shown in Figure 3.
Based on Figure 3, the seasonal pattern dominated the LWE time series for the study period. Between 2004 and 2014, the maximum increase in the LWE was observed in February 2004, and the maximum decrease was observed in September 2014. This result can be attributed to the precipitation over the region (Kayhan, Alan 2012). The average LWE showed a remarkable downward trend, with a decrease of ~1 cm per year. The decreasing trend in some subareas was more considerable. Particularly, Subareas 5 and 6 showed decreases of approximately 2 cm per year, revealing that in these regions, the discharge amounts are larger than the recharge amounts. The results also indicate that peak points of LWE changes for all subareas occurred in spring and autumn and are related to the precipitation pattern. These variations might be a result of the dry and rainy seasons.
Fig. 3.
Spatial average of the liquid water equivalent (LWE) in the study area (blue line) and trend of the LWE (red dots).
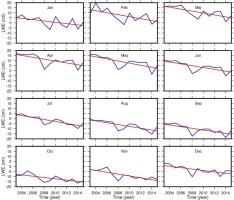
The average of the liquid water equivalent for the region was estimated for all months (Fig. 4); all months showed a downward trend, albeit at different degrees. The LWE variations showed negative values, especially in the months after July. The month with the maximum reduction ratio was February. The multi-year trend values illustrated in Figures 3 and 4 were estimated via linear regression.
3.2 TWS from GLDAS
To evaluate the TWS trend, the time series of the TWS average value for all subareas is demonstrated in Figure 5. The amounts of snow water equivalent, soil moisture, and plant canopy surface water decreased from 2003 onward. Soil moisture, affected by climate change through variations in temperature and rainfall, showed a decrease of ~15 mm per decade. High temperatures over long periods can result in increased evaporation and, consequently, decreased soil moisture. Furthermore, climate change affects precipitation types as well as the amount and frequency of precipitation, and increasing temperatures cause precipitation to fall as rain rather than snow. In the last decades, the temperature has increased, and the precipitation patterns and types have been affected, especially in growing cities (Tayanç, Toros 1997; Tayanç et al. 2009). As seen in Figure 5, the amount of the SWE showed a decrease of approximately 17 mm per decade.
Fig. 5.
Domain average of the TWS involving soil moisture (a), snow water equivalent (b), and plant canopy surface water (c).
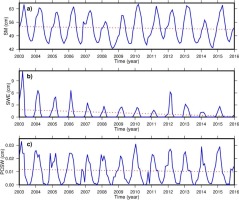
Figure 6 shows the mean LWE and TWS anomalies based on GRACE and GLDAS. The obtained results provide evidence that both data sets are consistent and highly correlated with each other (ρ = 0.87). This consistency indicates that groundwater and surface water in the region are parallel with accumulated snow, soil moisture, and plant canopy surface water during the study period. The relationship between TWS and LWE anomalies was evaluated spatially, and their cross-correlation values are given in Table 1.
Fig. 6.
Anomalies of the liquid water equivalent (LWE, blue line) and terrestrial water storage (TWS, red dashed line).
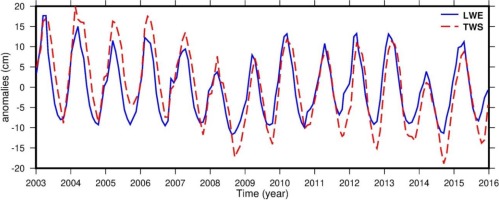
Table 1.
Correlation between terrestrial water storage (TWS) and liquid water equivalent (LWE) anomalies for all subareas.
| Subareas | Correlation value |
|---|---|
| 1 | 0.93 |
| 2 | 0.93 |
| 3 | 0.98 |
| 4 | 0.99 |
| 5 | 0.98 |
| 6 | 0.93 |
| 7 | 0.93 |
| 8 | 0.93 |
| 9 | 0.93 |
According to Table 1, both LWE and TWS anomalies were highly and positively related in all subareas, which indicates that the SM, SWE, and PCSW components of the terrestrial water storage coincide with the LWE trend and that the other components (e.g., surface and groundwater) of the LWE do not exhibit a distinct trend during the study period.
3.3. Analysis of water storage changes
Increased temperature and evaporation are results of climate change and have a direct effect on water storage. To evaluate the short- and long-term impacts of climate change, initially, the correlation between climatic variables (temperature and precipitation) and the LWE was estimated ( Table 2). The anomalies of these climatic variables used in the study were obtained by subtracting the average value from each month.
Table 2.
Correlation between the liquid water equivalent (LWE) and anomalies of temperature at 0 lag, 1-month, 2-month and 3-month lags for all subareas.
As seen in the 0 lag column in Table 2, increasing temperatures go along with a reduction in water storage in all subareas, with a negative correlation. In addition, increasing temperatures had the largest negative effect on water storage at the end of 2 months almost in all subareas. Regarding the precipitation results in Table 3, the highest relation was observed again at 2-month lags almost in all subareas. It should be mentioned that the ranges of correlation at 2-month lags was almost twice as much as that of the 0-month lag (without lag). Climatic changes affect some variables immediately and some after a certain period. For example, soil moisture can increase instantly with precipitation, whereas groundwater resources can only increase when they receive sufficient precipitation. In addition, it is crucial that precipitation accumulates as snowpack, in addition to the amount of precipitation.
Table 3.
Correlation between the liquid water equivalent (LWE) and anomalies of precipitation at 0 lag, 1-month, 2-month, and 3-month lags for all subareas.
In the research area, the highest decrease in LWE occurred in Subarea 2, which was located at the highest elevation. The two subareas with the least decrease in LWE were Subareas 8 and 9, at lower elevations (Fig. 1). These results indicate that a prolonged snow line in subareas at high elevations decreases against the background of a changing climate. Alternatively, the results verified that climate change (a downward trend in snowpack/precipitation and an upward trend in temperature) has a notable impact on water storage in the region. Besides, anthropogenic activities, mainly agriculture, urbanization, and dam construction, can also influence water storage. At the beginning of 2016, 19 dams were completed in the study region, in the framework of the GAP project. In addition, the area opened to irrigation in 2002 was 198,854 ha and increased to 474,528 ha in 2016 (GAP Administration 2016). The reverse migration and meticulous water management in the region reduced the negative consequences of human activities. However, the negative water budget in the LWE and TWS results (Figs. 2 and 6) in the region emphasizes the requirement for groundwater monitoring to achieve sustainable water management.
4. Conclusions
Today, many regions of the world are concerned about their available water supply. Human activities, growing populations, and inadequate management make access to clean water increasingly more difficult. The lack of effective and sufficient observations in countries (especially developing countries) results in improper management. In this sense, the major tasks of the satellite and hydrology model in the analysis of water storage in areas with limited observations are emphasized.
The aim of the paper is to investigate the temporal and spatial features of water storage changes along with the effects of climate change in the southeastern region of Turkey. Additionally, terrestrial water storage estimated via the GLDAS and the liquid water equivalent estimated via GRACE were evaluated. Based on these results, water storage shows a downward trend in all subareas, especially in high-elevation regions. The spatial pattern of the LWE decline follows the patterns of accumulated snow and soil moisture, which have the largest reductions from the TWS components.
Climate change and anthropogenic activities remarkably affect water resources. The results obtained here show that water storage is easily influenced by climatic variables (precipitation and temperature), both directly and indirectly. For example, increasing temperature and decreasing precipitation showed the highest correlations with water storage after 2-month lags, which indicates that the long-term effects of climatic changes need to be well defined and the time delays between the related signals need to be determined. In addition to climate change, there are notable human activities in the study region, such as irrigation, canal establishment, and construction, affecting water resources. The GAP project, which has been ongoing in the region for years, aims for sustainable development with conserving natural resources.
This study provides evidence that the GRACE satellite pair provides users with valid data even in regions where observations are limited. In addition, simulated models, such as GLDAS, provide supporting data. The obtained results also show that long-term monitoring of water storage is necessary to prevent possible water shortages in the future and to conserve natural resources. Continuous monitoring, which is a requirement of sustainable water management, is also of vital importance in terms of saving freshwater and delivering it to future generations.

