1. Introduction
Progress in satellite data quality and speed of data acquisition over the past two decades, provides new insights for application to short-term weather forecasts, as well as so-called nowcasting weather forecasts. Nowcasting supplies a detailed description of current weather conditions obtained by extrapolation for a period of 0 to 6 hours ahead. Nowcasting is especially useful in the event of storms and downpours as well as flooding, because in its typical time range it is possible to forecast small features such as individual storms. Modern advances in satellite technology in terms of high resolution, multi-spectral coverage and sampling frequency (appearance of a given satellite over the same area of Earth) are improving satellite data to high accuracy, and thus of increasing importance in weather monitoring. Satellite data are also essential for the accurate numerical weather forecasts. These trends of increasing accuracy and temporal resolution of satellite retrievals, support improved models, and more accurate forecasts, even for the most violent storms.
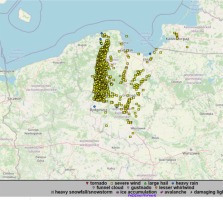
The ability of satellite data to detect and monitor the Earth’s atmosphere proved to be extremely useful during the one of the most destructive storms that was concentrated in several districts of the Pomeranian, Greater Poland, and Kuyavian-Pomeranian voivodeships on 11 August 2017. On that day, there was a humid and very hot mass of tropical air over Poland (Taszarek et al. 2019). The air temperature in the southern part of the country reached 35°C. Thermodynamic and kinematic conditions, including high wind shear, favored the development of severe storms and accompanying phenomena in the form of heavy rainfall and strong gusts of wind. In the afternoon, these storms appeared over southwest Poland, then quickly intensified and moved to the northeast in the form of a mesoscale convection system with an embedded squall line. The strongest phenomena occurred in the evening on the border of the Greater Poland, Pomeranian, and Kuyavian-Pomeranian voivodeships. The maximum wind gusts recorded that day are among the highest in the history of Polish measurements: 42 m/s in Elbląg, 36 m/s in Chrząstów, 35 m/s in Gniezno, and around 30 m/s at several other stations. The route of the most intensive wind gusts is shown on Figure 1.
In total, 5 people were killed in Poland (Dziennik Bałtycki 2018) and 39 were injured. In addition, 23 rescuers suffered minor injuries during the operation. In terms of the number of victims, the most tragic outcome was in Suszek (Pomeranian Voivodeship), where 5 people died. Storms this strong happen once every few years, but the mesoscale convection system (MCS) that occurred on 11 August, 2017 met the criteria for a derecho and was the one of the strongest storm incidents recorded recently in Poland (Wrona et al. 2022). The detailed synoptic analysis of this storm is presented in this issue of MHWM in the paper by Wrona et al. (2022).
This paper presents the evolution of the mesoscale convection system as seen on the satellite images during all the stages: pre-convection, initiation, and maturity. In Chapters 2 and 3 the satellite data and products used in the analysis are described. The evolution of the MCS on satellite images and products is shown in Chapter 4. The analysis presented in this chapter also includes satellite products that were not available at the time of the event but are now used operationally in forecasting offices, so that we could evaluate their suitability for detecting and monitoring severe convective systems.
2. Satellite images useful for convection detecting and monitoring
Data from a geostationary satellite provide indirect information on the atmosphere with high temporal resolution for almost full coverage of one of the Earth’s hemispheres. Depending on the spectral channel in which the satellite image is acquired, various types of weather phenomena and their characteristics can be detected. The analysis of all available spectral data enables the retrieval of meteorologically important information. Acquisition of satellite data in solar bands enables the estimation of optical thickness of the cloud and the water phase, but the monitoring is limited to the daytime only. Initiation and development of the severe weather phenomena regardless of the time of day can be tracked in the infrared channels that measure radiation emitted by the Earth and the atmosphere. These bands allow the estimation of cloud-top temperature, which is used as an indicator of the potential severity of thunderstorms (da Silva Neto et al. 2016). In the troposphere, the thicker and more developed the storm cloud is, the lower brightness temperature its top represents. Apart from IR single channel images, satellite derived products that either combine data from different channels or are obtained with dedicated software can be used for convection detection and monitoring. Both types of products are described below.
2.1. Color-enhanced IR brightness temperature image
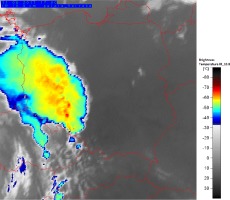
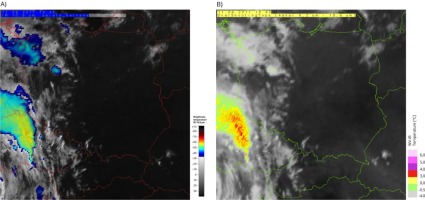
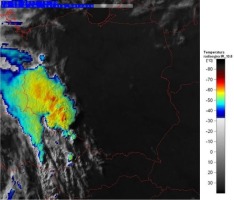
The METEOSAT SEVIRI instrument provides image data in eight IR channels, two of which (IR 10.8 μm and IR 12.0 μm) are known as IR window channels, because of relatively little absorption by the atmospheric gases in this spectral region. The two channels enable estimation of cloud top temperature, which provides crucial information for detection of highly developed clouds, including convective storms. For fast and easy recognition of the coldest parts of cloud tops, the IR 10.8 μm channel with color enhancement of cloud top temperature below –33°C is widely used. It provides information on the coldest parts of cloud tops that are often connected with deep convection occurring in the cloud (Setvak et al. 2010). The cold ring and cold U shape(s) on the convective cloud top (Fig. 2) are indicators of the possible severity of the convective cloud (Setvak et al. 2010), particularly if they are present during a longer time period.
2.2. Sandwich
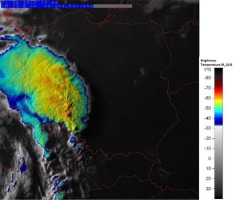
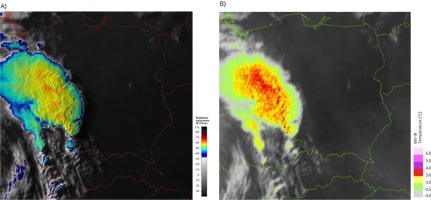
Another meteorological product providing information on convection initiation and storm tracking is METEOSAT SEVIRI “Sandwich” Product. It consists of two layers: a black and white visible channel image (in this case HRV 0.4-1.1 µm) and a color-enhanced IR Brightness Temperature image. With their high spatial resolution, the background images provide information on cloud top spatial structure, while the overlaid IR images are used to monitor cloud top temperature distribution. Therefore cloud top features indicating the cloud severity, such as cold rings, cold U, gravity waves, and above-anvil ice plumes can be much more easily detected. These features can be seen in Figure 3. The main limitation of the Sandwich product is its availability only during the daytime.
Both color enhanced IR and Sandwich images are useful in detecting and monitoring the cloud top features. Storms exhibiting cold rings belong to a category of storms whose tops exhibit some form of cold/warm couplets that are connected with overshooting tops. Under favorable conditions almost every major overshooting top generates a downwind counterpart, a warm spot of varying horizontal extent, with brightness temperature difference from the surrounding anvil, and duration (Setvak et al. 2010). The occurrence of warm spots downwind of the individual overshooting tops is supported by some specific air mass types and wind shear, therefore these features are not observed in every convective cloud (Setvak et al. 2010). In the works by Schlesinger (1984, 1988), Heymsfield and Blackmer (1988), and Heymsfield et al. (1991) the close link between storm severity and cold rings, or cold U/V-shapes with a duration of 40-45 minutes, was indicated.
2.3. The water vapor (6.2 µm) channel image
The images in the 6.2 μm channel may indicate the development of convection over the area. The 6.2 μm images show the distribution of the water vapor concentration in the upper tropospheric column (in shades of grey) as well as clouds with high tops. Water vapor in the atmosphere plays a key role in storm formation. While the typical storm clouds are the real generators of static charge found in the atmosphere, their ability to hold massive amounts of electrical energy is related to the amount of water vapor present in the local area’s air column (Schadowitz 1988).
Apart from detection of a pre-convectional environment, 6.2 μm images also can be used for monitoring highly-developed convection cells that are white on images in the grey scale.
2.4. The BTD product
As above, thunderstorms are clearly detectable on satellite maps showing the distribution of water vapor. The Brightness Temperature Difference (BDT) product, which shows differences in the brightness temperature between the 6.2 μm and 10.8 μm channels is dedicated to early recognition of rapidly developing storms.
In the case of vertically developed clouds, the radiation at the top of the atmosphere can be considered as the radiation at the cloud top, from the stratosphere. One of the main characteristics of the stratosphere is the increase of temperature with altitude. The increase is more pronounced in the absorption bands. The actual difference between the brightness temperatures depends on the actual height of the cloud top and on the amount of stratospheric water vapor (Schmetz et al. 1997). Difference values greater than 0 indicate areas in clouds where strong updrafts occur, leading to a strong uplift of the cloud tops and the overshooting tops phenomenon (Setvak et al. 2007; Bedka et al. 2010; da Silva Neto et al. 2016). These tops can reach the tropopause and even extend into the stratosphere. Such areas are very often associated with violent phenomena such as heavy rainfall, wind gusts, hailstorms, or even tornados (Bedka et al. 2010; Setvak et al. 2010).
3. Level 2 satellite products
The level 2 products used in this analysis were derived using the NWC/GEO software package delivered by the EUMETSAT Satellite Application Facility in support of nowcasting and very short-range forecasting (NWC-SAF). Its main objective is to provide meteorological products which have application to nowcasting. It allows calculation of meteorological products related to clouds and their physical properties, precipitation, convection initiation, wind, clear air turbulence, and instability indices. Besides the satellite data, the NWC-SAF software uses numerical weather prediction (NWP) model fields. As the current operational version of the NWC/GEO software was created in 2018, i.e., after the 11 August 2017 storm, the products presented hereafter were obtained with an off-line run of the software with archived satellite and NWP model data.
3.1. Layer precipitable water products
Whereas the satellite data in the 6.2 µm channel provide information on the water vapor content in the upper troposphere, the Layer Precipitable Water product gives information about the amount of precipitable water in three discrete layers of the atmosphere: the boundary layer, from the surface to 850 hPa; the medium layer, from 850 hPa to 500 hPa; and the high layer: from 500 hPa to the top of the atmosphere. The moisture content in the lower and middle layers is an indicator of favorable conditions for convective activity (Murugavel et al. 2017). The parameters characterizing tropospheric moisture can be obtained with the NWC SAF Geo package for cloud free areas only.
3.2. Stability indices
Satellite data not only makes it possible to observe phenomena occurring in the atmosphere and on the land at any given moment. If used properly, they can also provide useful information for storm nowcasting.
A good example are the stability indices derived from METEOSAT satellite data for cloud free areas: K Index (KI), L Index (LI) and Showalter Index (SI).
The K Index (George's Index) is a measure of thunderstorm potential based on the vertical temperature lapse rate, and the amount and vertical extent of low-level moisture in the atmosphere. When less than 20°C, KI indicates no storm probability, if 20°C to 25°C – isolated storm cells only, 26°C to 30°C – widely scattered thunderstorms, 31°C to 35°C – scattered storms, and finally more than 35°C – numerous thunderstorms (George 1960). The K Index integrates measurements of vertical temperature lapse rate, moisture content of the lower atmosphere, and vertical extent of the moist layer, and thus, may be useful for identifying convective and heavy-rain-producing environments. The K Index is a useful tool for diagnosing the potential for convection. However, it cannot be used to infer the severity of convection. Because it uses 850 hPa data, it is not applicable in mountainous regions, in which the surface pressure is less than 850 hPa.
The Lifted Index is another common measure of tropospheric instability. It is defined as the difference between the air temperature at a given level of the troposphere and the temperature of an air parcel raised from the Earth's surface (or the lower troposphere) up to the same level of the air mass. It is calculated using the following equation:
Where T500 is the air temperature at 500 hPa and TLs is temperature of an air parcel lifted form the surface to the 500 hPa level. The LI presented in this paper was calculated assuming that the air parcel was lifted form the lowest layer of 100 hPa height. The more negative the LI values, the greater the possibility of strong convection. Thus, negative LI values indicate that the atmosphere is unstable, and convection may occur. The lower the LI values, the greater the chances of convection and the development of violent updrafts (Blanchard 1998).
The Showalter Index is another measure of thunderstorm potential and severity. It is given by:
where TL is the temperature (°C) of a parcel lifted from 850 to 500 hPa. As the SI decreases to zero and below, the likelihood of showers and thunderstorms is considered to increase (Showalter 1953). SI indicates mid-tropospheric instability, while LI usually indicates instability of the lower troposphere (depending on the level the virtual air parcel is lifted from). SI is especially useful when a shallow, cool layer of air below 850 hPa lies beneath air of greater convective potential (Showalter 1953). Threshold SI for thunderstorms vary, but showers and thunderstorms become more likely as the value of SI is less than –4°C (Huschke 1959). A Showalter Index greater than 0°C implies a generally stable atmosphere, with weak convection possible for SI equal to 1°-2°C, but only if strong air lifting is present. When SI is in the range of –3° to 0°C, the air is moderately unstable. If SI is between –4° and –6°C, the atmosphere is very unstable, and an SI less than –6°C means extreme instability, thus indicating a high probability of severe storms.
3.3. Rapidly developing thunderstorm – convection warning
The NWC SAF product developed for monitoring storms is Rapidly Developing Thunderstorm – Convection Warning (RDT-CW) (Moisselin, Autones 2020). RDT-CW is used for identification, monitoring, and tracking of intense convective clouds and detection of rapidly developing convective cells as well as forecasting (nowcasting) them. The object-oriented approach underlying the RDT-CW product allows one to add value to the satellite image by characterizing these convective entities through various parameters of interest to the forecaster such as motion vector, cooling and expansion rate, or cloud top height. These features make this particular product a valuable tool for both forecasters and research teams, or even aeronautical uses. RDT-CW was developed by Meteo-France in the framework of the EUMETSAT SAF in support of modern nowcasting, and uses mainly the geostationary satellite system.
4. The storm of 11 August 2017 in satellite images and products
Satellite data provide information about the state of the atmosphere and land over an area, limited only by orbit type and instrument technical design. The SEVIRI instrument aboard EUMETSAT METEOSAT satellite provides data from all of Europe with temporal resolution of 15 minutes for normal scanning mode and 5 minutes for rapid scan mode (RSS). These features make METEOSAT/SEVIRI data and products extremely useful either for detection of potentially dangerous meteorological phenomena before they reach the area of interest, or for defining the regions with conditions favorable for developing severe convective storms.
On 11 August 2017, rapid development of a convective system was observed. In the afternoon, the system started to grow in Czech territory and began to move over the southeastern part of Poland. A few hours later, the convective cells transformed into a mature system covering a vast area of the country. Late in the evening the convective system started to shift towards the north. All these phases were clearly seen on the satellite data and products. The lifecycle of this MCS is presented below using METEOSAT/SEVIRI satellite data and products.
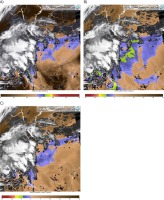
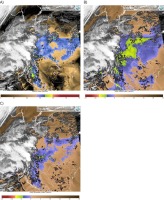
In the morning hours of 11 August, 2017, stability indicators derived from satellite data over the cloud free area indicated the presence of a convection-favorable environment over Poland (Fig. 4). In each image, shades of brown mark the regions with stable atmosphere, while blue, green, and red indicate the presence of unstable conditions. One can easily notice the areas of unstable atmosphere over southeastern and eastern Poland at 09:00 UTC. The KI values in these regions were in the range of 28-34°C, while LI and SI were negative. Unstable conditions were also noted over central Poland, with KI and LI values of 28-34°C and <0°C, respectively (Fig. 4a). The western part of Poland is covered by clouds, so it is not possible to retrieve stability indices but adjacent to the cloud cover KI and LI indicated unstable air.
Fig. 4.
Stability indices derived from METEOSAT/SEVIRI satellite data for cloud free areas with the EUMETSAT NWC SAF Geo package, 11 August 2017, 09:00 UTC: a) KI, b)LI and c) SI.
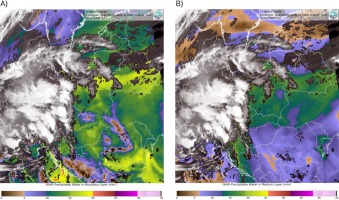
Moreover, high values of satellite-derived precipitable water content in the boundary and medium tropospheric layers were found over almost the entire cloud-free region of Poland (Fig. 5a-b). The highest values of the precipitable water content in the boundary layer were found over northern and northeastern Poland, (Fig. 5a), i.e. in the regions with unstable atmosphere (Fig. 4a-c), indicating convection-favorable conditions over these areas of Poland. Unfortunately, cloudiness precluded clear analysis in this region.
Fig. 5.
Precipitable water content in a) the boundary and b) medium tropospheric layers derived from METEOSAT/SEVIRI satellite data for cloud free areas with the EUMETSAT NWC SAF Geo package, 11 August 2017, 09:00 UTC.
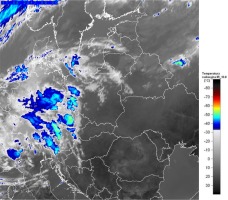
At same time, a few scattered clouds with reasonably cold tops (TB around –50°C) were observed over Germany and western Poland (Fig. 6).
Fig. 6.
METEOSAT/SEVIRI color-enhanced IR brightness temperature image, 11th of August 2017, 09:00 UTC.
At 12:00 UTC, two convective systems can be seen on the Sandwich image (Fig. 7): the weaker one over western Poland and the more active one over the Czech Republic (Fig. 8).
At the same time, the growing instability was observed over cloud-free regions of Poland. The KI and LI values, respectively in the range of 28-40°C and –4 to –8°C , indicated unstable atmosphere over all of cloud-free Poland (Fig. 9a-b), while SI was negative over southern Poland, except for the eastern part of Podkarpackie voivodeship (Fig. 9c). It should be pointed out that the most unstable conditions were found over the southeastern part of cloud-free Poland with KI of 40°C, LI of –8°C and SI of –7°C (Fig. 9a-c). Such values of these indices, along with high values of total precipitable water content (around 40 mm, Fig. 8) indicated high probability of severe storms in these regions. As will be shown, no convective system developed there, demonstrating that satellite products can be used to recognize regions with the necessary conditions (precipitable water content, stability indices), which, however, may not be sufficient to induce convection.
Fig. 8.
Total precipitable water content derived from METEOSAT/SEVIRI satellite data with the EUMETSAT NWC SAF Geo package, 11 August 2017, 12:00 UTC.
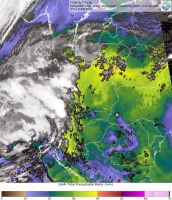
Fig. 9.
Stability indices: a) KI, b)LI and c)SI derived from METEOSAT/SEVIRI satellite data with the EUMETSAT NWC SAF Geo package, 11 August 2017, 12:00 UTC.
At 13:45 UTC, the convective system from the Czech Republic reached the southwest border of Poland. The convective system over Poland, seen in Figure 6, has moved north, and its intensity, as deduced from the Sandwich and BTD images that hour, weakened: the cloud top temperature warmed, and BDT values decreased. (Fig. 10a-b). However, the main, most powerful storm cell (from the Czech area) was yet to arrive over this area.
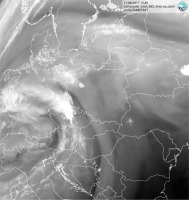
Useful information about the atmospheric state can be also brought by the water vapor images. As mentioned in Chapter 2, the 6.2 μm images represent the water vapor concentration in the upper tropospheric column. The more water vapor, the less radiation is measured by the satellite instrument so that the area with the moist air in the upper troposphere appears colder (marked with light shades of grey) on the 6.2 μm images than the area with dry air. These light areas on the images are associated with mid- to upper-tropospheric ascent, and dark areas with descent (Georgiev, Kozinarova 2009; Georgiev et al. 2016). Therefore, synoptic-scale boundaries between light and dark regions are related to significant upper-level flow features, one of which is the jet stream characterized by a strong dark/light gradient on the 6.2 μm image, with dry air on the polar side (Georgiev, Kozinarova 2009; Georgiev et al. 2016). At the 13:45 UTC, the 6.2 μm image showed several jet streams, among them the one running from southern Italy through Slovenia, Hungary, Slovakia, the Czech Republic, and ending in southwestern Poland (Fig. 11). The presence of convection in the left exit area of the jet stream (the area on the border of Poland, Czech Republic, and Germany) should be also pointed out here (Fig. 11).
Fig. 11.
METEOSAT/SEVIRI WV 6.2 µm channel image, 11 August 2017, 13:45 UTC. Moist air is indicated with light grey, and dry air with black. Highly developed cloudiness is white.
At early afternoon (14:30 UTC), this jet stream was crossing the foot of the Sudety Mountains and new convection cells were formed over this area. In the following hours, these new convection cells continued to develop (Fig. 12). Moreover, the convection system from above the Czech Republic was recognized as developing convection, which can easily be seen on Figure 13, representing the Rapid Developing Thunderstorms product.
Fig. 12.
METEOSAT/SEVIRI WV 6.2 µm channel images showing the convection intensification at 11 August 2017 early afternoon: 14:30 UTC (upper left) 15:00 UTC (upper right), 15:30 UTC (lower left) and 16:00 UTC (lower right).
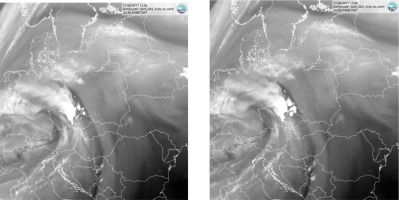
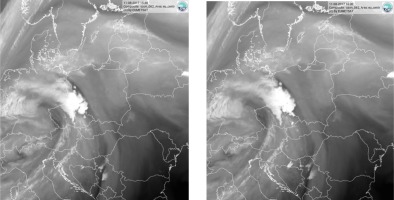
Fig. 13.
RDT product derived from METEOSAT/SEVIRI satellite data with the EUMETSAT NWC SAF Geo package, 11 August 2017, 14:30 UTC. The color of the contour marks the convection phases: yellow = triggering, orange = triggering from split, red = growing, purple = maturity and blue = decaying.
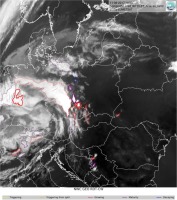
In the images from 15:30 UTC and 16:00 UTC (Fig, 11), the merging of the convective system with the newly developed convective cells into one larger entity can be observed over southwestern Poland.
The Sandwich image from 16:00 UTC (Fig. 14) shows the mesoscale convection system that formed over Lower Silesia and Greater Poland Provinces. The small-scale structures as well as the indicators of the updrafts in the clouds can be observed in this image.
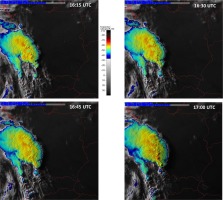
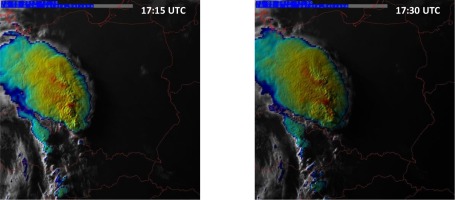
The evolution of the convective system during the succeeding hours is shown in Figure 15. The analysis of the cloud top features shows the appearance of the small cold ring (in red) at 16:15 UTC. It also can be seen in all images from the period of 16:30 UTC to 17:30 UTC (Fig. 15). The presence of a long-lived cold ring or cold U feature (more than about 45 minutes) is an indicator of possible severity.
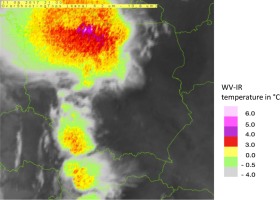
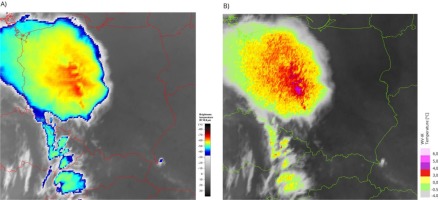
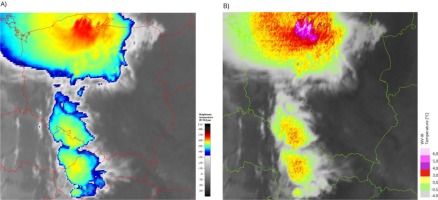
From the images in Figure 15, it can be seen that the cold ring varied in shape and size during the time period but the fact that it was present all the time indicates that monitored convective system was very active. The central warm spots were created downwind from the overshooting, which can be evaluated by comparing the location of the warm spots in the Sandwich product (Fig. 16, 16:45 UTC). The largest values of the WV-IR brightness temperature difference (BTD) were on the order of 4. As indicated by Setvak et al. (2007) and da Silva Neto et al. (2016), values of this difference of the order of 4-6°C are extremely rare over central Europe and they are good indicators of overshooting above the coldest cloud tops.
The presence and especially the duration of a cold ring in the 11 August 2017 convective system indicated the possible severity of the system and hence the possibility of dangerous weather phenomena, such as heavy rainfall, gusts of wind, or hail.
At and after 18:45 UTC, satellite data indicated further development of the convective system, where BTD values of 4-5°C (Fig. 16b) might indicate the presence of strong updrafts. The presence of a cold ring should be pointed out as well (Fig. 17a).
Fig. 17.
METEOSAT/SEVIRI color-enhanced IR brightness temperature image (a) and BTD image (b), 11 August 2017, 18:45 UTC.
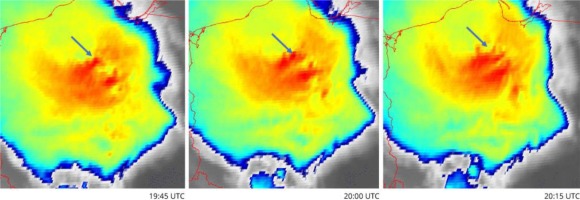
According to the RDT product, the convective system reached maturity at 19:00 UTC (Fig. 18). It remained active, with the presence of a cold U shape (indicated by the blue arrow on Fig. 19) and smaller cold rings, resulting in overshooting tops during the next hour, which can be deduced from BDT images (Fig. 20).
Fig. 18.
RDT product derived from METEOSAT/SEVIRI satellite data with the EUMETSAT NWC SAF Geo package, 11 August 2017, 19:00. The color of the contour marks the convection phases: yellow = triggering, orange = triggering from split, red = growing, purple = maturity and blue = decaying.
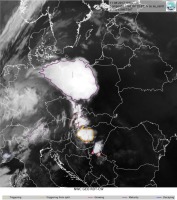
The strongest wind gust occurred after 20:30 UTC over the area marked with the blue arrow on Fig. 19. Of course, SEVIRI satellite data do not support wind gust recognition, but its presence is well documented in Wrona et al. (2022).
As most of the damages caused by the convective system occurred between 19:00 UTC and 21:00 UTC, the sequence of color-enhanced IR images is presented in Figure 21, showing the evolution of the system in its mature and most dangerous phase.
Fig. 21.
Time series of METEOSAT/SEVIRI color-enhanced IR brightness temperature images from 19:00 UTC to 21:00 UTC, 11 August 2017.
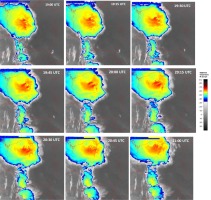
The cold ring is present in the images from 19:00 UTC and 19:15 UTC, after which it transformed into a cold-U shape with a large area of overshooting tops in its southern and southeastern parts. These features can be seen in the satellite images from 19:30 UTC to 20:00 UTC (Fig. 21). The transformation from cold-U shape into a cold ring structure again seemed to begin around 20:30 UTC, however, the temperature distribution along the ring was not homogenous and a distinctive minimum can be seen in its northwestern part. This complicated structure should be considered as the results of the interaction between single overshooting tops located close to each other. Actually, one could conclude that the ring is composed of two parts: the warmer one in the north and the colder one in the south, with small structures in the western part. These structures, marked with violet color, are also clearly seen on the BDT imagery from 21:00 UTC (Fig. 22). The mechanisms that caused the changes in the cold shapes at the convective system top cannot be recognized on the basis of the satellite images only, but require comprehensive analysis with other data, such as radar and NWP.
At 21:30 UTC, a strong updraft, manifested in low BT (Fig. 23a) and high positive BTD values (Fig. 23b) was still visible over a large area, as well as the two-part cold ring (Fig. 23a). As previously, the coldest parts of the ring match the highest BTD values. Unfortunately, the BTD product is generated for the Polish domain only, therefore, the BTD values were not available for the whole cold ring structure as the convective system moved towards Scandinavia.
Fig. 23.
METEOSAT/SEVIRI color-enhanced IR brightness temperature image (a) and BTD image (b), 11 August 2017, 21:30 UTC.
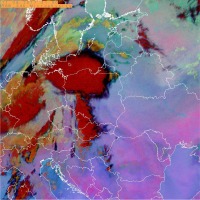
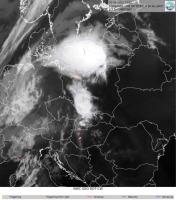
The other product that can be used to monitor the storm is the RGB Microphysics 24H (24-hour). On this product, light blue and light purple areas indicate cloudless areas, while dark red colors correspond to optically thick clouds with ice crystals in their upper layer (so-called ice phase). They might be strongly developed anvils and/or storm pyrocumulonimbus. Black and navy-blue indicate thin cirrus, like the edge of an anvil. Such fragments of extensive storm clouds propagate mainly in front of the storm cell itself, thus giving us valuable information about its movement and area.
The RGB Microphysics 24 h at 21:30 UTS is shown in Fig. 24. The convection system (dark red) covering the area of about 1/3 of Poland, with the anvil in black are easily seen. The black part (appearing as a contour), indicating thin cirrus clouds, extends for about 100 km north, east, and south. This indicates the presence of strong updraft in this mesoscale convection system.
During the next few hours, the mesoscale convection system headed to the northeast, leaving Poland about midnight (Fig. 25). The RDT product from 23:00 UTC (Fig. 26) shows the storm decay.
Fig. 25.
METEOSAT/SEVIRI color-enhanced IR brightness temperature images at 22:00 UTC, 23:00 UTC and 23:45 UTC on the 11 August 2017 (EUMETSAT 2017).
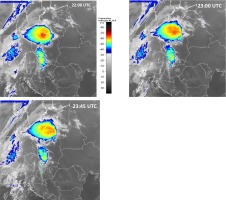
Fig. 26.
RDT product derived from METEOSAT/SEVIRI satellite data with the EUMETSAT NWC SAF Geo package, 11 August 2017, 23:00 UTC. The color of the contour lines marks the convection phases The color of the contour marks the convection phases: yellow = triggering, orange = triggering from split, red = growing, purple = maturity and blue = decaying.
5. Summary
This paper shows how satellite data and products can help in nowcasting by detecting and monitoring convective phenomena. Chapter 4 presents the series of satellite images and products showing the storm system developing beyond and over Poland. Taking into account the presently available satellite products allowed us to make this analysis useful for present satellite data users.
The satellite data and products were used to analyze the pre-convective environment in the cloud-free areas over Poland in the morning and noon of 11 August 2017. Both the atmospheric stability indices and precipitable water contents indicated southeastern and northeastern Poland as the regions where convection could develop. However, the convective systems, including MCS, developed over western Poland. This region was covered by clouds in the morning that day so there were no stability nor humidity products derived from satellite data available for analysis. On the other hand, this example shows that satellite products describing a pre-convective environment can be used to recognize the regions with necessary conditions (precipitable water content, stability indices), which may not be sufficient to induce convection.
In the cloudy area of western Poland, the satellite images and products were used to detect and monitor the convective clouds in order to detect the rapidly developing storm. It has been shown that features indicating strong convective development, like cold rings or cold U/V shapes, can be visible on the single channel satellite images, only enhanced by a color palette, without referring to specific convective products. Moreover, satellite data can be used to detect and monitor potentially dangerous weather phenomena, like severe convective systems, before they cross the Polish borders – an added value of satellite data compared to other data sources like radars or ground stations.
A broader and simultaneous look at all the images and products mentioned in Chapter 4 can allow meteorologists to detect and monitor potentially dangerous convection clouds or a system forming over a given area. So, it is worth comparing or even superimposing multiple satellite maps (products) in real time to differentiate among them. In this case, the possible redundancy of the information is much less dangerous than the exclusion of given products from the overall analysis. On the other hand, parameters such as wind shear or wind gust cannot be retrieved from satellite data. Similarly, it is not possible to retrieve any information about the meteorological conditions under the clouds. So the satellite data should be analyzed together with data from other sources, such as radars, ground stations, and NWP. However, the satellite images and products can be used to detect the rapidly developing convective clouds that should be monitored for purposes of nowcasting and warning.

