1. Introduction
Water scarcity prevails over West Africa during the dry season due to lack of rainfall, because rainfall is the major resource for replenishing the ground water. The state of water availability affects all the sectors which are highly dependent on water, namely agriculture, industry, and households (Van Beek et al. 2011; Byeon 2014). Besides lack of rainfall, other factors such as variability and changes in climate, urbanization, and population growth have the potential to further intensify water scarcity, especially during the dry season (Short et al. 2012; Mikovits et al. 2014, 2017; Zeisl et al. 2018). The importance of water has drawn the attention of climate scientists to the water budget of regions under warming climate (North et al. 1995; Friesen et al. 2005; Becker et al. 2011). Local and regional area share the impacts of global warming (North et al. 1995; Becker et al. 2011), in particular, its impact on the water budget of such regions (Friesen et al. 2005). Water availability varies over space and time (Postel et al. 1996), so annual assessments of water availability will underestimate water stress, because periods with surpluses and deficits of water will tend to cancel out. Likewise, global averages of water availability may misrepresent the real situation of water availability in some local areas or regions where there might be water surpluses or deficits (Meigh et al. 1999). These considerations necessitate assessment of water availability for small areas and short time scales; these analyses have been conducted for West Africa. Anyadike (1992) used moisture regimes to delineate hydrological regions over West Africa, while Arnault et al. (2016) studied the process of precipitation recycling over the West African region using Weather Research and Forecasting (WRF). In the same vein, Diallo et al. (2014) used version 4 of the Regional Climate Model (RegCM4) to study the water budget over the West African monsoon region using various lateral boundary conditions. In addition, Meynadier et al. (2010) analysed the water budget over West Africa, while Friesen et al. (2005) analysed the water budget over the Volta basin in West Africa. Over a still smaller area, Ledger (1975) analysed the water budget of exceptionally wet areas of Sierra Leone.
Changes in greenhouse gas (GHG) emissions have been blamed for most of the changes in the climate of all regions and the globe (Zhuang et al. 2007). Understanding of the influence of doubled CO2 emission on water surplus or deficit of any area will inform policy on proper adaptation strategies against the inevitable changes. The influence of increasing GHG concentrations on the local water budget over West Africa has not been studied using regional climate models (RCM). Adeniyi et al. (2019) reported the spatial variation of changes in precipitation, temperature, and wind as a result of changes in the levels of GHG in the atmosphere resulting from 1.5°C ocean and atmosphere warming. The study did not consider water budgets over West Africa. Diallo et al. (2014) also did not consider the influence of CO2 increases under global warming. It is necessary to study the water budget over West Africa with its components such as evapotranspiration, precipitation, runoff, and storage under GHG concentration increase (warming) using an RCM. This paper aims at simulating the response of the water budget components to doubled CO2 (2×378 ppm) under 2°C ocean and atmosphere warming over West Africa using RegCM4.7.
2. Model Set-Up
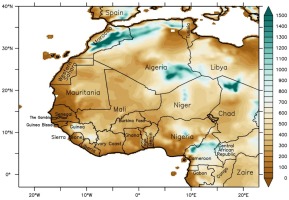
The hydrostatic core in version 4.7 of the RegCM (RegCM4.7) of the International Center for Theoretical Physics is used in this study. Control and doubled CO2 experiments with two repetitions each were done to investigate the influence of doubled CO2 on water balance over West Africa. The reference CO2 concentration in the control simulations is 378 ppm, while it is 378×2 = 756 ppm in the CO2 doubling experiment. Giorgi et al. (2012) give the detailed description of the RegCM4 model. The two sets of experiments used the same set of model physics and parameterizations. The simulations were done on 20 km × 20 km grids with a total of 250 × 250 = 62,500 grid points and 23 vertical levels (sigma coordinates) over West Africa. The domain is centred on longitude 0°E and latitude 20°N (Fig. 1). The domain cartographic projection, model physics, parameterization schemes, and data used in this study are listed in Table 1.
The schemes used for radiation, lateral boundary condition, boundary layer, explicit moisture, ocean flux, and pressure gradient flux in this study are in line with Adeniyi (2017). Adeniyi (2019b) reported good performance of cumulus parameterization schemes by Tiedtke (Tiedtke 1996) and Kain-Fritch (Kain, Fritsch 1990) over West Africa.
Table 1.
Model set up, parameterizations and data.
3. Data and methodology
3.1. Evaluation data
The performance of RegCM4.7 in simulating the water budget components over West Africa is evaluated using precipitation, runoff, evapotranspiration, and storage from ERA5 reanalysis data1 on 25 km × 25 km grids. In addition, simulated precipitation and potential evapotranspiration are evaluated using observed gridded precipitation and potential evapotranspiration from Climate Research Unit (CRU) 4.02 time series, respectively (Harris et al. 2014). The CRU data are station data interpolated on a 0.5 × 0.5 degrees grid. These data are re-gridded to the same grid (0.18 × 0.18 degrees grid) with the simulations before comparison.
3.2. Water budget
The water budget equation used in this study is adapted from Healy et al. (2007). It is given as equation (1a, b):
where: PRE is precipitation, RO is runoff, EVA is evapotranspiration and ΔS is change in storage. The water budget components are direct output of RCMs except ΔS. The water budget equation equates the inflow and outflow of water in a particular location at a particular period. Precipitation is the main inflow (input) in equation 1. Evapotranspiration is the amount of moisture loss into the atmosphere through evaporation and transpiration from the soils, surface-water bodies, and plants. Runoff is the total flow of water out of the location and change in storage is the additional water added or removed from the soil water storage to balance equation 1a. Equation 1a does not always achieve closure, this is achieved by in_raduce_g the change in storage term in equation 1b.
Required water for evapotranspiration is calculated by subtracting the actual evapotranspiration from potential evapotranspiration (Adeniyi 2019a). Potential evapotranspiration is the amount of evapotranspiration that would occur if a sufficient water source were available. The required water for evapotranspiration indicates the amount of water required to make up for the potential evapotranspiration in form of irrigation. Evaluation of simulated water budget components is carried out during the summer (June-September, JJAS), which is the period of precipitation over the whole of West Africa. Changes in the water budget components are also considered during summer. In addition, intra-annual consideration of changes in water budget components is done at some locations for further investigation.
Climate models generally represent reality imperfectly and are bound to have biases because of the assumptions they make in simulating atmospheric phenomena. Each model has internal variability which is a source of uncertainty. There is also model uncertainty, which can be as a result of structural deficiencies and parameterization errors in the model. The boundary conditions data used for simulations can also in_raduce errors into the simulations (Kerkhoff et al. 2014). Bias corrections are usually done to remove model uncertainties. These are mainly based on two assumptions: constant bias and constant relation (Kerkhoff et al. 2014). It is well documented that biases cancel out when changes are calculated as scenario minus control (Buser et al. 2009; Liu et al. 2014) with the assumption of constant bias. With constant relation also, biases cancel out when percentage change is calculated as follows:
Equations (2) and (3) represent the correction of control (CTRL) and doubled CO2 experiments using a correction factor CF.
The simulated difference between CTRL and CO2 experiments is given by the equation:
Percentage difference/change based on corrected simulations is given by the equation:
Similarly, percentage difference/change based on uncorrected simulations is given by the equation:
The two percentage differences are the same (equations 5 and 6 are equal since the correction factor cancels out), so it does not matter if the simulation output is corrected or not once percentage difference is used (Funk et al. 2012).
4. Results and discussion
4.1. Evaluation of simulated water budget components
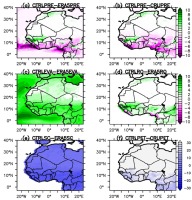
Figure 2 shows the comparison of the simulated water budget components (precipitation, runoff, storage, and evapotranspiration) with CRU observations and ERA5 reanalysis. The model underestimates the ERA5 precipitation (Fig. 2a) for the ocean and coastal Sierra Leone, Nigeria, and Liberia, while it overestimates precipitation for the mountains and highlands (Central Nigeria, Central Cameroon, and Guinea). The dry bias over the ocean is typical of simulations carried out using Era Interim initial and lateral boundary conditions (Tamoffo et al. 2019). A similar dry bias was found in Rossby Centre Regional Atmospheric Climate Model (RCA4) simulations, which used Era Interim initial and boundary conditions (Tamoffo et al. 2019). Other areas have low bias, approaching 0 mm•day-1. Similar bias exists in the simulated precipitation with respect to CRU4.02 precipitation (Fig. 2b). The ERA5 evapotranspiration is overestimated by the model for the southern countries (south of 20°N), ocean, highlands, and mountains (Fig. 2c); bias is low for the northern land area (north of 20°N) of the simulation domain. Runoff is overestimated for the highlands and mountains with reference to ERA5 data, similar to the bias in simulated precipitation. However, the bias is higher in runoff than in precipitation. Very low bias exists in simulated runoff for the northern part (15-30°N) of the simulation domain (Fig. 2d). The water storage component is generally underestimated with low bias (–5 to 0 mm•day-1) and isolated higher underestimation (–10 mm•day-1) south of 15°N. Little or no bias in storage change exists north of 15°N (Fig. 2e). The CRU potential evapotranspiration is overestimated by RegCM4.7, largely in the northern area (north of 15°N) of the simulation domain, while the bias is reduced at the southern areas (south of 15°N, Fig. 2f). Bias in the mountains is probably due to the lack of gauging stations in these areas for generating observations and data for reanalysis (Chen et al. 2008). The biases in the RegCM4.7 simulations used in this study are due to the Era Interim initial and lateral boundary conditions used (Tamoffo et al. 2019), parameterizations, and the model’s structural deficiencies. Bias correction was not applied to the simulation output in this study since the biases cancel out with the use of percentage change.
Fig. 2.
Bias (mm•day-1) in simulated components of the JJAS water budget over West Africa with respect to ERA 5 reanalysis and CRU time series. The panels are arranged as follows: (a) Control precipitation – ERA5 precipitation, (b) Control precipitation – CRU precipitation, (c) Control evapotranspiration – ERA5 evapotranspiration, (d) Control runoff – ERA5 runoff, (e) Control storage change – ERA5 storage change and (f) Control potential evapotranspiration – CRU potential evapotranspiration.
4.2. Simulated Responses of water budget components to doubled CO2
Figure 3 shows the percentage changes in the water budget components in response to CO2 doubling (warming). The change in wind as a result of CO2 doubling is also shown as a vector overlay on precipitation in Figure 3c. In response to CO2 doubling under a warmer climate, general dryness (about 40%) and isolated wetness (20-100%) are simulated at north of 15°N. At the ocean between 0 and 18°N and 32 and 39°N, precipitation shows positive responses (60 to >100%) to CO2 doubling under a warmer climate. Land area south of 15°N shows lower positive responses of 40 to >100%. Such findings are not unexpected, since the increase in atmospheric temperature allows for more moisture retention, and thus increased precipitation. Adeniyi et al. (2019) corroborate this finding with intensified and spatially extended precipitation increases for the ocean and most of the southern land areas between 5 and 10°N. However, in this study, more land areas south of 15°N show distinctive isolated dryness of about 40%. The simulated distinctive isolated dryness south of 15°N is probably due to more realistic simulation resulting from the 20 km × 20 km grid spacing used in this study compared to the 50 km × 50 km grid in Adeniyi et al. (2019). Precipitation over West Africa is mainly convective (Schumacher, Houze 2003), so different precipitation amounts are usually observed over a range of a few kilometres, thus high-resolution simulation will capture more realistic values of precipitation. In addition, the increase in temperature from 1.5°C to 2°C in this study can result in intensified wetness or even dryness if evaporation exceeds precipitation. More distinct responses are simulated in this study as a result of the increase in atmospheric and ocean surface temperature when compared to the experiments in Adeniyi et al. (2019). In general, the ocean, highlands, and mountainous areas have more rainfall (Fig. 3c).
Fig. 3.
Simulated JJAS percentage changes in (a) runoff, (b) evapotranspiration, (c) precipitation with change in wind vector overlay and (d) storage change over West Africa in response to doubled CO2 concentration with 2°C warming of ocean and atmosphere. Simulated percentage changes in water budget components are shown in colour, while the change in wind vector is overlaid on percentage precipitation change.
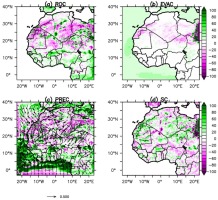
Responses of runoff (mostly ±60%) and storage terms to doubled CO2 have similar spatial signals over land (Fig. 3a, d). However, the precipitation change signal is greater than those of runoff and storage (Fig. 3a, c, d). The southern land area (south of 15°N) has a higher runoff response than the storage response (Fig. 3a, d). Increases in precipitation and runoff in areas south of 15°N and along the coast tend to cause flooding (Blöschl et al. 2015). Evapotranspiration has a minimal (0 to ±20%) response to doubled CO2 (Fig. 3). Burkina Faso and southern Mali, although adjacent, show opposite responses to CO2 doubling (Fig. 3a, c, d). The underlying physical reasons for the opposite responses need further clarification. Wind vectors intensified from southerly and south-westerly directions at the ocean, while northerly, north-easterly, and north-westerly changes prevail to the north (Fig. 3c). With southerly and south-westerly intensification in the southern areas, precipitation is bound to increase, depending on the topography of the area, as a result of the prevailing moisture laden air-mass. Also, the intensification of northerly, northwesterly, and north-easterly winds to the north generally leads to dryness in the northern areas. Southern Mali is located at the leeward of the highland in far southern Mali. Southernmost Mali, at the windward of the highland, has increased precipitation, which could not reach the leeward side of the highland. However, the prevailing wind response and the orography favours the transportation of moisture to Burkina Faso, so the two locations have opposite changes in response to doubled CO2. The western side of Burkina Faso is to the windward of a highland where most of the available moisture in the cloud precipitates before getting to Niger (Fig. 3c), Adeniyi (2014).
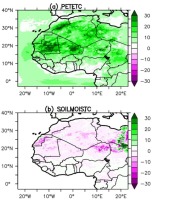
Required water (potential evapotranspiration – evapotranspiration) increases (10-30%) in the north (>15°N) as a result of reduced evapotranspiration (1 to 20%; Figs. 3b, 4a). The greatest increase in required water is simulated at Mauritania and northeastern Mali, while isolated reduction (5-15%) is simulated at central and eastern Niger, northern Chad, central and northern Libya, eastern Nigeria, and southwestern Cameroon. There is little change in required water (<10%, Fig. 4a) at the south (<10°N) following insignificant change in evapotranspiration (<10%, Fig. 3b) in the area. Soil moisture increases slightly (<5%) with increased CO2 in the countries south of 15°N as a result of increased precipitation and slight increases in the storage change, while soil moisture declines (5-15%) north of 15°N (Figs. 3, 4b) due decreased precipitation. However, increased soil moisture (15-30%) is simulated in the western Sahel, northeastern Chad, and eastern Libya. This is corroborated by the reduction in required water (Fig. 4a, b) for these areas.
4.3. Responses of water budget components to doubled CO2 in southern Mali and Burkina Faso
The opposite responses for Burkina Faso and southern Mali are noteworthy – these are two adjacent locations (Figs. 1, 3). In order to examine these opposite responses, the percentage changes in monthly water budget components at both locations were extracted and compared.
Figure 5 shows the intra-annual variations in the response of the components of water budget to doubled CO2 in southern Mali and Burkina Faso. The northern parts of the two countries are in the Sahel so the desert influence may affect their responses in the north. However, the latitudinal positions of southern Mali and Burkina Faso are also similar.
Fig. 5.
Intra-annual variability in percentage (a) runoff change, (b) evapotranspiration change, (c) precipitation change and (d) storage change over West Africa in response to doubled CO2 concentration under 2°C warming of ocean and atmosphere at southern Mali (latitude 12.5°N – 15°N, longitude 5.5°W – 10°W) with water deficit and Burkina Faso (longitude 0°W – 5°W, latitude 11.5°N – 14°N), which is exceptionally wet.
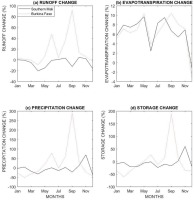
The simulated precipitation change in response to CO2 doubling shows two peaks of increase, in June (70%) and September (290%), whereas it precipitation is reduced in other months, with the greatest reduction (–50%) in February in Burkina Faso. In southern Mali, precipitation declines throughout the year except in November when it increases by 60% (Fig. 5c). This finding is consistent with the report of Giannini et al. (2008) that global warming results in a dryer Sahel. Observed precipitation and water budget parameters usually have two peaks, one in June and another in September over Burkina Faso (Funk et al. 2012) and a greater percentage increase is expected during the peak period than during the dry season. The 50% reduction in precipitation during the dry season, especially in February, could be seen as a late onset of precipitation in Burkina Faso and possible flooding during summer as a result of increased precipitation. Evapotranspiration increases from January to November at both locations with percentage increases ranging from 2 to 10%; evapotranspiration declines in December (Fig. 5b) at both locations. Warming as a result of CO2 doubling would lead to increased evaporation. Runoff shows a positive response to CO2 doubling, with peaks in June (45%) and September (90%) and little or no change for other months in Burkina Faso. Runoff and precipitation increases would cause flooding in Burkina Faso. In southern Mali, runoff is reduced throughout the year with a maximum reduction of 20% in April (Fig. 5a). Storage change increases from June (25%) to October with maximum (185%) in September and declines in the remaining months in Burkina Faso (up to –60% in February). The increase in storage change will increase the water table level at Burkina Faso during summer. Storage change decreases throughout the year except in November, when it increases to about 60% in southern Mali (Fig. 5d); the result will be a dryer Mali with reduction in the water table level. Storage, precipitation, and runoff decrease in southern Mali, while they increase in Burkina Faso (Figs. 3, 5) as a result of doubled CO2 and increase in atmospheric and oceanic surface temperature during summer (June-September), while evapotranspiration has a similar minimal response to doubled CO2 at both locations (Fig. 5b).
5. Conclusion
The impact of increasing CO2 concentration on spatial variations of precipitation and other water budget components over West Africa is not yet documented. In an attempt to document the impacts of CO2 doubling on water budget components over West Africa, this paper simulates at high resolution (20 km × 20 km), the response of water budget components to CO2 doubling, with 2°C warming of the atmosphere and ocean surface. The simulations were done using the latest version of the RegCM4.7.0 of the ICTP. As expected, precipitation increases over the ocean and some coastal areas, since the increase in the atmospheric temperature allows for more moisture retention. However, dryness prevails in some places, with more spatial coverage than reported by Adeniyi et al. (2019) with RegCM4.5 and 1.5°C warming of the atmosphere and ocean surface. The reduction in precipitation in some places is attributed to the increase in atmospheric and oceanic surface temperature and the relatively high resolution of the simulations, which allows for resolution of distinct responses. All the components of the water budget respond to CO2 doubling similarly as precipitation (±60 to 100%) except evaporation, which has little response (±20%). The water budget components generally increase south of 15°N and decline north of 15°N. The results show spatial variations in response to doubled CO2, depending on the topography of the area in relation to the windward or leeward location and the proximity to the ocean or water body. The areas with water surplus identified as a result of warming are Burkina Faso, eastern Senegal, Sierra Leone, the southwestern coast, and central Chad. Policy makers in these areas need to make proper adaptation plans against flooding that may result from increased precipitation and runoff. Areas with expected water deficits are extend northward from 15°N, so policy should be adaptable to increased water requirements and droughts as a result reduced precipitation, water storage, and soil moisture.

