1. Introduction
In Poland, thunderstorms are a frequent, almost daily phenomenon during the warm season (from May to September). Statistically, there are about 150 days with storms in Poland (Bielec-Bąkowska 2003; Taszarek et al. 2015). However, storm structures capable of generating strong wind gusts and having the characteristic appearance of bow-shaped lines, based on which they are called “bow echo,” are less common. It is estimated that, on average, the bow echo occurs about 10 times a year in Poland (Celiński-Mysław et al. 2019). The period of occurrence of these events is also shorter and generally limited to the warmest months of the year, i.e., from May to August (Celiński-Mysław, Palarz 2017). On the other hand, derecho phenomena, which are the more intense type of bow echo in terms of the strength of wind gusts and their spatial and temporal extent, are less frequent. Derecho phenomena, on average, are recorded once a year in Poland, although sometimes, they do not occur at all in a given year (Celiński-Mysław, Matuszko 2014; Surowiecki, Taszarek 2020). The mechanisms of the formation and development of both phenomena are similar. Bow echo is classified as a derecho; when characterized by an appropriate evolutionary cycle, it meets the conditions allowing for development and persistence in the environment for several hours, reaches certain spatial dimensions, affects a specific area, and is accompanied by wind gusts exceeding certain thresholds (Fujita 1978; Johns, Hirt 1987; Evans, Doswell 2001; Coniglio et al. 2004).
Most relevant publications in European literature described a derecho as a case study, with comprehensive analysis from an environmental point of view, which often plays a decisive role in the development of this phenomenon (Punkka et al. 2006; Lopez 2007; Gatzen et al. 2011; Hamid 2012; Gospodinow et al. 2015; Taszarek et al. 2019; Sipos et al. 2021; Chernokulsky et al. 2022). Fewer studies from Europe present climatological characteristics of long time series derechos (Gatzen et al. 2020). In this context, two Polish publications, which examine the derecho phenomenon in annual series, starting in 2007, are relatively well presented (Celiński-Mysław, Matuszko 2014; Surowiecki, Taszarek 2020). The derecho which occurred in 2017 near Suszek village was subject of a higher number of studies because it seems to be the most violent windy phenomenon which appeared in Poland during the last decade (Taszarek et al. 2019; Figurski et al. 2021; Łapeta et al. 2021; Łuszczewski, Tuszyńska 2022). This article presents a comprehensive synoptic analysis of this case and constitutes a part of a derecho monograph, together with two recent publications on radars and satellites.
The violent storm that occurred on August 11, 2017, met the derecho criteria (Johns, Hirt 1987; Celiński-Mysław, Matuszko 2014; Taszarek et al. 2019), although not those proposed by Corfidi et al. (2017), and was the most hazardous, recently recorded one in Poland. The wind gusts were some of the strongest in the history of Polish measurements, with a speed of 42 m/s in Elbląg, 36 m/s in Chrząstów, 35 m/s in Gniezno, and 31 m/s in Chojnice and Lębork. The storm zone covered almost the entire north-western part of the country, extending from 200 to 400 km. Analysis of radar data and atmospheric lightning indicated that the thunderstorms, which took the form of an organized convective system over time, had begun to develop over the Sudetes in the afternoon (14-16 UTC) and moved towards NNE. On the border of Lower Silesia and Wielkopolska, a supercell (a thunderstorm with rotating updraft) was formed, from which a bow-shaped line (bow echo) was generated in the evening (19-20 UTC). The system moved further through Kujawy and Gdańsk Pomerania, where the mesoscale convective vortex (MCV) developed. Then, crossing the region of Żuławy Wiślane, it moved over the Baltic Sea at night (23-00 UTC). Six people died, including two children, and several dozen people were injured as a result of broken trees and buildings destroyed by the squall. According to media reports, the scale of forest damage on the path of the storm passed reached almost 80,000 hectares.
2. Purpose of the study and source data
The purpose of this study is to perform a detailed synoptic analysis and documentation of the conditions in which the storm occurred over Poland's western and northern parts on August 11, 2017. A detailed examination of the environment in which the derecho occurred, a rare phenomenon in Polish conditions, the causes of its formation, and the stages of its development are important not only from a scientific perspective but can also be applied in practice in short-range forecasting.
Based on archive charts and data used in the operational work of the Polish Meteorological Service, we analyzed the synoptic conditions. Precisely, we used surface and upper-level (850, 700, 500, and 300 hPa) synoptic charts at 00 and 12 UTC, Stüve diagrams and hodographs based on atmospheric soundings generated in Wrocław, Łeba, and Legionowo at 00 and 12 UTC, hourly SYNOP data from Polish synoptic stations, and meteorological data from the automatic stations of the Meteorological Measurement and Observation Network of the IMGW-PIB.
In addition, for the analysis, we used Stüve diagrams and hodographs based on atmospheric soundings carried out in Lindenberg, Prague, Prostejov, Lviv, and Vienna, obtained from the Univ. of Wyoming database available at http://weather.uwyo.edu/upperair/sounding.html; atmospheric sounding data and isobaric charts from the Plymouth State Weather Center archive from the website https://vortex.plymouth.edu/myowxp/upa/ovrmap-a.html; reanalysis from the GFS model http://www1.wetter3.de/archiv_gfs_dt.html; KNMI surface synoptic charts (from 00, 06, 12, 18 UTC) available on the website https://www.knmi.nl/nederland-nu/klimatologie/daggegevens/weerkaarten; DWD surface synoptic charts (00, 06, 12, 18 UTC) available on the website http://www1.wetter3.de/archiv_dwd_dt.html; reports on dangerous meteorological phenomena from the European Severe Weather Database (ESWD) from https://www.eswd.eu/.
The POLRAD radar network data and the MSG satellite images were used to retrace thunderstorm evolution and movement in high spatial and temporal resolution. General thunderstorm organization was determined based on the radar data.
3. Methodology
There are various definitions and approaches to “synoptic analysis” (Łozowicki 1991; Kalkstein et al. 1996; Niedźwiedź 2003; Lackmann 2011). Nowadays, complex numerical models are used to simulate and study the state of the atmosphere as well as the causes and development of the examined phenomenon. However, this study follows the classic synoptic analysis used in the operational work of the Polish Meteorological Forecast Offices. Its definition is simple and states that synoptic analysis is based on studying the state of the atmosphere over a large area, using synoptic charts (surface synoptic charts and isobaric upper-level charts) and other available material (Niedźwiedź 2003; AMS 2021). However, this simple identification of the “state of the atmosphere” requires a detailed analysis of the type of air masses and their physical properties, the determination of the location of the atmospheric fronts, as well as the vertical and horizontal air movements occurring in the atmosphere, and the dependencies between them, generating conditions for the emergence of complex weather phenomena.
The first stage of the research was the analysis of the isobaric upper level with reference to surface synoptic charts. This provided an insight into the general distribution of air masses and their properties, also considering the vertical structure of the atmosphere over Europe on August 11, 2017, and in the days preceding the occurrence of violent thunderstorms. The source areas of the air masses, the direction of their inflow, and the frontal zones separating them were analyzed. The influences of the upper- and mid-tropo-sphere airflow on the development of the situation in the lower troposphere was also studied in detail.
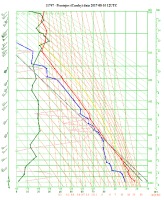
In the following stage, the physical parameters of air masses in the frontal zone and in the warm tropical air mass were analyzed. Based on the aerological sounding data, the vertical profiles of temperature, humidity, and wind changes were determined. However, it should be emphasized that the sounding data have low spatial and temporal resolution and therefore do not fully reflect the evolution of the discussed situation. The aerological soundings from Legionowo characterized the conditions east of the developed thunderstorms. On the other hand, the vertical structure of the atmosphere over Wrocław was influenced by the convective cloudiness forming ahead of the cold front in the period preceding the violent storm development. When analyzing the atmospheric soundings from Łeba, located closest to the derecho occurrence, it should be kept in mind that at 12 UTC on August 11, 2017, the sounding was influenced by a sea breeze, and at 00 UTC on August 12, 2017, the storm system was already present in Łeba. Soundings from Prostojev, Prague, and Vienna helped to characterize the tropical air mass that inflowed over the western part of Poland on August 11, 2017, because the same air mass had been present over Austria and the Czech Republic the day before, where violent thunderstorms, including bow echo, also occurred.
The following convective indices were used to assess the stratification of the atmosphere: SBCAPE (Surface-Based Convective Available Potential Energy) – the potential energy available to a parcel of air lifted from the surface; MLCAPE (Mixed Layer Convective Available Potential Energy) – the potential energy available to parcels representing the well-mixed lowest 500-m-thick atmospheric layer; CIN (Convective Inhibition) – a measure of the vertically integrated negative buoyancy of a rising parcel; LI (Lifted Index) – the difference between the temperature of a parcel lifted with average temperature and dewpoint of the layer 500 m above the surface to the level of 500 hPa and the temperature of the surrounding (Lelątko, Ziemiański 2004; Bąkowski 2005).
To determine the vertical humidity distribution, the following indices were used, calculated based on aero-logical soundings: TPW (Total Precipitation Water), relative and specific humidity, surface mixing ratio.
Hodograph analysis was performed to determine the wind shear vectors in the 0-3-km and 0-6-km layers and the mean wind vector in the 0-6-km layer as well as to determine the relation between these vectors, which affects the structure of developing thunderstorm systems.
4. Analysis of the synoptic situation in the period preceding the squall
The genesis of the mesoscale convective system that developed over Poland on August 11, 2017, was related to the evolution of the synoptic situation that had started a few days earlier. On August 8, 2017, eastern and partly central Europe was covered by a surface anticyclone and upper-level ridge. (Fig. 1a, 2a). This high-pressure system brought relatively warm but dry continental polar air from the east toward central and northern Europe. However, in the afternoon, it began to move eastwards, followed by the trough approaching from the west towards central Europe. This initiated a change in circulation over Poland to the southerly regions, with an inflow of warmer and more humid polar maritime air. An extensive trough (Rossby Wave) was observed over the North Atlantic and western Europe in the upper and middle tropo-sphere (Fig. 2a), which gradually evolved into a cut-off low over England throughout the day. Along its leading part, a waving cold front stretched from Scandinavia to the Iberian Peninsula (Fig. 1a). Ahead of the front, warm, moist tropical air was lying over southern Europe, and polar maritime, warm air over central Europe, separated from the much colder and more humid polar maritime air approaching from the Atlantic.
Fig. 1.
Surface analysis, 12 UTC on August 8-11 (a-d), 2017. N – low, W – high, PPm – polar maritime airmass, PPmc – warm polar maritime airmass, PPk – polar continental airmass, PZ – tropical airmass.
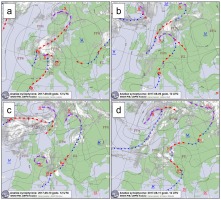
Fig. 2.
Absolute topography map of the 500-hPa surface, 12 UTC on August 8-11 (a-d), 2017. N – low, W – high (source: IMGW-PIB).
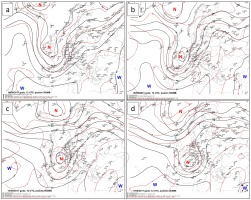
On the following day, i.e., 09.08.2017, there was a relatively small but significant reconstruction of the thermobaric field. All main surface pressure systems moved slowly eastwards, and the frontal system covered the northern and western parts of Poland (Fig. 1b). The middle- and upper-tropospheric low, located over Great Britain the previous day, moved toward France, simultaneously elongating meridionally. A deep trough developed through the entire depth of the troposphere, separating the ridges over the Atlantic and southeast Europe (Fig. 2b). Such pressure distribution intensified the advection of warm and moist tropical air from the south-west to central Europe, including Poland.
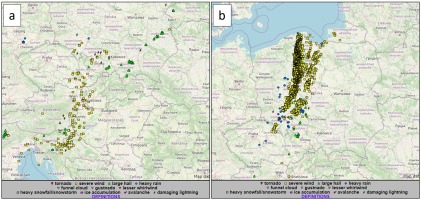
On August 10, 2017, the synoptic situation further changed, seemingly insignificantly but in fact essentially for the evolution of the conditions for convective activity on that day, especially over the Czech Republic and Austria, and over Poland on the following day. The extensive upper-level trough, with the cut-off low over France, began to change its orientation from SW-NE to S-N direction (Fig. 2c). Such a pattern strengthened the direct, meridionally oriented tropical air mass advection from the Mediterranean basin over central Europe, including south-eastern Poland (Fig. 1c). Colder and moist polar maritime air advected over western Europe at the same time. The large thermal contrast of air masses in the front zone and the evolution of the upper-level trough created a favorable environment for frontogenesis and cyclogenesis, as well as a large-scale rising motion supporting the development of deep convection in the warm air mass ahead of the front line. There was a significant horizontal divergence in the forward part of the upper trough, reaching its maximum over the Czech Republic (Fig. 3). This favored convergence at the surface, where the maximum convective activity occurred in the evening. The path of extreme phenomena, among which strong wind gusts were the most hazardous, was recorded in the area from Slovenia to southern Poland and marked the line of the maximum storm activity (Fig. 4a).
Fig. 3.
Absolute topography map of the 300-hPa surface (GFS analysis), August 10, 2017, 18 UTC; jet streams (color scale) and horizontal divergence field (white isolines) are marked (source: www.wetter3.de).
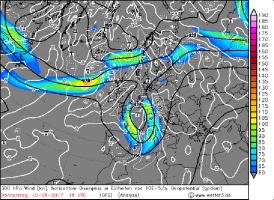
Fig. 4.
Reports on hazardous meteorological phenomena from August 10, 2017, 09 UTC to August 11, 2017, 03 UTC (a) and from August 11, 2017, 06 UTC to 24 UTC (b) (source: www.eswd.eu).
5. Detailed analysis of the derecho storm
5.1. Synoptic situation
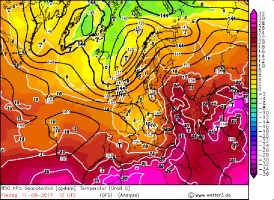
As a consequence of the described favorable conditions in the upper troposphere, on the night of August 10/11, 2017, a wave on the atmospheric front over the western Czech Republic developed into a shallow low in the Rudawy region and moved towards Brandenburg (NE Germany) in the morning and during the day on August 11, 2017. The frontal zone stretched along the northern and western border of Poland at 12 UTC, and the tropical airmass advected over the whole country (Fig. 1d). The location of the main pressure systems in the middle and upper troposphere on August 11, 2017, did not differ much from that of the previous day. However, their shape changed, which affected the further development of the situation. Western Europe was covered by an extensive upper trough, with a cut-off low in its southern part, moving from France towards the Alps (Fig. 2d). In this way, the axis of the upper trough was slightly directed to the northwest, which generated an advection of tropical air from the eastern part of the Mediterranean basin, through the Adriatic Sea, over Poland. Simultaneously, the frontal waves and surface lows in the frontal zone were moving in the same direction. On an isobaric surface of 850 hPa, a ridge of warm air covered most of Poland, exceeding the temperature of 20°C in the southeast of the country. At the same time, there was polar maritime air, colder by about 10°C (Fig. 5), over Germany.
Fig. 5.
Absolute topography map of the 850-hPa surface (GFS analysis), August 11, 2017, 12 UTC (source: www.wetter3.de).
5.2. The process of frontogenesis
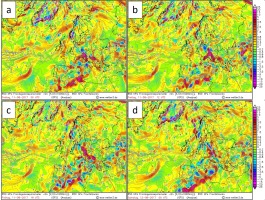
The temperature gradient increased over time in the west of the country and over eastern Germany, indicating frontogenesis. The process of frontogenesis in this area could be traced over time by analyzing the magnitude of the vector -Qn (Fig. 6). This vector is a component of the Q-vector, which describes the evolution of the horizontal potential temperature gradient vector due to changes in the geostrophic wind. The vector -Qn is the Q-vector’s component perpendicular to the isotherms on a given isobaric surface. If -Qn > 0, frontogenesis occurs; if -Qn < 0, frontolysis occurs (Kurz 1992). The maximum value of the -Qn-vector, indicating frontogenesis, moved from Austria through the Czech Republic to western Poland on August 11, 2017.
Fig. 6.
Frontogenesis on the surface of 850 hPa (GFS analysis, description in the text), August 11, 2017, 06 UTC (a), 12 UTC (b), 18 UTC (c), and August 12, 2017, 00 UTC (d) (source: www.wetter3.de).
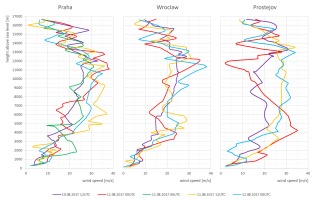
The increase in the horizontal temperature gradient in the lower troposphere resulted in the isobaric surfaces becoming more inclined. This led to an intensification of the horizontal pressure gradient and an increase in the geostrophic wind speed above due to the thermal wind principle. Changes in the vertical wind profile could be noticed by analyzing data from the soundings, carried out in the frontal zone or its vicinity (Fig. 7). Prague was located closest to the waving cold front or directly in its zone in the period from August 10 to August 12, 2017. The maximum wind speeds of 30-38 m/s were maintained there in the upper troposphere (at an altitude of 10-12 km), proving the presence of an upper-level jet stream in the frontal zone. There was also a clear increase in wind speed in the mid-troposphere (at an altitude of 3.5-7 km). In Wrocław, located ahead of the cold front on August 10-11, 2017, two distinct wind speed maxima were measured: the first one in the upper troposphere, related to the jet stream, and the second one in the middle troposphere. In a layer of 3.5-6 km, the wind speed increased significantly from around 15 to around 28 m/s from August 10 to August 11, 2017. The changes in wind speed with altitude and time were the largest but the least regular ones in Prostejov, located also ahead of the cold front. However, there was also a noticeable increase in wind speed in the lower and middle troposphere. The maximum speed of 35 m/s was recorded on August 11, 2017, at 00 UTC, at an altitude of approximately 4 km.
5.3. Processes generating large-scale rising motions over central Europe
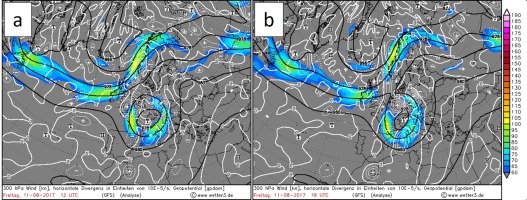
The evolution of the upper cut-off low of an ellipsoidal shape significantly influenced the atmosphere dynamics in central Europe on August 11, 2017. The longer axis of the low changed its orientation from N-S to W-E during the slow movement from France to northwest Italy and further turned to the S-N orientation (180° in total), which took place in the afternoon. Such a rotation enabled a strong cyclonic vorticity advection, covering the area from northern Italy through Austria to the Polish-Czech-German border (Fig. 8). Simultaneously, this area coincided with a jet stream which generated a clear divergence in its exit region (Fig. 9). These processes were conducive to forming the aforementioned low-level low over the western Czech Republic and eastern Germany throughout the day.
Fig. 8.
Absolute topography maps of the 300-hPa surface with total vorticity advection (GFS analysis), August 11, 2017, 06 UTC (a), 12 UTC (b), 18 UTC (c), and August 12, 2017, 00 UTC (d) (source: www.wetter3.de).
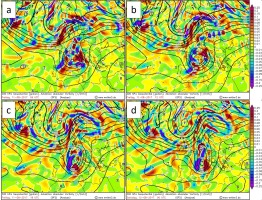
Fig. 9.
Absolute topography maps of the 300-hPa surface (GFS analysis), August 11, 2017, 12 UTC (a), and 18 UTC (b); jet streams (color scale) and horizontal divergence field (white isolines) are marked (source: www.wetter3.de).
The development of large-scale rising motion related to the evolution of the upper-level low took place in the zone of the waving atmospheric front, i.e., from Austria through the western Czech Republic and the Polish-German border. However, also ahead of the front, i.e., in the broader area from the Balkans to Poland, a large-scale lifting was supported by changes in the geopotential field. The axis of the high-pressure ridge moved from Poland to the northeast. The geopotential field in the upper and middle troposphere was transforming from anticyclonic to cyclonic, which generated cyclonic vorticity advection. In the evening on August 11, 2017, this cyclonic vorticity advection was visible in the zone extending from the South Baltic to south-eastern Poland, with a slight maximum near the coast (Fig. 8c), slowly moving away to the northeast. This indicated the dynamic support of large-scale lifting in the central part of northern Poland during the convective system development.
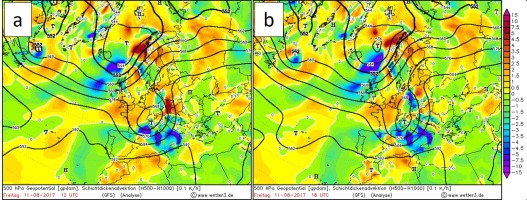
Another factor contributing to the occurrence of large-scale vertical movements was warm air advection, which can be expressed, among others, in 1,000- to 500-hPa layer thickness changes. A summary of changes in the thickness of this layer, based on selected aerological soundings on August 11, 2017, indicates that the layer was the thickest and, therefore, the warmest in Legionowo, Prostejov, and Wrocław and on August 10, 2017, also in Prague (Fig. 10). There was a tropical air mass at that time in those locations. The layer thickness was smaller in Łeba and Lindenberg. Lindenberg was in the polar maritime air mass, whereas Łeba was in the tropical air mass only on August 11, 2017, at 12 UTC. The changes in the 1,000- to 500-hPa layer thickness over time were significant: in the period from 00 to 12 UTC on August 11, 2017, the thickness was increasing in Legionowo, Prostejov, and Łeba, showing warm air advection, while it began to decrease in Wrocław, Lindenberg, and, especially, in Prague, which already indicated cold air advection. Analyses from the GFS model may help diagnose a temperature advection in space and time. The maximum warm air advection in the 1,000 to 500-hPa layer moved from the eastern Czech Republic (12 UTC) over Wielkopolska (18 UTC) and then to the north and northeast on August 11, 2017 (Fig. 11). The maximum warm air advection occurred in the area of the mesoscale convective system passage, i.e., from Wielkopolska through the Kuyavian-Pomeranian and Pomeranian voivodeships in the evening on August 11, 2017.
Fig. 10.
Thickness changes in the layer of 500-1,000 hPa from August 10, 2017, at 00 UTC to August 12, 2017, at 00 UTC in selected locations based on aerological measurements (source: IMGW-PIB).
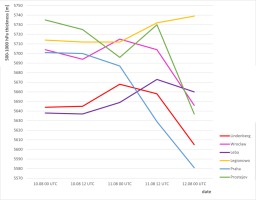
Fig. 11.
Temperature advection in the 500-1,000 hPa layer (GFS analysis) on August 11, 2017, 12 UTC (a) and 18 UTC (b) (source: www.wetter3.de).
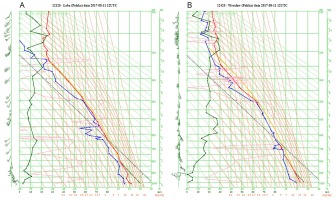
Warm air advection, indicated by veering of upper wind, with height in the lower and middle troposphere, was confirmed by atmospheric sounding data. It was most clearly visible in Łeba at 12 UTC on August 11, 2017, where the veering wind was observed with slight deviations in the layer from the ground surface (SE) to about 600 hPa (SW) and in Wrocław from about 900 to 650 hPa (Fig. 12).
Fig. 12.
Aerological soundings from Łeba (a) and Wrocław (b), August 11, 2017, 12 UTC (source: IMGW-PIB).
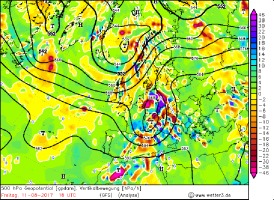
The described processes, i.e., cyclonic vorticity advection in the upper and middle troposphere and warm air advection in its lower and middle part, are factors forcing large-scale air rising, as described by quasi-geostrophic omega equations (Lackmann 2011). Air rising on the synoptic scale favors the development of deep convection (Lackmann 2011; Bechtold 2019). Analysis of large-scale vertical motions using the GFS model (Fig. 13) shows that there was strong lifting over western Poland, reaching maximum values of 40 hPa/h in the evening of August 11, 2017.
Fig. 13.
Vertical movements on the surface of 500 hPa (GFS analysis), August 11, 2017, 18 UTC (source” www.wetter3.de).
5.4. Assessment of convective conditions
The key components for the development of deep convection, including MCS systems with bow echo, are as follows: a large amount of moisture in the boundary layer, a steep temperature lapse rate in the middle troposphere, which indicates a rapid temperature drop with altitude, mechanisms that initiate and maintain convection, and wind changes in the vertical profile, which determine the wind shear.
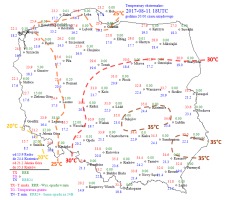
The tropical air mass over Poland on August 11, 2017, differed in terms of physical properties in the western and eastern half parts of the country. In the southeast, the air was noticeably warmer. The air temperature at 850 hPa was 19-22°C at noon, and the maximum temperature at 2 m in that area reached 35°C (Figs. 5 and 14). In the west, the temperature at 850 hPa was significantly lower, from 14 to 18°C, and the maximum temperature at the surface was 22-26°C.
The air in the southeast of the country was relatively dry. Total Precipitation Water (TPW) in the southeast was below 30 mm. Due to the strong subsidence inversion, humidity was low from the surface up to 600 hPa, resulting in cloudless weather. On the other hand, humidity was larger and reached 45-48 mm in the west of Poland, in the frontal zone and the line of convergence ahead of it, and in the northern part of the country (about 45 mm in Wrocław on August 11, 2017). Humidity was accumulated mainly in a layer from about 700 to 400 hPa. The day before, TPW was also significant over Austria and the Czech Republic – on August 10, 2017, at 00 UTC, it reached 46 mm in Vienna and 30-40 mm over the Czech Republic, where significant humidity was also accumulated in the 700- to 400-hPa layer. In addition to the increased humidity in the middle troposphere, humidity was concentrated at the surface, to the isobaric level of about 900 hPa. The water vapor mixing ratio in the boundary layer was 11-14 g/kg in western Poland at noon, slightly to the east of the front, and in the northern part of the country, it reached 15-17 g/kg. The lowest values were observed in the southeast – from 8 to 11 g/kg. For comparison, the surface mixing ratio was 14 g/kg on August 10, 2017, at 12 UTC in Prostojev.
Such a humidity distribution in the vertical profile, with drier air in the 900- to 700-hPa layer (Fig. 15), indicates the possibility of intensifying strong wind gusts at the surface via acceleration of the downdrafts.
In addition to the spatial distribution of humidity, it is also necessary to consider its changes over time. The increase in the mixing ratio and water vapor content in the vertical column of air between August 10, 2017, and August 11, 2017, was best visible in Wrocław and Legionowo. A similar increase took place during the night on August 11/12, 2017, in Łeba (Tab. 1), indicating the presence of moist air advection.
Apart from the significant humidity, the air mass in which the most severe thunderstorms developed was characterized by unstable stratification. In the 800-600-hPa layer, the vertical thermal gradient was around 8.0°C/km in Legionowo on August 11, 2017, at 00 UTC and 12 UTC, and about 7.4 and 6.0°C/km in Wrocław, respectively. For comparison, this gradient was about 8.5°C/km on August 10, 2017, at 12 UTC in Prostejov.
Table 1.
Mixing ratio and water vapor in the vertical air column from August 10, 2017, at 12 UTC to August 12, 2017, at 00 UTC, based on aerological measurements.
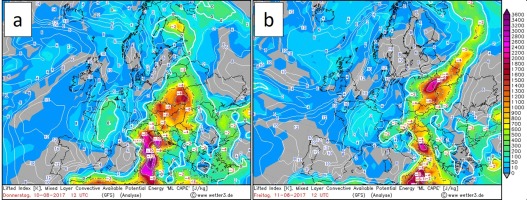
The Lifted Index (LI) can also be used to determine mass instability. Here, LI, calculated for a parcel lifted with average temperature and dewpoint of the layer 500 m above the surface, was approximately –1°C in Wrocław at 00 UTC but 2.6°C at 12 UTC on August 11, 2017, while in Legionowo, it was even –8°C at 12 UTC. On the other hand, this air mass over Austria and the Czech Republic was characterized by LI values from –4 to –7°C on the previous day and was therefore moderately and strongly unstable (Lelątko, Ziemiański 2004). It should be mentioned that LI, calculated for the most unstable parcel, dropped to –4°C at 00 UTC and to –1°C at 12 UTC in Wrocław. According to GFS analyses, the highest instability measured by LI, from –6 to –8°C, occurred in the east of the country, whereas in the west, LI ranged from –1 to –3°C, decreasing to –6°C in the afternoon.
Such a large amount of humidity and instability resulted in a significant amount of potential energy available for convection. The SBCAPE (Surface-Based Convective Available Potential Energy), reaching 2,500-3,000 J/kg, was observed in central and north-eastern Poland, whereas it was 200-800 J/kg in the west of the country. The previous day, an SBCAPE of 1,500-2,200 J/kg was recorded in the air mass moving over from Austria and the Czech Republic towards Poland. According to GFS analyses, the MLCAPE (Mixed Layer Convective Available Potential Energy) reached 1,800 J/kg over the Czech Republic and Austria on August 10, 2017, and it increased in the afternoon from 100-700 J/kg to 300-1,100 J/kg (Fig. 16) over western Poland on August 11, 2017. These values indicate the low and moderate intensity of convection (Lelątko, Ziemiański 2004).
Fig. 16.
Lifted Index and MLCAPE (GFS analysis), August 10, 2017, 12 UTC (a) and August 11, 2017, 12 UTC (b) (source: www.wetter3.de).
It should be added that from the level of 900 hPa to about 750-650 hPa, a stable stratification was observed on some aerological soundings. The CIN (Convective Inhibition) values reached about –180 J/kg in Prostejov on August 10, 2017, at 12 UTC, and –280 J/kg in Wrocław on August 11, 2017, at 00 UTC. Therefore, moisture and temperature advection in the boundary layer as well as the kinematic conditions and dynamic factors that force convection initiation were important.
The above analysis shows that the convective instability over Poland increased from west to east, in contrast to humidity, which was highest in the west of the country. Therefore, optimal conditions for the development of deep convection should have been expected in the central belt of Poland.
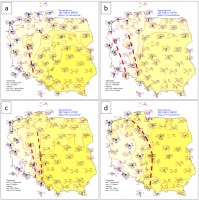
The dynamic factors that supported the initiation and sustaining of the upward movements on August 11, 2017, were the orography and the surface wind convergence zones in the southwest of the country. Over the Sudetes and in the area from Poznań through Leszno to Wrocław (Fig. 17a), thunderstorms were already developing in the morning and before noon. These phenomena were not violent and intense but gave rise to cold pool development in the southwest of Poland. A distinct horizontal thermal gradient and a wind convergence zone were formed; two zones of wind convergence were noticeable at 13 UTC (Fig. 17b). The thermal differences were amplified by daily heating, especially on the eastern convergence line, where the cloudiness changed from fine to the east of this line to cloudy, post-convective to the west. The first afternoon thunderstorms were formed over the Sudetes. Following the mean wind direction in the troposphere, they moved to the north, into the zone of the western line of wind convergence, where a further rapid development of convection occurred in the following hours. The convergence lines approached each other at 17 UTC, and the horizontal thermal gradient in this zone increased, particularly over the Opole region (Fig. 17c). According to the radar data, thunderstorms had the form of a mesoscale convective system at that time, in which the line of the most active thunderstorm cells was divided into the one located more zonal and the other located meridionally. The entire system was moving north and northeast and was gaining in intensity. Kinematic factors (mainly appropriate wind shear) ultimately led to the formation of the bow echo structure (between 18:30 UTC and 19 UTC) in the zonal part of the MSC (perpendicular to the direction of airflow on the higher levels). Maximum thunderstorm activity took place between 19 and 22 UTC (Fig. 17d), after which the intensity of the phenomena decreased, and the system moved away to the Baltic Sea.
5.5. Importance of wind shear
In addition to the appropriate convective instability and humidity in the lower troposphere, a wind shear also occurred in the atmospheric environment, allowing thunderstorms to be organized into a mesoscale convective system in the form of bow echo, visible on radars and persisting for several hours. When analyzing the hodographs from the aerological stations located near the MCS path (Wrocław, Łeba) and in the direction of air-mass advection (Prostejov), it could be noticed that bulk shear in the 0-3-km layer was either strong or very strong (15-25 m/s) on August 11, 2017, at 00 and 12 UTC. (Fig. 18). The 0-6-km wind shear differed from the 0-3-km shear by no more than 5 m/s. Only in Wrocław at 12 UTC, it was stronger by about 10 m/s, which indicated the existence of conditions favorable for the development of a supercell thunderstorm on the border of Lower Silesia and Wielkopolska. If we calculate the maximum wind shear in the lower and middle troposphere, not considering the 0-3-km and 0-6-km layers, it was about 29 m/s from the surface to 4.5 km at 12 UTC in Wrocław and about 19 m/s to 4 km in Łeba. The presence of wind shear of at least 15 m/s in a layer up to 2.5-5 km above the ground level confirms the favorable conditions for the development of multi-cellular convection in a linear form, with a high probability of bow echo, mainly when the shear is concentrated to a height of 2.5-3 km (Weisman 1993). Analysis of upper-air soundings shows that the atmospheric conditions met the criteria needed for the development of such intense convective phenomena.
Fig. 18.
Hodographs on August 11, 2017, from Prostejov at 00 UTC (a) and 12 UTC (b), Wrocław at 00 UTC (c) and 12 UTC (d), and Łeba at 12 UTC (e) (source: www.weather.uwyo.edu).
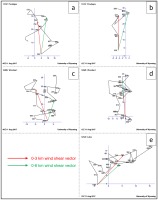
Attention should also be paid to the orientation of the wind shear vector relative to the mean wind vector. At 12 UTC on August 11, 2017, the mean wind speed in the 0-6-km layer was about 20 m/s and the direction about 170° in Prostojev, 14 m/s and 170° in Wrocław, respectively, and 8 m/s and 200° in Łeba. Thus, the mean wind and the 0-3-km wind shear vectors' directions were similar in individual cases. According to the RKW theory (Rotunno et al. 1988), the formation of a new thunderstorm cell in a multi-cell convective system, in an environment with a significant wind shear in the layer up to several kilometers, usually takes place at the cold pool edge, moving in the same direction as the wind shear vector (downshear flank). It is the place where the strongest convergence occurs. The vector of the movement of the entire system, at least in a homogeneous external environment and for linear hodographs, is the sum of the wind shear vector, determining the place of new cell formation, and the mean wind vector, determining the movement of a single convective cell. The more the directions of these vectors coincide, the more likely it is that a linear forward-propagating MCS will develop (Corfidi 2003). The sum of these vectors for Prostejov at 12 UTC on August 11, 2017, indicates the movement of the potential system northwards, in Wrocław to the north with a slight deviation to the west and in Łeba towards NNE and NE. In fact, the system was moving through Poland in the direction from SSW to NNE, with a mean speed of about 20 m/s. The deviation of the movement towards the east, different from that determined based on data from Prostejov and Wrocław, could have resulted from the heterogeneity of thermodynamic conditions over Poland. New convective cells tend to form towards the highest instability areas, and this increased towards the east, deflecting the vector of the entire convective system movement in this direction. Hodographs in Wrocław and Łeba were also bended up to the 650-hPa level (above 900 hPa in Wrocław), showing the wind veer in this layer. Consequently, the storm-relative wind in the lower troposphere had an NNE to E direction, increasing convergence at the cold pool edge in this sector. It could also have contributed to the easterly deviation of the movement vector of the entire mesoscale system.
In addition to good conditions for the development of convection in the form of a multi-cell linear system, the sounding from Wrocław on August 11, 2017, at 12 UTC, indicated the possibility of a supercell development. Wind shear in the 0-6-km layer was about 26 m/s. The maximum wind speed at about 540 hPa was 28 m/s, and the wind was veering in the lower troposphere, which is reflected in the hook shape of the hodograph (Fig. 18d). The development of the supercell was observed on the border of Lower Silesia and Wielkopolska in the initial stage of the formation of the MCS system.
The previously demonstrated increase in wind speed from the surface to the middle troposphere, where its maximum values were recorded in all analyzed soundings (Fig. 7), contributed to the increase in the dynamics of the thunderstorm system and the intensity of wind gusts. One of the factors that influence the strength of convective gusts is the transport of momentum from the middle troposphere to the surface by the downdraft in the Cumulonimbus cloud. The wind speed reached 35 m/s at 4,200 m (at 00 UTC on August 11, 2017) in Prostejev, 28 m/s at 5,300 m (at 12 UTC) in Wrocław, and 16 m/s at 3,800 m (at 12 UTC) in Łeba, where the pressure gradient was the weakest. This indicates suitable conditions to transfer significant wind speeds from the middle troposphere to the surface in the air mass flowing from the south.
Besides the direct transfer of momentum, the jet stream in the middle troposphere, or even a slight increase in wind speed at these heights, favors the development and intensification of the cold pool itself, which increases the dynamics of the entire convective system. A stronger wind at an altitude of several kilometers facilitates the inflow of drier air behind the system. Thus, the higher evaporation of precipitation from the trailing stratiform cloud occurs, lowering the air temperature (Punkka et al. 2006; Goulet 2015). The low humidity content was clearly visible in the 2,500- to 4,000-m layer on the sounding from Prostejov at 12 UTC on August 11, 2017. The intensification of the cold pool directly resulted in an increase in gust front speed and the magnitude of associated wind gusts.
The southern wind with maximum speed in the middle troposphere observed on August 11, 2017, could eventually be a significant element in the development of the rear inflow jet (RIJ). The rear inflow jet arises from the formation of a meso-low, where the convective cloud slopes over the cold pool and turns into layered cloudiness. However, an increased ambient wind speed at the height of several kilometers may accelerate this process (Goulet 2015; Crossett 2017). The presence of the rear inflow jet potentially increases the speed of the wind gusts as it descends to the surface near the downshear side of the cold pool.
6. Phenomena accompanying the derecho
The most hazardous phenomena accompanying the thunderstorms on August 11, 2017, were wind gusts. The ESWD reports, among which strong wind gust events were the most numerous, clearly mark the thunderstorm activity area on that day from south-western to northern Poland (Fig. 4b). Table 2 and Figure 19 summarize the values of maximum wind gusts or maximum wind speed from 10-minute intervals, with a speed of 20 m/s or more, based on the measurement and observation network of the IMGW-PIB. The highest wind speeds, above 30 m/s, were recorded in the northern part of the Wielkopolskie Voivodeship, in the Kuyavian-Pomeranian and Pomeranian Voivodeships, and in the north-western part of the Warmian-Masurian Voivodeship, where the maximum wind gust of 42.2 m/s was measured in Elbląg. The convective system had already moved as a bow echo through these areas.
Fig. 19.
Wind gusts or maximum wind speeds ≥20 m/s and 1-hour precipitation ≥20 mm within the range of the mesoscale convective system moving through Poland on August 11, 2017 (source: IMGW-PIB).
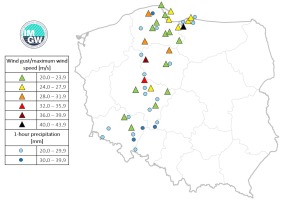
Table 2.
Wind gusts or maximum wind speeds ≥20 m/s from 10-minute intervals measured by the measurement and observation network of the IMGW-PIB within the range of the mesoscale convective system moving through Poland on August 11, 2017.
Downpour or heavy showers occurred in many parts of the country. Table 3 and Figure 19 summarize the 1-hour precipitation for a full hour, with 20 mm or higher, from the locations over which the analyzed thunderstorm zone was formed and passed. The highest precipitation intensities were recorded in Lębork (38.5 mm/h), Bierutów (36.9 mm/h), Dobrogoszcz (35.6 mm/h), and Siemianice (30.5 mm/h). The 24-hour precipitation sum exceeded 30 mm in many places at 06 UTC on August 12, 2017. However, it should be noted that in south-western Poland, before the formation of the analyzed convective system, several precipitation and thunderstorm zones were passing in the first half of the day. Rainfall and thunderstorms associated with a cold front occurred from the Opole region to Gdańsk Pomerania after midnight on August 12, 2017. However, in Lębork, where the highest daily precipitation among all synoptic stations was recorded, 60.2 mm (Fig. 20), practically all rainfall occurred within about 3 hours, i.e., during a passage of the mesoscale convective system in this region.
Fig. 20.
Meteorological situation in Poland from 06 UTC on August 11, 2017, to 06 UTC on August 12, 2017 (source: IMGW-PIB).
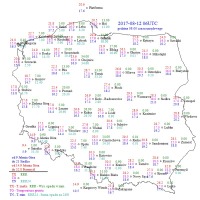
Table 3.
1-hour precipitation ≥20 mm, determined by the measurement and observation network of the IMGW-PIB within the range of the mesoscale convective system, moving through Poland on August 11, 2017.
7. Conclusions
This study profoundly analyzed the synoptic conditions preceding the development of the mesoscale convective system on 11 August 2017 and during its passage over Poland from the southwest to the north of the country. This article was planned as a common part of two other publications that analyzed this violent phenomenon from satellite and radar points of view (Łapeta et al. 2021; Łuszczewski, Tuszyńska 2022). We found that synoptic-scale mechanisms and appropriate thermodynamic, humidity, and kinematic conditions were favorable for developing a mesoscale convective system, classified as a derecho. A comprehensive analysis of one of the most violent windy events has been performed by other authors (Taszarek et al. 2019; Figurski et al. 2021). However, the investigation of the synoptic situation was not the main purpose of these publications.
The analyzed derecho fulfilled most of the criteria, which is common for warm season European derechos. It was embedded in the convergence zone of the MCS ahead of the waving cold front, downstream of the extensive upper-level trough over western Europe. This is similar to the occurrence of other derechos in Europe (Gatzen 2004; Celiński-Mysław, Palarz 2017; Ryva 2019).
The formation of the derecho evolved in an environment that featured the three necessary requirements for the occurrence of deep moist convection (Johns, Doswell 1992).
The derecho of August 11, 2017, was connected with the surface trough under a southwestern flow in low- and mid-levels, supported by an upper-level jet. The presence of a left jet stream exit over the convergence zone generated the upper divergence and the increase of large-scale lifting. They were a consequence of the strong cyclonic vorticity advection in the upper and middle troposphere, associated with the evolution of the cut-off low. Warm air advection in the lower and middle troposphere was one of the essential components causing rising air on a synoptic scale, generating an adequate environment for the formation of mesoscale vortex structures.
Vertical wind shear is a crucial ingredient for linearly organized MCSs (Weisman, Klemp 1982; Rotunno et al. 1988; Bryan et al. 2006). The increase in speed, generating moderate and strong wind shear (15-25 m/s) in the 0-3-km layer and an equally high shear in the 0-6-km layer, enabled the formation of both supercell thunderstorms and organized linear convection. The wind shear vectors in the 0-3-km layer were oriented almost parallel to the mean wind vectors, favoring the development of a forward-propagating MCS. The maximum wind speed at the height of several kilometers (4-6 km) favored the development of the rear inflow jet within the linear convective system, which contributed to the formation and intensification of the derecho. The strong wind in the middle troposphere in the air mass flowing from the south created the conditions for the transfer of momentum from the middle troposphere to the surface by the downdrafts in the cumulonimbus clouds, increasing the wind gusts. Moreover, a drier layer of air was observed above the humid boundary layer in the incoming mass, which contributed to the intensification of downdrafts in cumulonimbus clouds and, consequently, to the intensification of surface wind gusts.
Concerning the thermal condition, a tropical warm, humid air mass was advected over Poland. Warm air advection in the lower and middle troposphere was one of the essential components causing rising air on a synoptic scale. This constituted a good condition for high instability, which decreased from the west to the east of the country. The steep vertical temperature gradients in the middle troposphere and the high humidity in the boundary layer generated the atmospheric instability with moderate to high SBCAPE levels (600-3,000 J/kg), whereas the maximum occurred in the central part of Poland, where the convergence zone started to reactivate.
The documentation and analysis of such an impressive, rare weather phenomenon can help understand the underlying mechanism leading to the formation of the derecho and facilitates the prediction of similar events in the future.

