1. Introduction
In hydrology, snowmelt processes are investigated as integral to the formation of river runoff (Marks et al. 1998; Vafakhah et al. 2014). In river catchments, snowmelt involves the complex processes of energy and water transfer between the atmosphere and snow, between different snow layers, and between snow layers and soil (WMO 2009). The most common approaches to determining snowmelt are the heat-balance method, the melting-coefficient method, and the water-balance method of the snow cover (Holko et al. 2011; Zhou et al. 2021). Machine learning methods are widely used in modern research (Thapa et al. 2020). All of these approaches are used in mathematical models of runoff formation when calculating snowmelt in river catchments. The application of such approaches under the conditions in Antarctica has its own specific features, related to the geographical location and the availability of the necessary observation data (Liston, Winther 2005; Zhu et al. 2023).
In Antarctica, research into snow accumulation and snowmelt processes is important because it determines the volume and mass of the terrestrial ice sheet and ice shelves. Bell et al. (2018) reported three modes by which meltwater could impact Antarctic mass balance: increased runoff, meltwater injection to the bed, and meltwater-induced ice-shelf fracture. Banwell et al. (2021) showed that in 2019-2020, surface melt on the northern George VI Ice Shelf on the Antarctic Peninsula was a 32-year record-high. Zhu et al. (2023) reported that both the extent and duration of snowmelt increased in the Antarctic Peninsula from 2015 to 2021 and that snowmelt was significantly more intense on the western side. In general, capturing more detailed information about snowmelt processes is an important way to better understand the state of the ice sheet and ice shelves in Antarctica under climate change (Nagler et al. 2016; Luis et al. 2022).
Ukrainian scientists were given the opportunity to carry out glaciological research in Antarctica by the transfer of the Faraday Station to Ukraine by the United Kingdom in 1996. Now this station is named the Ukrainian Antarctic Akademik Vernadsky Station (hereinafter the Vernadsky Station). Of great scientific importance was the creation of a glaciological polygon by the Ukrainian scientist Govorukha (1997a; 1997b) on the Woozle Hill that is situated on Galindez Island (in Ukrainian scientific literature it is named Domashnii ice cap). Here, 44 snow stakes were installed: 30 main and 14 additional (on the slopes of the glacier). Snow density was measured with a standard snow gauge (Tymofeyev, Grishchenko 2010). There are significantly fewer stakes now. Based on mass-balance measurements it was shown that general evolution of the glacier agrees well with the decadal changes of the mean air temperatures: accumulation dominated in the 1950s and early 60s in conditions of slight cooling; a near-equilibrium state with first signs of ablation was observed in the 1970s, when the first indicators of climate warming appeared; then ablation continued through the 1980s, with further acceleration in the 1990s (Tymofeyev, Grishchenko 2010). The contribution of tropospheric circulation to the mass balance on glaciers is shown, as well as its importance to the formation of ocean currents and sea-ice transport through the Bransfield Strait across the coastal zone of Graham Land (Grischenko et al. 2005). Data from the glaciological polygon and data from two snow stakes at the Vernadsky Station’s meteorological observatory were used (Tymofeyev, Grishchenko 2010), showing an increase in snow depth and positive mass balance of the glacier under negative temperature anomalies and ablation and snow cover reduction under positive ones. Results of further investigations using such data types are reported in (Tymofeyev et al. 2021). Periodical and irregular components of variations in snow cover thickness at Galindez Island, the Argentine Islands archipelago, were statistically analyzed (Belokrinitskaya et al. 2006). Mean annual snow cover duration was estimated (Klok 2016; Shpyg et al. 2024). The dates of snow cover formation and its full melting, fluctuations in snow cover parameters, moisture content estimates, etc., were described (Grischenko et al. 2005; Klok 2016; Klok, Afteniuk 2017; Klok et al. 2021; Shpyg et al. 2024). The influence of wind, temperature, and precipitation phases on snow depth was estimated, revealing that wind speed and direction have crucial roles in changes of snow cover on a daily temporal scale in the location of the Vernadsky Station (Shpyg et al. 2024). For the case of an intense atmospheric river with a related extreme warm event and record-high surface melt, which occurred in February 2022 over the Antarctic Peninsula, the maximum daily extent of melt was calculated using the accumulated snowmelt (Gorodetskaya et al. 2023). However, research on snowmelt processes using the Vernadsky weather station data was not conducted. At the same time, many researchers use information from the Vernadsky Station on meteorological parameters, including snow cover, to study general trends on both the Antarctic Peninsula and Antarctica (Liston, Winther 2005; Turner et al. 2020; Andres-Martin et al. 2024). Typically, snowmelt research is conducted using satellite data and reanalysis, which allows for spatial distribution and overcomes certain limitations of weather station data (Zhu et al. 2023; Ning et al. 2024). However, this approach overgeneralizes and simplifies the characteristics of snowmelt processes. Note that, as shown by Barrand et al. (2013) and Ning et al. (2024), regional climate models frequently struggle to resolve localized surface melt in regions with highly complex terrain. This problem is characteristic of both the Antarctic Peninsula and Galindez Island, where Vernadsky Station is located. As noted by Kaplan Pastíriková et al. (2025), the use of reanalysis data may lead to unrealistic results for snow depth compared to ground-based data. Therefore, ground-based observations are important, reliable sources of information.
The objective of this paper is to determine snow melting characteristics from the Vernadsky weather station data and to analyze the results. In accordance with it, the following tasks were undertaken.
Analysis of observational data for determining snowmelt characteristics.
Creating complex graphs to determine the snow cover characteristics.
Determining the dates of initial snow accumulation, the maximum snow depth, initial and final snow melting, and also the snow depth for these dates.
Determining near-surface air temperature during the snowmelt period.
Calculation of snow melting characteristics.
Analysis of the results.
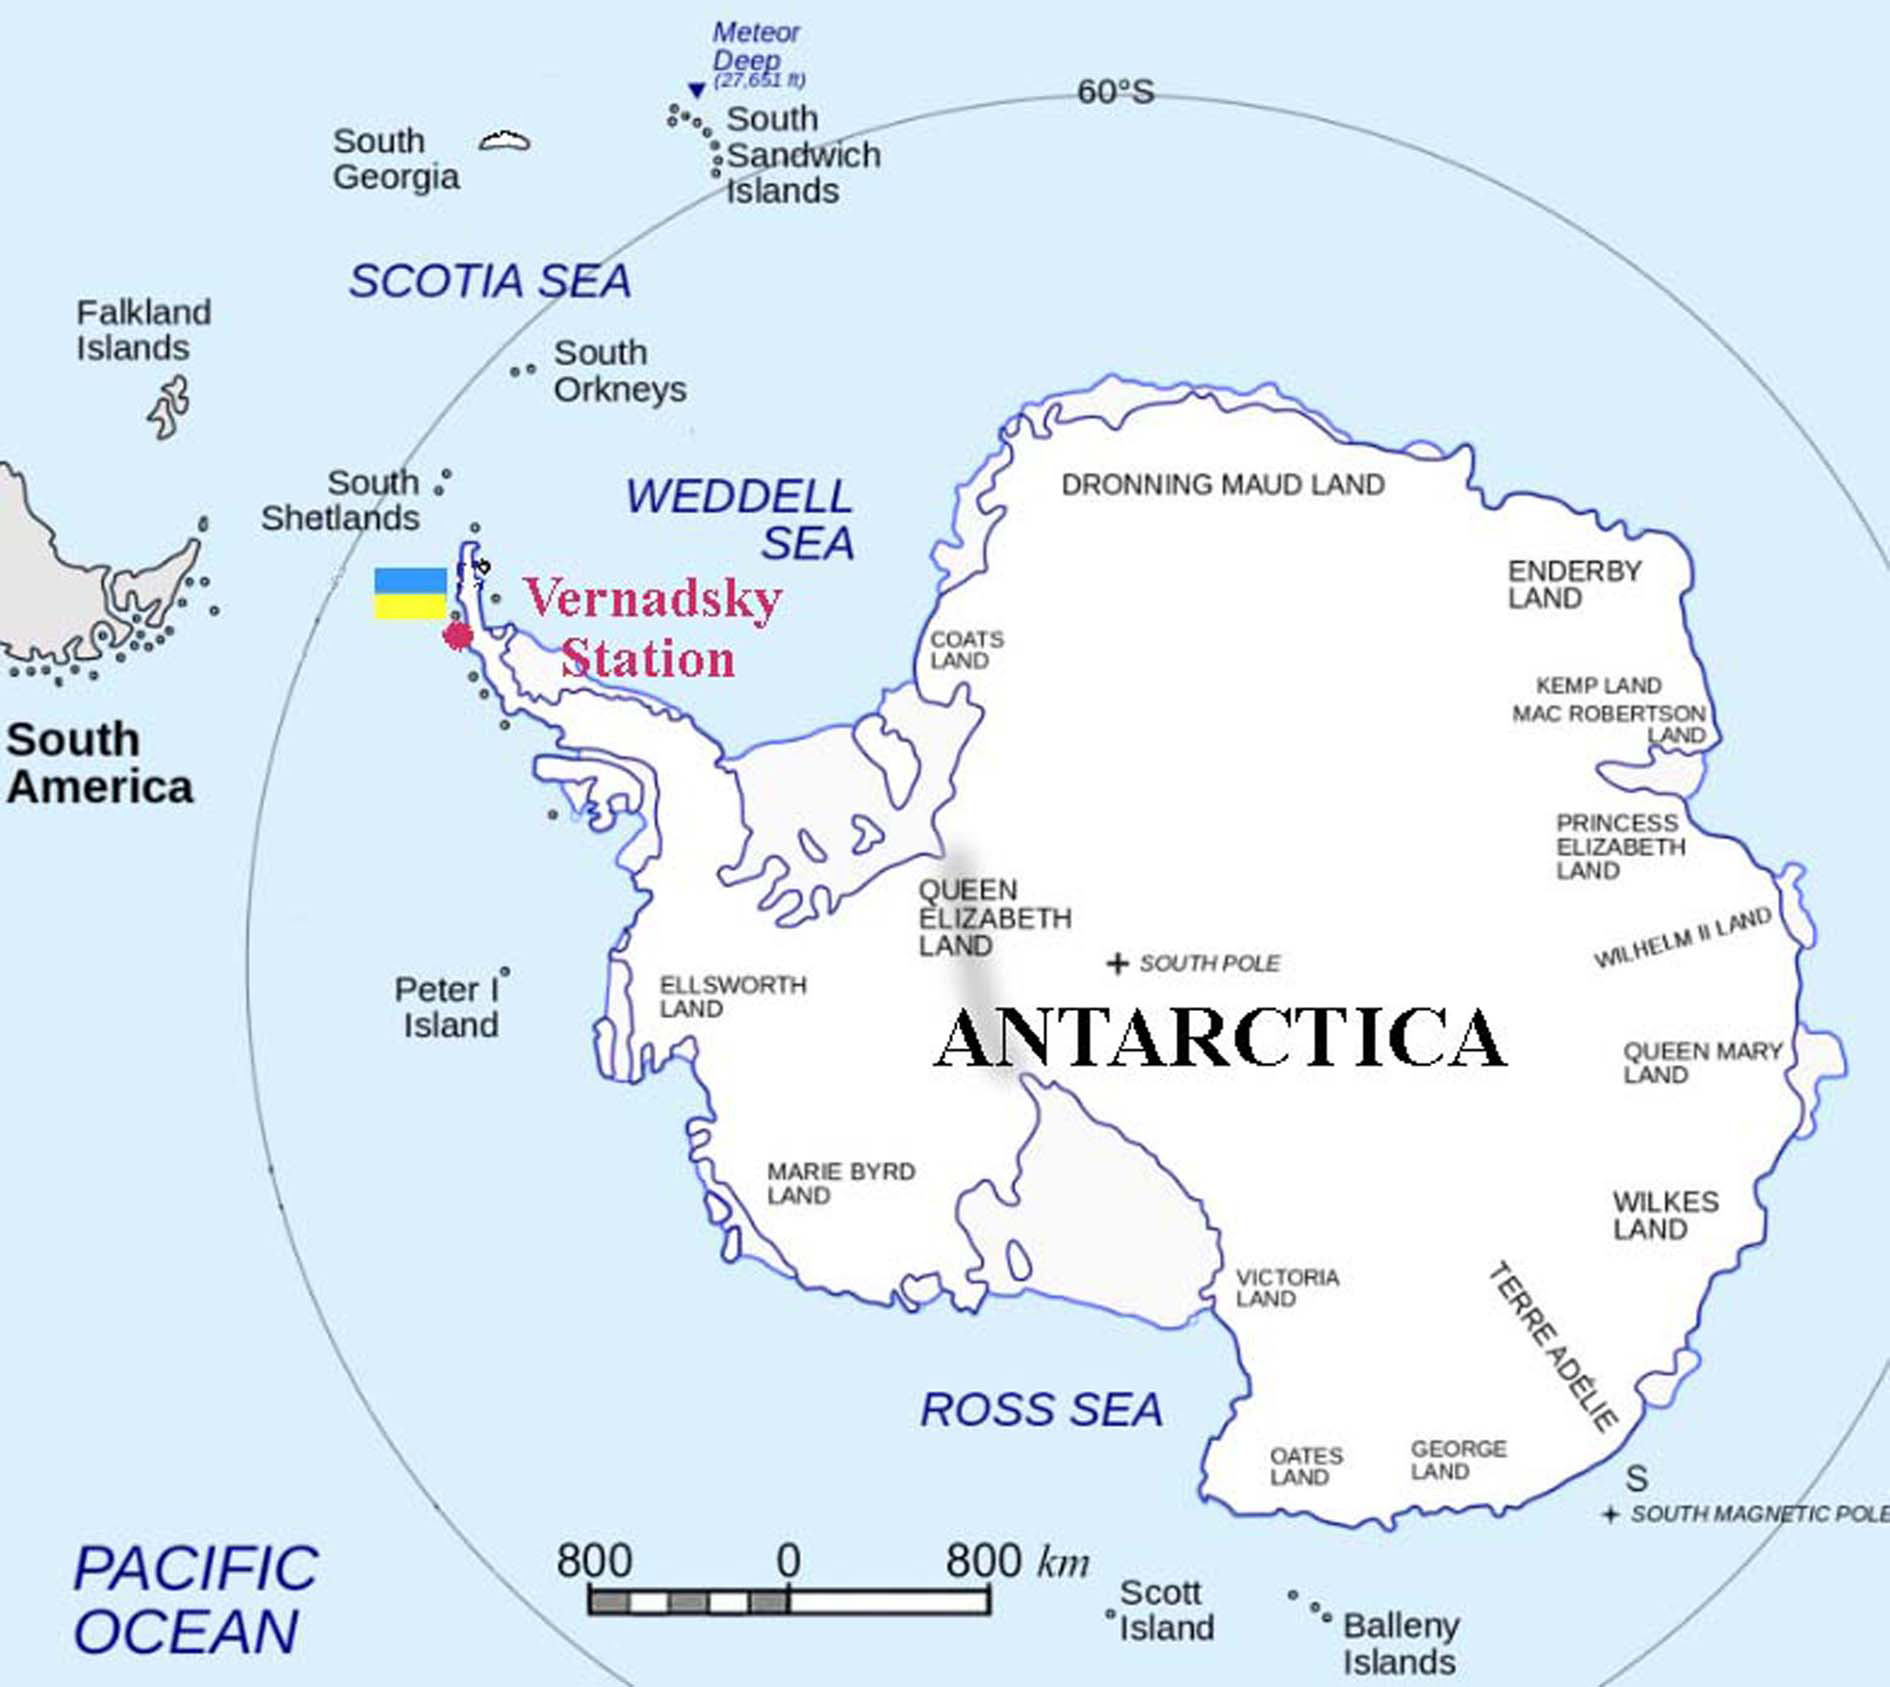
The Vernadsky Station is located off the western coast of the Antarctic Peninsula on Galindez Island, Argentine Islands Archipelago (Fig. 1). The climate of the Station is marine subantarctic, which is formed by large-scale circumpolar circulation in the atmosphere and ocean (King, Tuner 1997).
On the Antarctic Peninsula, including the Vernadsky Station, stable trends in surface air temperature increase are observed (Silva et al 2020; Turner et al. 2020; Khrystiuk et al. 2023).
In this research, we used the series of meteorological observations of near-surface air temperature and snow cover depth spanning nearly 28 years (1997-2025) from the Vernadsky Station. These data were obtained from the archive of the State Institution “National Antarctic Scientific Center” of the Ministry of Education and Science of Ukraine (NASC). These data are free to access. For 2011-2025, the data are posted on the website (http://meteodata.uac.gov.ua/), and for 1997-2010, the data can be obtained upon request (gorbachova@uhmi.org.ua). Near-surface air temperature (2 m) was recorded by automatic meteorological stations (AWS): MAWS (Modular Automatic Weather Station), Mobile Meteorological Complex “Troposphere” (this complex was developed and manufactured in Ukraine), and Vaisala AWS-310. The data were collected every three hours at standard times (00, 03, 06, 09, 12, 15, 18, and 21 UTC). The daily data for snow cover depth is measured by two snow stakes, which are installed on the meteorological site of the Vernadsky Station. This system of observation better accounts for the snow cover changes due to the topography of Galindez Island and strong winds. Snow cover depth values are read from these snow stakes by a meteorologist at 13 UTC every day.
Unfortunately, at Vernadsky Station, snow courses and research on snow characteristics at different depths are not conducted systematically. The archive of the NASC has this information for 2012-2019 (Table 1). Its analysis shows that digging snow holes did not always occur during the season of snowmelt. This limits the use of these data, since for this research, data about the density of snow cover is needed precisely during the snowmelt season. Although it should be noted that the values of snow cover density during the snow accumulation and the snowmelt seasons do not show significant fluctuations (Table 1). The exception is snow cover density, which was 0.60 g/cm3 as determined by data from November 5, 2018 on the dome of the Woozle Hill glacier. However, this value cannot be considered reliable, since it indicated that two of the snow layers had densities exceeding 1.0 g/cm3. This is an erroneous value, because the maximum density of ice is only 0.92 g/cm3 (Montero de Hijes et al. 2024). The lowest value of snow cover density was 0.32 g/cm3 as determined by data from October 31, 2015. The highest value of snow cover density was 0.39 g/cm3 as determined by data from November 22, 2012.
Table 1.
Results of research on snow and ice holes on Galindez Island in the Antarctic from the Vernadsky Station.
Determining snowmelt characteristics is possible using solar radiation observation data. This approach is widely used in various snowmelt models (Bartelt, Lehning 2002; Corona et al. 2015; Chen et al. 2020; Keenan et al. 2021). Due to the financial and technical difficulties that occurred in Ukraine in the late 20th and first two decades of the 21st century, it took years to replace expensive meteorological equipment (which had broken down) designed to measure the characteristics of solar radiation and radiation balance. Only the data series of sunlight duration were and remain continuous. The use of models requires quantitative values for the solar radiation reaching the Earth's surface. Obtaining that data became possible only in February 2019, with the installation of the Vaisala AWS-310 automatic meteorological station at the Vernadsky Station, and the configuration of the corresponding modules in 2020. With these considerations, simulating snowmelt processes using modern models is impossible for 1997-2025. Therefore, research on snowmelt processes was carried out by calculating their characteristics based on daily observation data for the snow depth and near-surface air temperature (2-m height) for 1997-2025. Characteristics such as the duration, amount, and intensity of snow melting were determined.
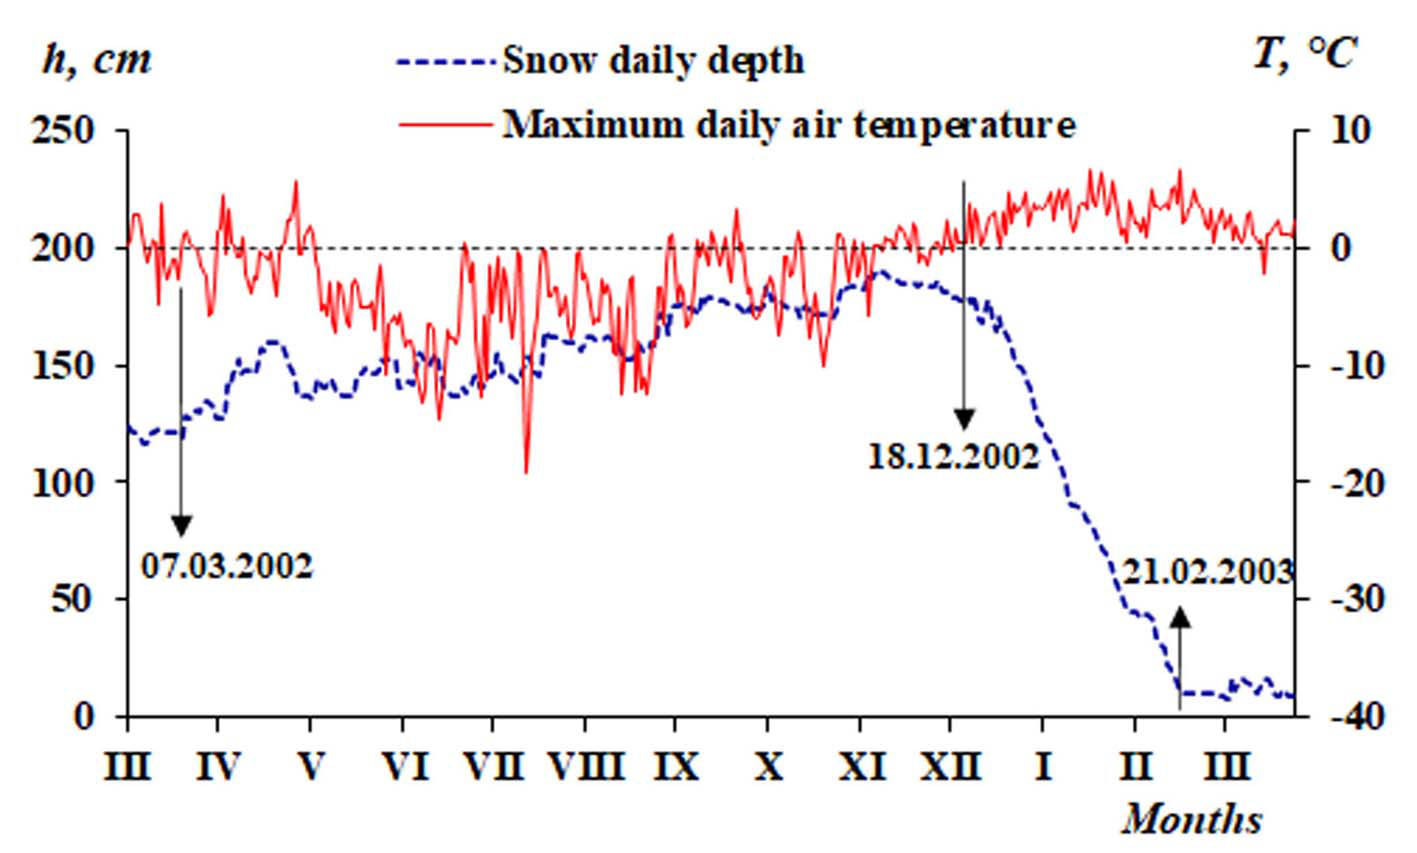
The duration of the snowmelt season was defined as the number of days from the beginning of the snowmelt process to its completion. The amount of snow melting was calculated as the difference in snow depth at the beginning and end of the melting season. Complex graphs were used to determine initial snow accumulation dates, as well as the dates of the beginning and end of snowmelt; an example is shown in Figure 2.
Fig. 2.
Example graph for determining snow cover characteristics (representing 2002-2003 at Vernadsky Station); 07.03.2002 is the initial date of snow accumulation; 18.12.2002 is the initial date of snow melting; 21.02.2003 is the final date of snow melting.
The beginning of the snowmelt period was determined from the date when there was a stable transition of the maximum daily air temperature through zero to positive air temperatures. The final date of snowmelt was taken as the date of complete clearing of the surface from snow cover, or the date when the snowmelt process stopped, but some snow cover remained. The intensity of snow melting (I, cm/day) was determined by the formula (Anderson 1968):
I = L/D (1)
where: L is the amount of snow melting (cm); D is the duration of the melting season (day).
Given that data on snow cover density are available only for the period 2012-2019 (Table 1), the determination of snowmelt intensity in water equivalent for the entire research period was carried out as follows. Information from Table 1 was used for the seasons of thawing in which measurements were made in the research snow and ice holes. The data for the snowmelt season 2018-2019 were unreliable, and thus not used. For the snowmelt season 2017-2018, the snow cover density value determined according to data from 26.10.2017 was used. For other snowmelt seasons, the mean snow cover density value for the period 2012-2018 is used, which is 0.36 g/cm3.
The intensity of snowmelt in water equivalent (Iw, mm) was calculated by the formula (Anderson 1968):
Iw = 10 • I • P (2)
where P is the weighted-average snow density (g/cm3).
The multi-year mean values of snow cover characteristics were calculated as the arithmetic mean of a series. The standard error of multi-annual mean value (SEM) was calculated by the formula (Wilks 2020):
where σ is the standard deviation; n is the number of observations.
3. Results
According to complex graphs (example in Fig. 2), the dates of initial snow accumulation, the maximum snow depth, the snow melting beginning and end (Fig. 3), and the snow depth were determined (Fig. 4). During the observation period 1997-2025, the mean snow accumulation beginning date is March 29 (±3 days). The earliest initial snow accumulation occurred on 24.02.2015, and the latest occurred on 01.05.2020. Typically, the increase in snow depth occurred before the beginning of snowmelt. During the observation period 1997-2025, only in 24% of cases did the new snow cover form on a surface free from last year’s snow, while in most years new snow accumulation occurred on top of the remnants of snow cover from the previous season.
Fig. 3.
Dates of initial snow accumulation. (1) the maximum snow depth, (2) the beginning, (3) and end (4) of snow melting at the Vernadsky Station for 1997-2025.
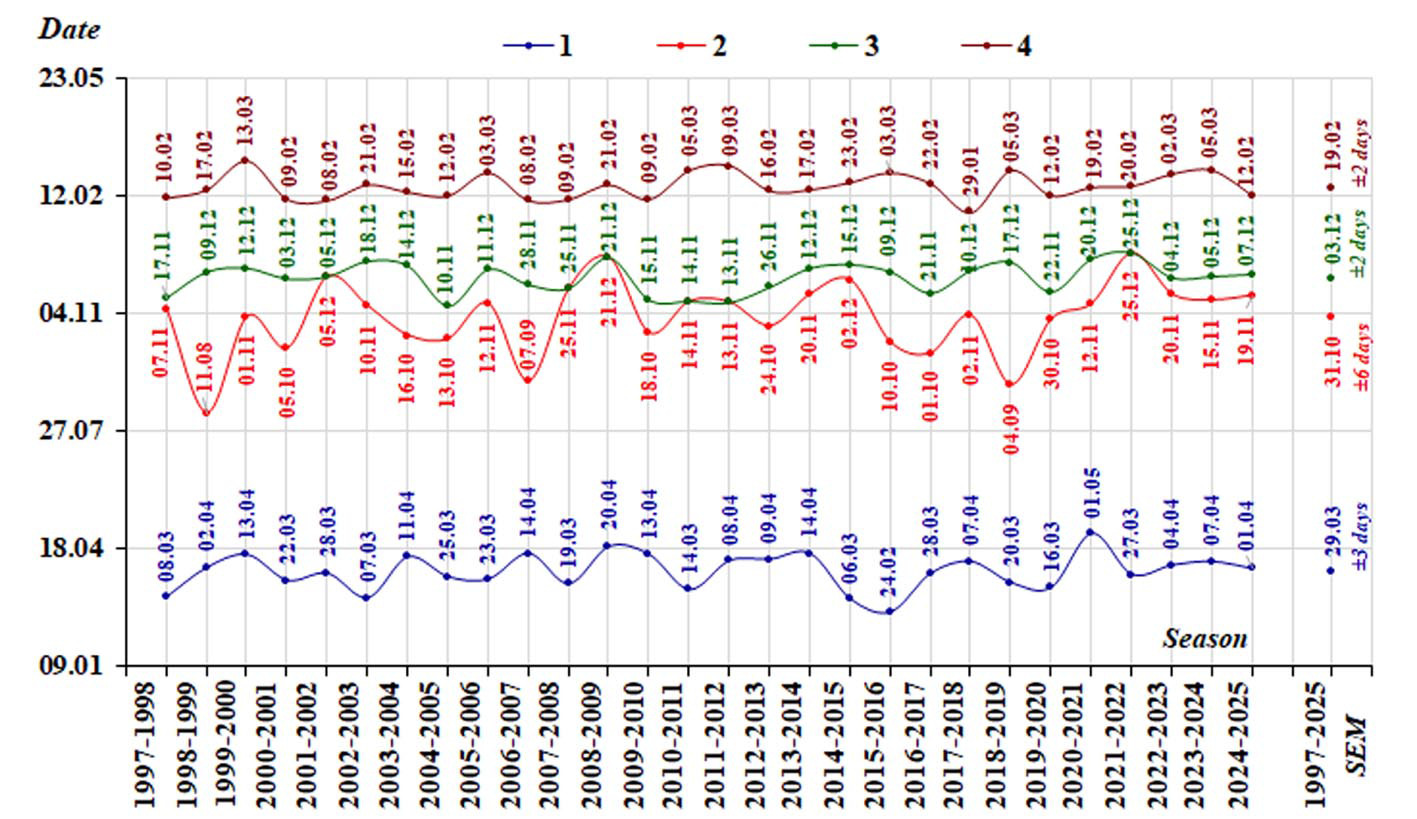
Fig. 4.
Snow depth at the Vernadsky Station for 1997-2025 (1– initial accumulation; 2 – maximum value; 3 – initial melting; 4 – final melting).
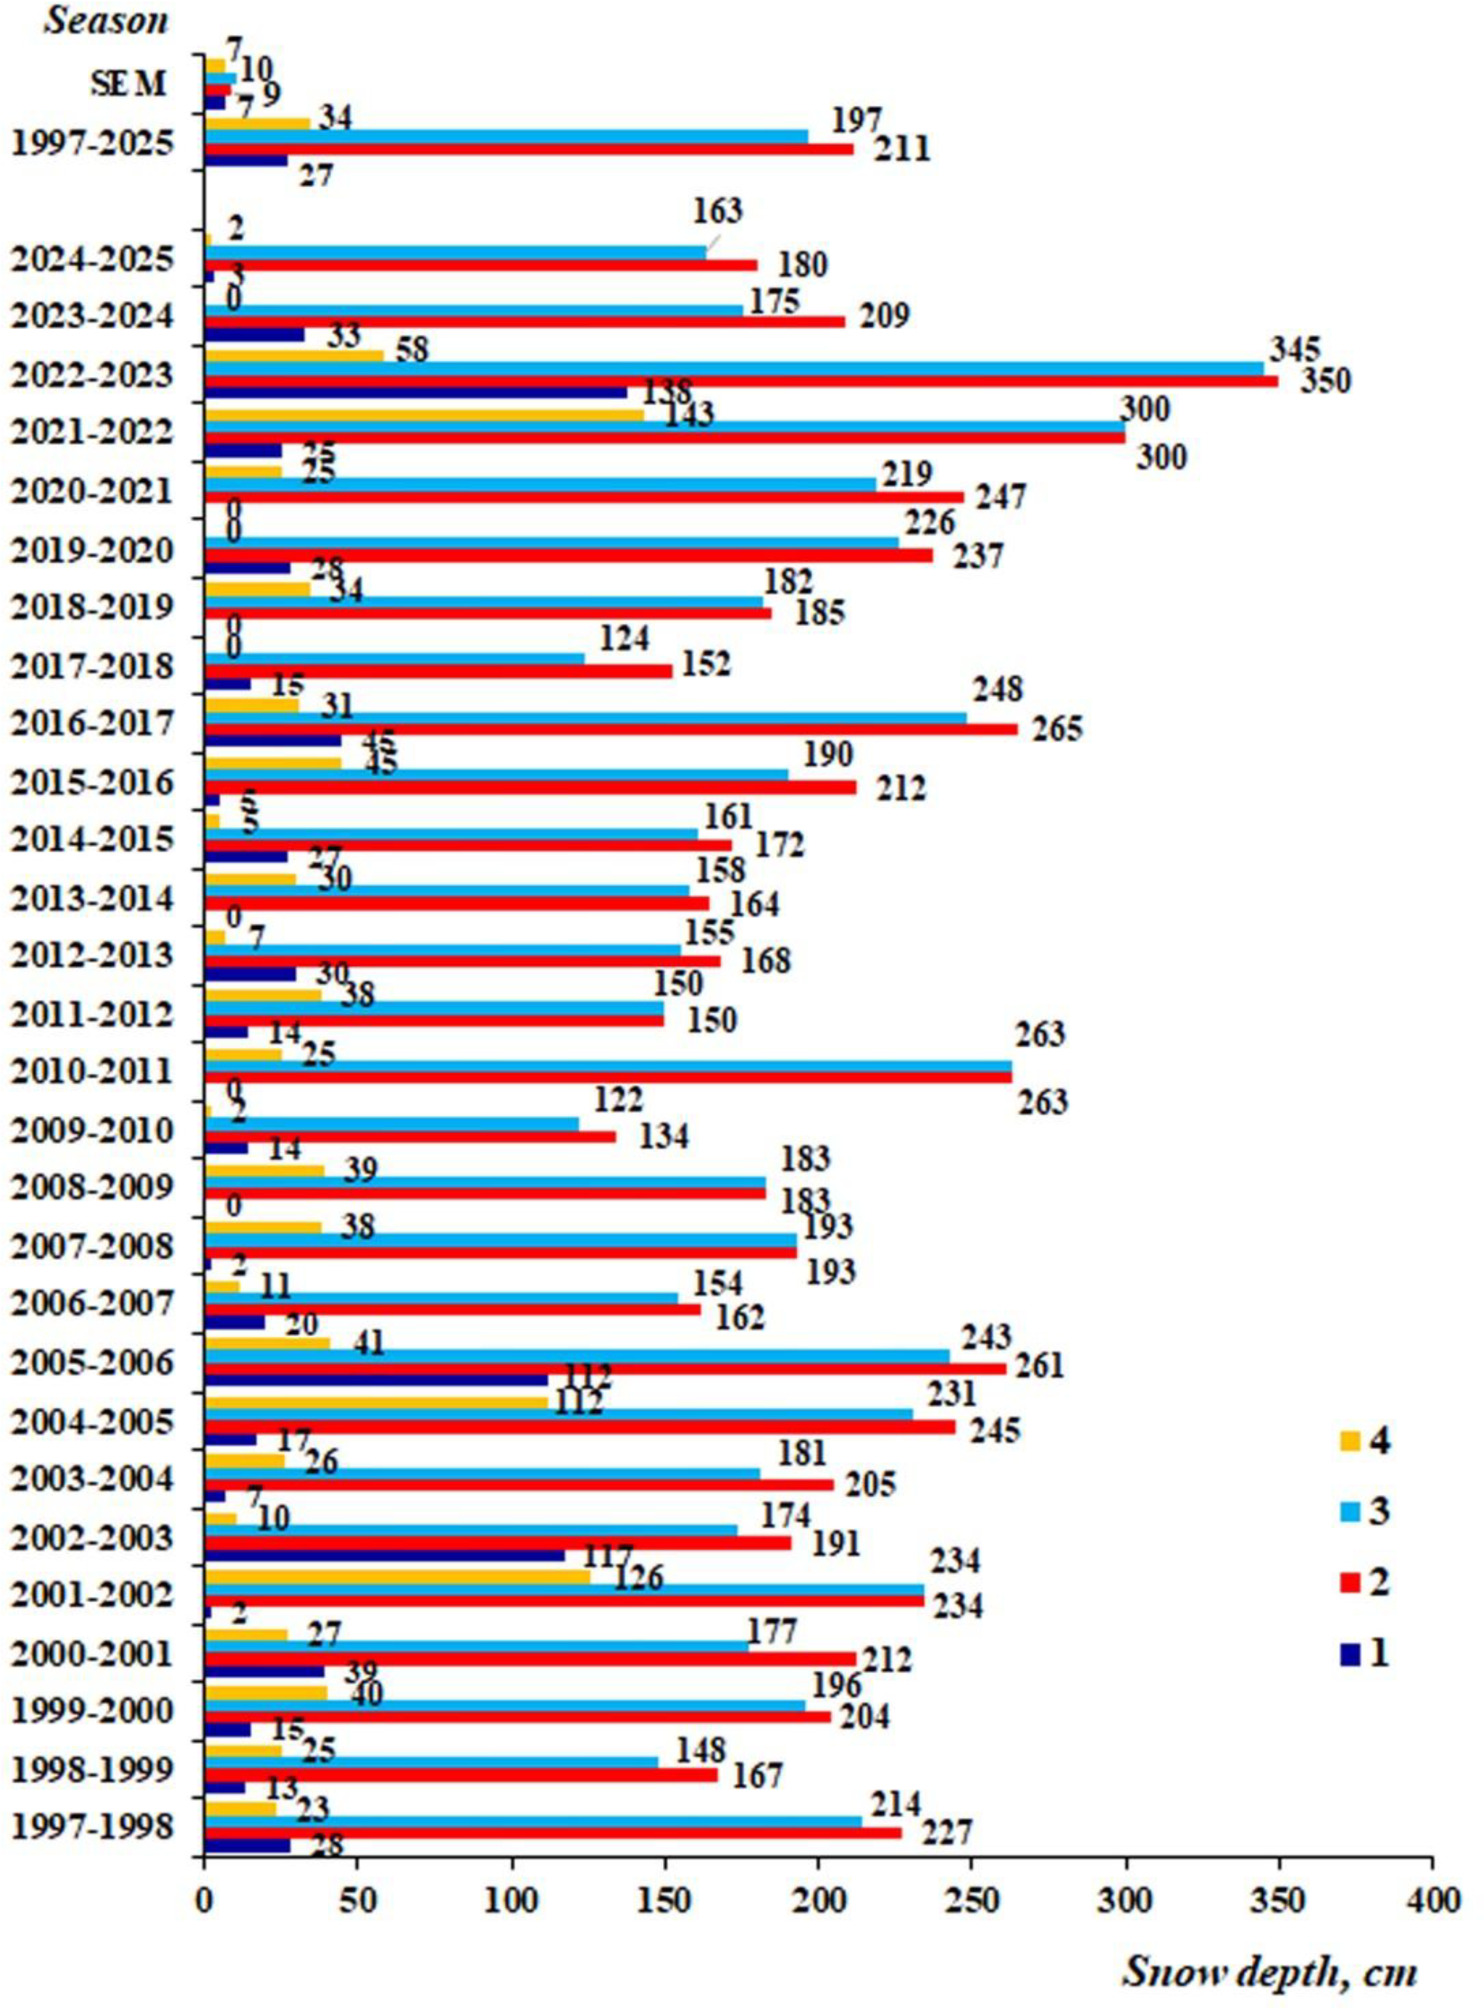
In particular, at the beginning of April 2022, the remnants of last year's snow cover reached 138 cm (Fig. 4). The multi-annual mean date of maximum snow depth is October 31 (±6 days), and the multi-annual mean maximum snow depth is 211 (±9) cm. The greatest snow depth was observed from the second decade of August to the end of December, and notably on November 20, 2022, it was 350 cm. The lowest snow depth was 134 cm, observed on 18.10.2009 (Fig. 3, 4).
Analysis of initial snow accumulation dates shows that the earliest date is 10.11.2004, and the latest is 25.12.2021. The earliest date of final snow melting is 29.01.2018, and the latest is March 12.03.2000. In summary, snow melting began between the first half of November and the end of December, continuing until the end of January to early March (Fig. 3). The multi-annual mean date of initial snowmelt is December 3 (±2 days), and its end is February 19 (±2 days). Initially, snow melting occurred under the influence of positive air temperatures during the daytime, and later the intensity of melting increased due to the transition of the mean daily air temperature through 0°C, when melting occurred throughout the day.
The results (Figs. 3 and 4) supported calculation of the duration, amount, and mean intensity of snowmelt for 1997-2025 (Table 2). The mean intensity of snowmelt (cm/day) was calculated by formula (1).
Table 2.
Characteristics of snowmelt and near-surface air temperature at the Vernadsky Station for 1997-2025.
[i] Note: * – calculated using the snow cover density values from Table 1 for the snowmelt seasons in which measurements were made of the snow layers in the research holes.
The multi-annual mean duration of snowmelt is 78 (±3) days. Depending on the air temperature regime during the snowmelt season, its duration ranged from 50 to 117 days. The amount of snow melting ranged from 108-287 cm, with a multi-annual mean of 162 (±8) cm. The mean intensity of snowmelt ranged from 0.96 to 3.26 cm/day. The lowest melting intensity (0.96 cm/day) was observed in the snowmelt season of 2011-2012, which was characterized by the longest duration (117 days), as well as relatively low air temperatures. In addition, during the season of 2011-2012, a temporary slowdown in snowmelt during the return of cold weather, as well as snowfall, was observed. The highest melting intensity (3.26 cm/day) was observed in the snowmelt season of 2022-2023, which was characterized by the highest snow depth (350 cm) (Fig. 4) and the largest amount of snow melting (287 cm), as well as relatively high air temperatures. The multi-annual mean of snowmelt intensity is 2.13 (±0.10) cm/day.
For the period 1997-2025, the intensity of snowmelt in water equivalent was calculated by the formula (2) using data on snow cover density from Table 1. In calculations for the seasons in which snow density was not measured, the mean snow density for the period 2012-2018 was used. The intensity of snowmelt in water equivalent ranged from 3.45 to 1.7 mm/day; the multi-annual mean was 7.68 (±0.36) mm/day.
4. Discussion
Based on ground observations over a long period, the amount, duration, and mean intensity of snowmelt at the Vernadsky Station were determined for the first time, supplying new knowledge of these characteristics. The approximation of the intensity of snowmelt in water equivalent is also the first reliable knowledge of this variable. The results allow us to assess the reliability of snowmelt characteristics obtained using other methods. Luis et al. (2022) used Scatterometer-based backscatter data and showed that on the Antarctic Peninsula, the mean snowmelt duration was 70 days during 2000-2018. This result is in good agreement with the calculations given in Table 2 for the Vernadsky Station; specifically, the mean snowmelt duration was 78 days. Zhu et al. (2023), using SAR images, showed that from 2015 to 2021, the extent and duration of snowmelt have been increasing in the Antarctic Peninsula. Therefore, the next step of the research is to determine the trends in snowmelt characteristics, which are given in Table 2, as well as their comparison with trends obtained by other methods.
We emphasize that separate data about snow density are not sufficient either for understanding its formation or for use in any modeling of snowmelt processes. The results of this study yield only approximate knowledge about the processes and values of snowmelt at Vernadsky Station. The situation can only be improved by organizing systematic observations from snow holes.
5. Conclusions
Typically, in Antarctica, snowmelt studies are conducted using satellite data and reanalysis, which conveys the spatial distribution of snowmelt characteristics and eliminates certain limitations of ground-based observations. However, remote approaches still have difficulties in determining snowmelt values in regions with complex terrain, typical of Galindez Island, where the Vernadsky Station is located. Ground-based observations remain an important and reliable source of information. In this article, the characteristics of snow cover melting were determined based on observations of snow depth and air temperature (at 2-m height) at the Vernadsky Station for 1997-2025.
The multi-annual mean initial snow accumulation date is March 29 (±3 days). The multi-annual mean date of maximum snow depth is October 31 (±6 days), and the multi-annual mean maximum snow depth is 211 (±9) cm. The multi-annual mean date of initial snowmelt is December 3 (±2 days), and its end is February 19 (±2 days). The duration of snowmelt ranged from 50 to 117 days; the multi-annual mean was 78 (±3) days. The amount of snow melting ranged from 108-287 cm, with a multi-annual mean of 162 (±8) cm. The mean intensity of snowmelt ranged from 0.96 to 3.26 cm/day, in water equivalent approximately 3.45 to 11.7 mm/day; the multi-annual mean was 7.68 (±0.36) mm/day.
At Vernadsky Station, observations of snow cover density need to be improved. Further, the results obtained in this research represent the first knowledge about snowmelt characteristics at the Vernadsky Station. The approach used in our article, despite its apparent simplicity, ensures the reliability of the conclusions, as it uses ground-based observation data. These results can be used in other investigations, for example, for the comparison and generalization of snowmelt processes on the Antarctic Peninsula, etc. Acknowledgment
The investigation was conducted within project № H/11-2024 from 23.08.2024 “Relations between parameters of solar radiation, snow cover and surface near Akademik Vernadsky Station” that was funded by the State Institution “National Antarctic Scientific Center” of the Ministry of Education and Science of Ukraine.