1. Introduction – overview of climate change implications on high-altitude regions
Climate change has emerged as the biggest threat in the past 40 years and has been responsible for impeding nations' abilities to achieve sustainable development goals (IPCC 2007). Evidence of the impacts and risks associated with climate change is strongest for natural systems (IPCC 2017). It has been projected for the Hindu Kush Himalaya (HKH) that by the end of the 21st century, the median annual air temperature will further increase by 0.8-5.7°C (Dahri et al. 2021). Future projections for the Himalayan regions are highly conflicting and spatially variable (Dahri et al. 2021). In India, glaciers cover a region from 26°N, 72°E to 36°N, 96°E (Raina, Srivastava 2008), providing water to 50-60% of the population living downstream. The Himalayan region is potentially one of the most critical parts of the world when considering the social and economic impacts of glacier shrinkage (Barnett et al. 2005). A study observed that between 2003 and 2009, Himalayan glaciers lost an estimated 174 gigatons of water each year and retreated at a rate of 0.3 to 1.0 meters per year (with the most extreme melting occurring in the east), a rate faster than the global average ice mass melt (Mani 2021). Climate change is responsible not only for temperature and precipitation variation but also disturbs the hydrological cycle. This variation impacts glacier mass by causing melting and loss of seasonal snow, thereby affecting the stability of water resources in the region. Any changes in water resources, including reduction in availability or variation in flow patterns resulting from altered seasonal precipitation, will directly influence the water supply and consequently reduce water availability for agriculture or domestic use. Thinning of glaciers may also affect hydropower production, a key source of renewable energy for the region. Factors that will affect future water availability in Himalayan rivers include glacier melt, groundwater extraction, reservoir construction, decline in precipitation, population growth, snowmelt, springs, and permafrost thaw. These concerns have made the Himalayan region a focus of research for the past decade (Chandel, Ghosh 2021). In short, the melting induced by climate change will cause a cascading effect, making the region more vulnerable to disasters such as flash floods, landslides, soil erosion, and glacial lake outburst floods. Initially, melting glaciers may increase groundwater levels downstream, but over time, glaciers will retreat and generate less meltwater, exacerbating water shortages and endangering the lives of the downstream population (Ó Dochartaigh et al. 2019). With the fast-growing need for fresh water and increasing awareness of its sustainable use, studies on snow, ice, and glaciers have acquired considerable importance (Kesarwani et al. 2015). Knowledge of snow and glacier-fed watersheds and associated glaciological elements is significant for the sustainable use and protection of Himalayan water resources. The purpose of this literature review is to systematically examine existing research related to the impacts of climate change on high-altitude regions. It is critical to study glacio-hydrological functions and their impact on water availability. Although numerous studies have attempted to analyze recent climate change, project future changes, and model the underlying impacts on the hydrological regime and water availability for the Himalayan region, there are still significant gaps in data, information, and knowledge that limit our understanding of the basin's hydro-meteorological regime. The present study is an attempt to understand temperature and precipitation trends in the Himalayas for improved understanding of climate change impacts on regional hydrology. The study also explores the suitability of various hydrological models used in the region. The study highlights climate-driven changes that influence hydrological processes, while also discussing key challenges in Himalayan hydrological studies, such as data scarcity, complex terrain, limited long-term observations, and uncertainties associated with climate inputs, model structure, and parameterization.
2. Literature review – methodology
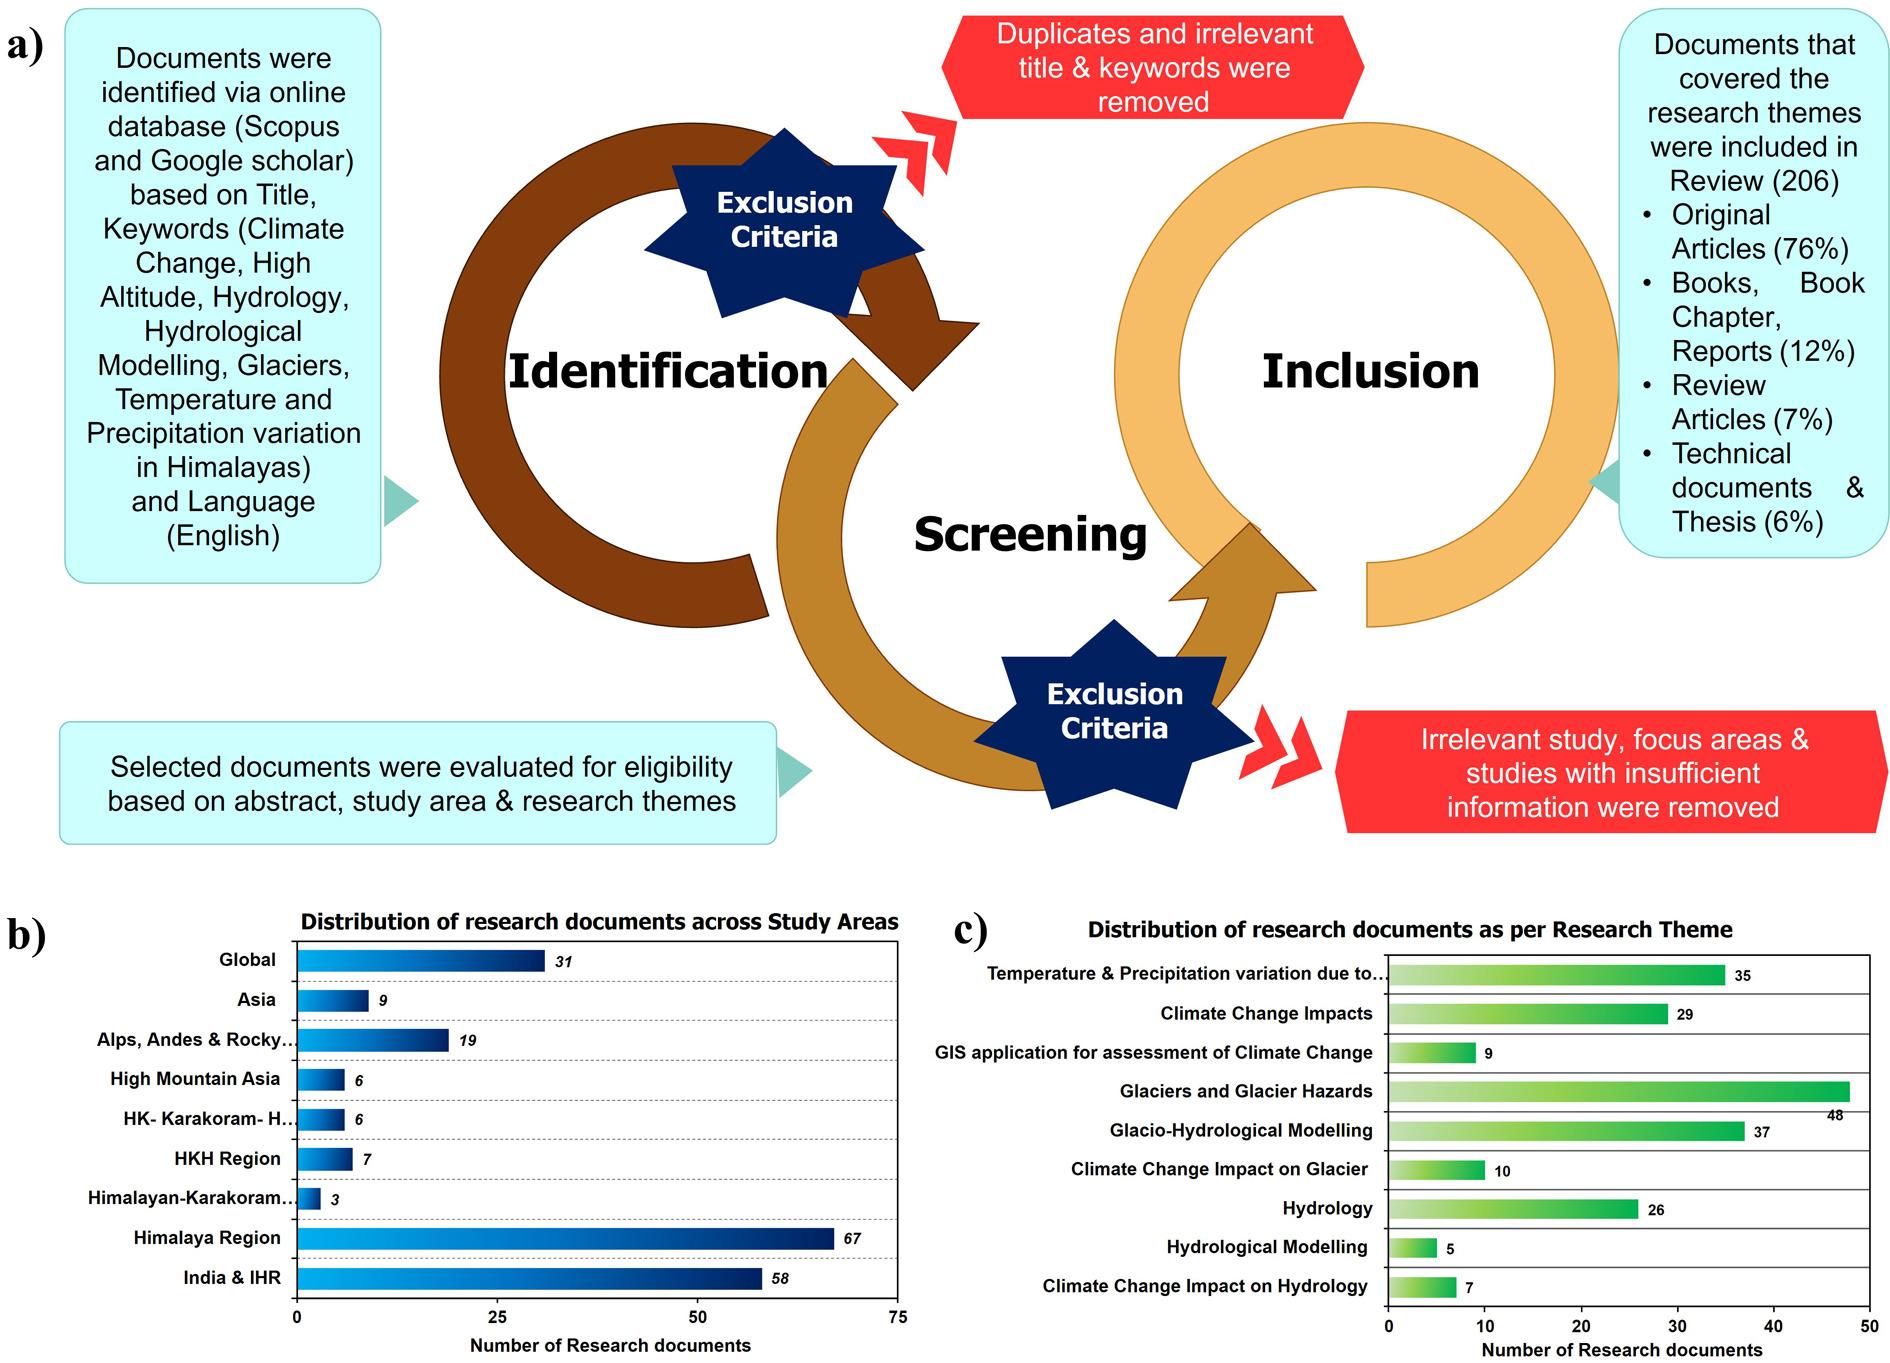
To understand the impacts of climate change on high-altitude regions, relevant literature was identified through online databases such as Scopus and Google Scholar. The initial identification of literature was based on titles and keywords. The keywords included, but were not limited to: climate change, high altitude, hydrology, hydrological modeling, glaciers, and temperature and precipitation variation in the Himalayas. The literature review methodology is explained in Figure 1a. A few papers were excluded based on the study areas, and language of the paper. Literature with insufficient information was also excluded. Finally, a total of 206 documents was selected for this review, including original articles (76%), books, book chapters and reports (12%), review articles (7%), and technical reports and theses (6%). These 206 documents were then broadly categorized by their study areas, such as the Himalayan region, HKH (Hindu Kush Himalaya), and IHR (Indian Himalayan Region) as depicted in Figure 1b. For a broader perspective, global studies were also included for general explanation. Further classification was done based on research themes (Fig. 1c). The main research themes we focused on were: climate change impact on hydrology, hydrological modeling, climate change impact on glaciers, glacio-hydrological modeling, glaciers and glacier hazards, geographic information system (GIS) applications for the assessment of climate change, climate change impacts, and temperature and precipitation variation associated with climate change. The main aim was to review literature focused on climate change impacts on high-altitude regions by altering cryospheric and hydrological components. This structured methodology ensures comprehensive coverage and minimizes bias by following a systematic, repeatable, and transparent process.
3. High-altitude Himalayan hydrology – key features
The Himalayan region is characterized by elevation variation, diverse precipitation patterns, and temperature profiles from the foothills to the Himalayan crest, with average elevation in the Tibetan plateau (Chandel, Ghosh 2021). The foothills are warm, and the higher altitudes are cooler. The region receives rainfall from two precipitation systems: the Indian summer monsoon and western disturbances. The central and eastern parts of the Himalayas receive rainfall from the Indian summer monsoon from June to September, whereas western disturbances and the Indian summer monsoon contribute to precipitation in the western Himalayas (Bookhagen, Burbank 2010). The high-altitude Himalayan region acts as a barrier and is responsible for precipitation in the foothills. The majority of basins in the region are of the summer accumulation type, but the western Himalayas are of the winter accumulation type (Lutz et al. 2014). Snow and glaciers are important hydrological components in the Himalayas, affecting the livelihood of about a billion people residing in the basins of the Indus, Ganges, and Brahmaputra rivers (Wester et al. 2019). The water from these rivers not only contributes to the water requirements of the downstream populations but is also essential for food production, energy production, and ecosystem sustenance. The water resources generated from these rivers are responsible for the gross domestic products (GDP) of India, Nepal, Pakistan, and China (Chandel, Ghosh 2021). Snowpacks and glaciers are considered highly sensitive indicators of global climate change. They are predominantly sensitive to the rising temperatures affecting the Himalayan hydrology in several ways, namely, glacier retreat, permafrost degradation, lesser snowfall, reduced mountain snowpack, and early onset of melt, which consequently alter the patterns of river flow (Immerzeel et al. 2010; Beniston, Stoffel 2014; Lutz et al. 2014; Lutz et al. 2016). Various studies have confirmed that the majority of glaciers in the region is facing decline in their mass and even worse conditions are predicted for the future (Brun et al. 2017; Azam et al. 2018; Chandel, Ghosh 2021; Schmale et al. 2017).
4. Climate change in the Himalayas
The task of understanding climate change trends starts with the basic understanding of the term ‘climate,’ which refers to the long-term average of weather conditions (temperature, precipitation, humidity, wind speed, and direction) observed at a given location (Shekhar, Singh 2014). Climate change refers to any long-term deviation in these climate parameters caused by natural variability or human activities. The phrase ‘long-term’ is consistent with the definition of climate as an average of its parameters over a duration of 30 years (WMO 2017). All available records of temperature and climate models show a near-surface temperature increase, particularly in recent decades (IPCC 2007; IPCC 2018).
4.1. Historical climate observations and trends in the IHR region
Various studies have confirmed that elevated warming negatively affects the glacio-hydrology of snow and ice-fed river catchments, especially in the high-altitude Himalayan region (Shekhar, Singh 2014; Wester et al. 2019). This impact is also seen in the hydrological balance of many watersheds globally (Xu et al. 2009; Immerzeel et al. 2010). It is now well-established that the Earth’s surface has warmed over the past 100 years, primarily due to anthropogenic activities (IPCC 2021). Changes in many components of the climate system, such as precipitation, snow cover, sea ice, and extreme weather events, have also been observed (NOAA 2020). These changes exhibit remarkable regional variations around the globe. Various studies have shown that high-altitude regions are especially sensitive to climate change because they experience higher mean annual rates of warming (IPCC 2007; Xu et al. 2009; Lesher 2011; Pepin et al. 2015). Studies assessing past temperature trends in the Himalayan region indicate that surface air temperatures have increased in the Himalayas since 1970 (Bhutiyani et al. 2007; Immerzeel et al. 2010). Future predictive studies estimate an increase of 0.01°C to 0.75°C per year by 2050 (Xu et al. 2009; Kraaijenbrink et al. 2017). Bhutiyani et al. (2007) observed historical temperatures from three meteorological stations and reported higher rates of warming during winters in the northwestern Himalayas. Temperature trends observed by various studies are given in Table 1.
Table 1.
Summary of reported historical and projected temperature changes across the various Himalayan regions based on observational records, satellite and reanalysis datasets, and climate model projections. Values represent mean or extreme temperature trends over different analysis periods as reported in the cited studies.
| Study area | Study period | Temperature change | Variable | Data collection method | Source |
|---|---|---|---|---|---|
| Himalayan region | 1950 to 1999 | +2.5°C | Meantemperature | Observation and IPCC-AR4 | Rao et al. (2016) |
| 21stcentury | +9°C | Meantemperature | Projected: IPCC-AR4 | Rao et al. (2016) | |
| 21stcentury | +0.3-0.9°C | Meantemperature | Projected: RCP8.5 model | Dimri et al. (2018) | |
| 1982-2006 | +1.5°C | Mean temperature | Observations | Shrestha et al.(2012) | |
| Hindu Kush Himalayas (HKH) | 1901-2014 | 0.1°C/decade | Mean temperature | Observations | Sabin et al. (2020) |
| 21stcentury | +2.6-4.6°C | Mean temperature | Projected: CMIP5 | Sabin et al. (2020) | |
| Karakoram andNorthwest Himalaya | 2066-2095 | +1.6-1.8°C | Meantemperature | Projected: RCP8.5 | Sanjay et al. (2017) |
| Indian Himalayan Region (IHR) | 1971-2003 | +0.22°C/decade | Mean temperature | Observed: Station data | Kothawale, Rupa Kumar(2005) |
| 1986-2015 | +0.15°C /decade | Mean temperature | Observed: Station data | Le Masson, Nair (2012) | |
| 2080 | +3.84°C | Mean temperature | Projected: Climate Model | Krishnan et al. (2019) Negi et al. (2021) | |
| 2011-2040 | +1.18°C | Maximum temperature | Projected: General Circulation Models (GCMs) | Sharma, Goyal (2020) | |
| 2011-2040 | +0.54°C | Mean temperature | Projected: General Circulation Models (GCMs) | Sharma, Goyal (2020) | |
| 2011-2040 | +1.92°C | Minimum temperature | Projected: General Circulation Models (GCMs) | Sharma, Goyal (2020) | |
| Western Himalaya | 1901-2003 | +0.9°C | Minimum temperature | Observed & Reanalysis Modelled data | Dash et al.(2007) |
| 1901-2003 | +1.9°C | Minimum temperature | Observed & Reanalysis Modelled data | Dash et al.(2007) | |
| 1985-2009 | +1.41°C | Maximum temperature | Space based Observations(GIOVANNI) | Kumar et al. (2014) | |
| 1985-2009 | +1.63°C | Minimum temperature | Space based Observations(GIOVANNI) | Kumar et al. (2014) | |
| 1985-2009 | +1.49°C | Mean temperature | Space based Observations(GIOVANNI) | Kumar et al. (2014) | |
| 1979-2007 | +0.26 ±0.09°C/ decade | Mean temperature | Space based observation | Gautam et al.(2010) | |
| Northwest Himalaya | 1901-2000 | +0.16°C | Mean temperature | Observation and Space based (NOAA) study | Bhutiyani et al. (2007) |
| 1876-2006 | +0.11°C | Mean temperature | Observation(IMD, SASE and IAF Stations) | Bhutiyani et al. (2007) | |
| 20thcentury | +0.009-0.064°C | Mean temperature | Observation(IMD Stations) | Singh et al. (2008a) | |
| Eastern Himalaya | 1960-2000 | +0.1°C to 0.9°C | Maximum temperature | Observation (TocklaiTea Research Association (Jorhat)) | Jhajharia, Singh (2011) |
| 1960-2000 | +0.2°C to 0.8°C | Mean temperature | Observation (Tocklai Tea Research Association (Jorhat)) | Jhajharia, Singh (2011) | |
| 1960-2000 | +0.1°C to 0.6°C | Minimum temperature | Observation (Tocklai Tea Research Association (Jorhat)) | Jhajharia, Singh (2011) | |
| 1900-2002 | +0.6°C | Mean temperature | Modelling based study (ClimateResearch Unit (CRU) dataset) | Immerzeel (2008) | |
| 2050 | +2.9°C | Mean temperature | Projected: Modelling based study (HadRM2 Simulations) | Shrestha, Devkota (2010) | |
| 2050 | +4.3°C | Mean temperature | Projected: Modelling based study (PRECIS simulations) | Shrestha, Devkota (2010) |
Assessment of historical precipitation in the Himalayas shows both positive and negative trends (Ye et al. 2007a; Immerzeel et al. 2010) (Table 2). A study by Nepal (2016) based on model assessments showed variation in snowfall patterns, snowmelt, discharge, and evapotranspiration, estimating that these variations are due to sensitivity to climate change. Studies conducted over the entire Indian Himalayan Region (IHR) suggest that increasing human activities have led to unprecedented changes in the earth’s delicate climate system (Sharma et al. 2019). Changes in temperature and precipitation patterns will significantly impact high-altitude hydrology in the region. The net hydrologic impacts of climate change on high-altitude lakes have also been observed, showing dependence on their proximity to glaciers, lake elevation, and whether climate changes are predominantly in temperature or precipitation (Thayyen, Gergan 2010; Ahmed et al. 2022). Our understanding of hydro-meteorological regimes, particularly at the sub-basin scale, is limited by the lack of significant data and information, and knowledge gaps. In the western Himalayas, numerous studies have been conducted to examine recent climate change, project future changes, and model the impacts on the hydrological regime and water availability (Immerzeel et al. 2013; Hasson et al. 2017; Hasson et al. 2019; Lutz et al. 2019; Dahri et al. 2021). However, accurate assessments are challenging because in situ observations are very scarce and the strong influence of the innately complex climate systems interacting with very high orographic features (Dahri et al. 2021).
Table 2.
Reported trends in precipitation across the Himalayan, Hindu Kush–Himalayan, and associated sub-regions based on observational records and climate model projections. The table summarizes study periods and the direction of precipitation change (increasing or decreasing) as documented in the cited literature.
| Study area | Study period | Precipitation variation | Source |
|---|---|---|---|
| Himalayas | 1982-2006 | Increasing | Shrestha et al.(2012) |
| Hindu Kush Himalayas(HKH) | 1951-2014 | Increasing | Krishnan et al.(2019) |
| 1901-2099 | Increasing | Panday et al. (2015) | |
| Indian Himalayan Region (IHR) | 2011-2040 | Increasing | Sharma, Goyal (2020) |
| Western Himalaya | 1951-2007 | Increasing | Krishnan et al.(2019) |
| 1998-2016 | Increasing | Krishnan et al.(2019) | |
| 1975-2006 | Decreasing | Guhathakurta, Rajeevan (2008) Dimri, Dash (2012) | |
| 1866-2006 | Decreasing | Bhutiyani et al.(2009) | |
| Eastern Himalayas | 2000-2100 | Increasing | Immerzeel(2008) |
| 1979-2100 | Decreasing | Singh, Goyal (2016) | |
| 1951-2007 | Decreasing | Saikiaet al. (2013) |
4.2. Evidence of temperature rise, precipitation changes, and extreme events
Temperature can represent the energy exchange between longwave and shortwave radiation; therefore, temperature change is considered a good indicator of changing climate globally (Bhutiyani et al. 2007). Meteorological observations worldwide show an increase of 0.85°C from 1885 to 2012 and an increasing trend of 0.05°C per decade in global mean temperature (Diaz, Bradley 1997; Easterling et al. 1997; Barry 2001; Folland et al. 2001; IPCC 2013; NOAA 2020). The warming trend is not uniform globally, with inconsistencies observed in mountainous regions due to the unavailability of sufficient long-term in situ observations and complex topographic conditions (Pepin et al. 2015). Studies based on instrumental data suggest that the Himalayan region has experienced a warming trend more than twofold greater than the global average (Shrestha et al. 1999; Kothawale, Rupa Kumar 2005; Bhutiyani et al. 2007; Kothawale et al. 2010; Krishnan et al. 2020). The temperature trend has increased in the past decades, with this unusual warming trend attributed to anthropogenic greenhouse gas (GHG) emissions and deforestation, which are suggested to be dominant climate forcing agents (Shrestha et al. 1999; Kothawale et al. 2010; Zemp et al. 2019). In a study to understand past temperature trends, increases in average annual temperature and average annual maximum temperature have been reported (Huddleston et al. 2003; Bhutiyani et al. 2007; Palazzi et al. 2019). This increase is several-fold higher than the rise in the global average temperature. Another study based on previous meteorological data sets from the Indus and Ganges basins suggested rises of 0.50°C and 0.44°C, respectively (Singh et al. 2008a). A study conducted over the western IHR for the period from 1971 to 2007 suggested a warming rate of 0.46°C per decade, higher than the 0.20°C per decade observed for the rest of India (Kothawale, Rupa Kumar 2005; Sharma, Goyal 2020).
In recent decades, several studies have been conducted for the northwestern Himalayas using reanalysis datasets; the result shows an increased rate of warming in the region (Dimri, Dash 2012; Kumar et al. 2014). A study conducted in the central Himalayas for the period 1967-2007 using a meteorological dataset suggests an increase in the annual mean temperature of 0.49°C (Singh et al. 2013). A study conducted by Singh et al. (2016) found that precipitation is a relatively less-studied parameter for assessment of climate change. Since the precipitation data is limited no visible trend is observed for IHR precipitation, unlike temperature. Few studies suggest that, in comparison to moderate rainfall events, extreme rainfall events have increased significantly in IHR. Whereas in the northwestern Himalayas in the Indus basin (IHR) a significant increase in precipitation has been observed (Shrestha et al. 2000; Goswami et al. 2006; Nandargi, Dhar 2011). In another study conducted by (Bhutiyani et al. 2009) in northwestern IHR using the meteorological dataset from 10 weather stations suggests a decrease in annual and monsoon precipitation and an increase in winter precipitation. Whereas another study (Dimri, Dash 2012) reported a contrasting trend, indicating an insignificant decrease in winter precipitation. The study conducted for Uttarakhand & Himachal Pradesh shows a significant decrease in annual precipitation. Whereas the study for the western (Jammu & Kashmir, J&K) and eastern parts of IHR shows an increasing trend in precipitation (Singh, Goyal 2016). Studies conducted by (Kothawale et al. 2010), have also suggested temperature variations in the region. The temperature trends across the central Himalayan region (Nepal) exhibit significant spatial variation. There is a visible warming trend over the majority of the Himalayan and middle mountainous areas. On the contrary, the Terai and Siwalik regions display comparatively smaller warming trends, and in some cases, there are even observable cooling trends. This spatial distribution of maximum temperature trends, as highlighted by Shrestha et al. (1999), underscores the complexity of climate patterns in the central Himalayas, with distinct warming patterns in mountainous terrains and varying trends in the lowland regions. A study conducted in the central Himalayas (Nepal) from 1971 to 1994 using the temperature data from 49 stations shows a warming trend of 0.068 to 0.128°C in most of the middle mountain and Himalayan regions. The study revealed that the southern plain region shows a warming trend of 0.038°C per year, along with increased variation in rainfall patterns in the region. Global warming and its impact on the hydrological cycle and nature of hydrological events have posed an additional threat to the region (Mall et al. 2006).
Extreme events like flash floods, flooding from monsoon rainfall, lake outbursts, landslides, and avalanches may be induced by climate change (National Research Council 2012). Mainly, the monsoon flood is caused by heavy rains, but other factors such as snowmelt and changes in land use may enhance the scale of the event, making it more disastrous (Pramanik, Bhaduri 2016). The water resources of snow-dominated regions such as the Himalayas are adversely impacted by climate change (Barnett et al. 2005; Piao et al. 2010; Chen et al. 2016; Roe et al. 2017; Huss, Hock 2018; Chandel, Ghosh 2021). Increasing warmth and humidity in daily weather, erratic rainfall patterns, extension of the normal winter season, and increasing incidences of floods, drought, and cyclones are some of the common observations, reflecting changes in normal atmospheric circulation and climate change predictions (IPCC 2007). Many studies have been conducted to observe a particular trend in precipitation patterns over this region. The results suggest that precipitation trends are sensitive to location and the methodology used for assessment, along with the elevation of the meteorological stations that have been used for collection of data. It has been observed that the region has sparse meteorological stations, and the available stations are at low altitudes (Palazzi et al. 2013). This situation results in low-altitude bias, and snow measurements at all altitudes are typically fairly error-prone (Winiger et al. 2005; Hunt et al. 2020).
4.3. Impact of climate change on cryosphere dynamics
Himalayan glaciers are valley-type glaciers and account for about 70% of non-polar glaciers (Nandy et al. 2006). Earlier studies have estimated that an area of about 32,000 km2 is permanently covered by ice and snow in the Himalayas (Negi 1991). According to the Geological Survey of India, there are 9,575 glaciers in the Indian Himalayas, distributed among the three river basins – Indus, Ganga, and Brahmaputra. Most of these glaciers (approximately 90%) are small to very small, being less than 5 km in length and smaller than 5 km2 in area. Only a few glaciers, such as Siachen, Gangotri, Milam, and Zemu, are larger than 10 km2. The IHR serves as an important source of freshwater for the densely populated areas downstream. The region is particularly vulnerable to climate change because it is highly dependent on snow and glacier-melt runoff to meet its freshwater demands (Singh, Goyal 2016). Due to their latitudinal and altitudinal positions, the Himalayan glaciers react to even minute changes in temperature and precipitation patterns (Kumar et al. 2009; Messerli et al. 2009; Immerzeel et al. 2010; Bajracharya, Shrestha 2011). In recent decades, climate change has induced various glacio-hydrological changes, such as changes in terminus and areal extent of the glaciers, glacier mass balance, and streamflow in downstream areas. The ablation and accumulation of glaciers are directly affected by changes in temperature and precipitation patterns. Air temperature is crucial since it is a major component of energy exchanges that control snow and ice melts. Among various parameters for assessing climate impact, glacier length is a major parameter for observing such changes. The recession in length or snout of a glacier depends on the increase in temperature, with the warming trend shifting the snout and ELA towards higher altitudes. Pandey and Venkataraman (2013) conducted a study from 1980 to 2010 over the western IHR (Chandra-Bhaga basin) and found a glacier area loss of 2.5%. Another study conducted in the Garhwal Himalayas from 1968 to 2006 reported an overall reduction in glacial area from 4.6% to 2.8% (Bhambri et al. 2011). An increased rate of retreat was observed from 1990-2006. A study conducted by Basnett et al. (2013) in the Teesta River basin showed a reduction in area from 3.3% to 0.8% from 1989-1990 to 2010. Another study by Racoviteanu et al. (2015) in the Sikkim Himalayas observed an areal loss from 20.1% to 8% from 1962 to 2000. Studies in various parts of the IHR suggest a reduction in glacierized area, with an increased rate after 1990 (Bahuguna et al. 2007; Berthier et al. 2007; Chalise et al. 2003; Ye et al. 2007b). A survey conducted by Ageta et al. (2003) over Himalayan glaciers in India, Bhutan, and Nepal reported a concerning trend: nearly all measured glaciers exhibited signs of retreat. This observation is particularly pronounced for summer-accumulation type glaciers in regions characterized by elevated precipitation and warmer temperatures, as highlighted by Ageta et al. (2003). Data from the past 100 years generated from glacier studies show that the glaciers in the Himalayas have been, by and large, shrinking and retreating continuously (IPCC 2013; Pramanik, Bhaduri 2016). The findings underscore the vulnerability of Himalayan glaciers to climate change, emphasizing that not only are these glaciers retreating, but the rate of retreat is notably accelerated in certain glacier types and geographical settings.
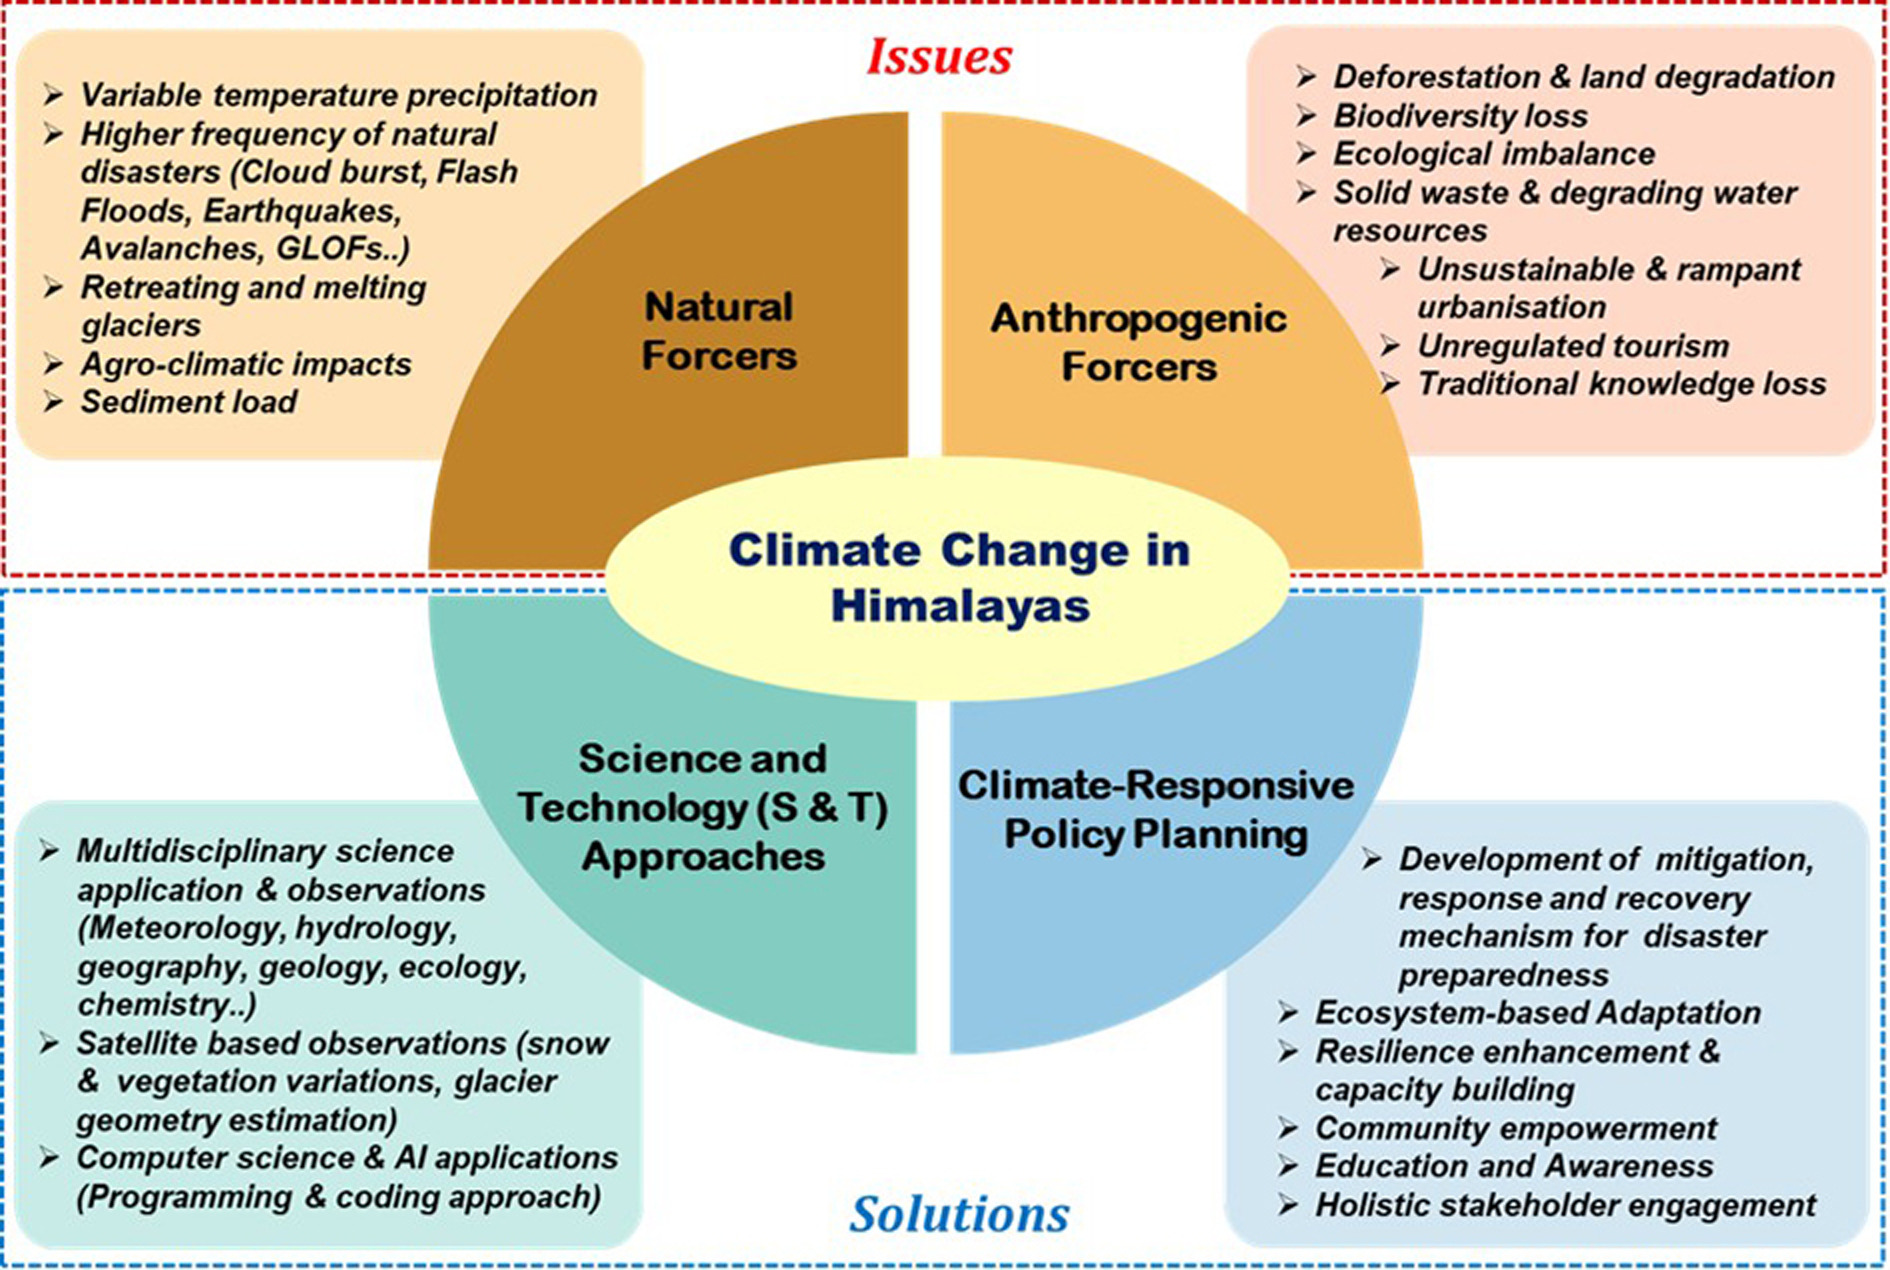
A few studies also concluded that the changes are observed only in glacier length and area, showing only the horizontal variation and not representing any volume change in the amount of ice present in the glacier. Hence, it cannot be concluded that observed changes are the effects of climate change; other underlying factors may be responsible for such variations. In addition, there can be several other factors that can change the length of a glacier, including bed topography, aspect, and slope, which primarily control the flow and dynamics of glaciers and hence the changes that occur. Apart from these factors, debris cover, a characteristic of Himalayan glaciers, can also be responsible for anomalous behaviour of the snout position of the glaciers (Singh et al. 2016). It has been evident that variation in precipitation and temperature due to climate change over the Himalayan region plays a dominant role in influencing glacier sensitivity and affects the melting process. Glaciers in the Himalayas are under the influence of westerlies that show a decreasing trend from west to east, along with the influence of the Indian and Asian monsoons, showing a decreasing trend from the eastern Himalayas to the west (Burbank et al. 2003; Bookhagen, Burbank 2006; 2010). This complex climate diversity results in a varying pattern of glacier response to climate variables (Fujita, Nuimura 2011; Scherler et al. 2011; Bolch et al. 2012; Gardelle et al. 2013; Gardner et al. 2013; Tayal, Sarkar 2019). Therefore, it is important to understand the impact of climate change on glacial regions. To understand these impacts, it is essential first to identify the probable issues in terms of climate change drivers and human dependence on Himalayan resources. Once these issues are understood, probable solutions can be assessed by applying various disciplinary sciences and developing suitable approaches that aid in a better and more robust understanding of such systems (Fig. 2).
5. Hydrological response of glaciers to climate change
Studies conducted over the Himalayan regions have observed the impact of climate change on river flow. Many underlying scenarios affect the hydrology of the region, and several factors contribute to increased melt rates in glaciers. Understanding these dynamics is crucial for comprehending the impact of global warming on these icy landscapes. Recognizing these varied factors contributes to a more comprehensive understanding of the intricate interplay between climate variables and glacier behaviour in the face of global warming. Because of variability in glacier characteristics and differences in climate, high-altitude regions respond differently to climatic changes across the world (Bliss et al. 2014). Therefore, assessing the climate impact on glaciers is crucial for estimating water availability and maintaining ecosystem balance (IPCC 2013; Pramanik, Bhaduri 2016). Various studies have recognized the Himalayan region as a 'hotspot' of climate change due to significant transformations in its hydro-meteorological regime (Bhutiyani et al. 2009; Shrestha, Aryal 2011; Wijngaard et al. 2018; Krishnan et al. 2019; Lutz et al. 2019). An authentic assessment of climate change, its variability, and its underlying impacts on the hydrological regime in the basin is seriously constrained by the paucity of observed data and detailed hydro-meteorological investigations (Dahri et al. 2021).
5.1. Glacier melt contributions to river discharge
Glaciers, by acting as buffers, play a crucial role in maintaining the hydrological cycle and ecosystem stability. This role is well documented by studies conducted in the region. Glaciers regulate the water supply from mountains to the plains during both dry and wet spells (Pramanik, Bhaduri 2016). Under a warming climate, glaciers and seasonal snow cover experience changes in their water storage capacity. A negative mass balance leads to an increased contribution of meltwater to river flows. However, this increased melt is not permanent; as the glacier volume decreases, the total meltwater generated from glaciers will ultimately decrease. Various studies have established that, depending on the state of glacier retreat, a warming climate may lead to either rising or decreasing river flows (Pellicciotti et al. 2010; Ragettli et al. 2016). In a related study, Ren et al. (2007) employed three distinct coupled General Circulation Models (GCMs) to estimate glacier melt rates specifically in the Greater Himalaya (GH). Their modeling exercise estimated a spatially averaged glacier depth reduction of approximately 2 meters for the 2001-2030 period in areas located below 4000 meters. Averaged over the entire GH region, the melting rate is accelerating at about 5 mm per year (Lesher 2011). This modeling approach provides valuable insights into dynamic changes within the glacier systems, offering a quantitative understanding of the thinning process. Furthermore, a study conducted in the Koshi River basin provides insights on hydrological implications of glacier melt. The research indicates that, on average, snow and glacier melt contribute approximately 34% to the total discharge annually. Notably, during the pre-monsoon season (March to May), this contribution rises significantly to 63%. Projections from the model used in this study suggest a potential 13% increase in annual discharge by mid-century, followed by a slight decrease in subsequent years. These anticipated changes in discharge underscore the intricate relationship between glacier melt and river basin hydrology, with potential implications for downstream water resources and ecosystems (Nepal 2016). Studies conducted by Immerzeel et al. (2013) and Lutz et al. (2014) have contributed valuable insights into the complex dynamics of water resources in the Himalayan region. Their research indicates that the combined effects of increasing precipitation and glacier melt are expected to lead to an overall increase in annual runoff for Himalayan watersheds. Thus, at least in the near term, there may be a positive impact on water availability in these regions. According to the findings, water availability is projected to remain relatively constant until mid-century. However, it is important to note that stability in overall water availability does not necessarily imply a consistent distribution throughout the year. Extreme events linked to climate change are anticipated to have a notable impact on the seasonal water availability in downstream areas (IPCC 2007; Nepal 2016).
These projections underscore the intricate nature of the hydrological system in the Himalayan region, where the interplay of increased precipitation, glacier melt, and the influence of climate change-induced extremes contributes to a nuanced understanding of water resource dynamics. Balancing these factors becomes crucial for sustainable water management, particularly in the context of potential challenges posed by variability in seasonal water availability in downstream areas.
5.2. Alterations in snowmelt patterns and timing
A study conducted by Gusain et al. (2014) from 1976 to 2011 using the station data showed that the majority of stations below 4000 m recorded declining trends in seasonal snowfall. Similarly, a study from 1987-2009 showed that the majority of stations at 3250 m elevations also showed a decreasing trend in seasonal snowfall (Singh et al. 2015). Another study conducted by Nepal (2016) observed that snowfall is projected to decrease substantially with rising temperature, the basin will lose snow storage capacity, and there will be a marked decrease in snowmelt runoff from non-glaciated areas. Various studies have shown that the contribution of glaciers (snow and glacier melt) in IHR increases from east to west (Barnett et al. 2005; Alford, Armstrong 2010; Armstrong 2010; Immerzeel et al. 2010; Racoviteanu 2011; Nepal 2016).The escalating contribution of glacier melt to the total volume of meltwater raises substantial concerns, particularly when contrasted with the replenishable nature of snowmelt. Unlike the annual renewal of snowpack through seasonal snowfall, glaciers evolve over extended periods and are not easily replenished (Barnett et al. 2005). This fundamental difference underscores the vulnerability of glacier-dependent water resources and highlights the need for a diligent approach to water management in the face of changing climate conditions. In the context of the diverse climatic patterns within the IHR, it becomes evident that the relative contributions of rain, snowmelt, and glacier melt to river discharge will vary significantly. This variability is anticipated, given the wide range of climates present in the region (Pramanik, Bhaduri 2016). Each river system within the IHR is likely to exhibit distinct hydrological responses based on its specific geographical and climatic characteristics. Numerous studies have emphasized the critical role of temperature change in shaping the contributions of snow and glacier melt to river discharge. The impact extends beyond just the quantity; it also affects the form of precipitation, distinguishing between liquid and solid forms, and the timing of their contributions to the overall discharge. These findings collectively highlight the intricate interactions between climate variables and water resource dynamics in the Himalayan region, emphasizing the need for comprehensive assessments to inform adaptive strategies for sustainable water management in this crucial and vulnerable environment.
6. Role of hydrological models for high-altitude regions
Researchers have undertaken extensive efforts to evaluate the effects of climate change on glacierized mountainous catchments worldwide, employing cryospheric and hydrologic models (Nolin et al. 2010; Gascoin et al. 2011; Nepal 2016; Soncini et al. 2016; Zhang et al. 2016; Li et al. 2019; Bhatta et al. 2020), in addition to investigations specifically focused on the Himalayan region (Rees, Collins 2006; Immerzeel et al. 2010, 2012; Lutz et al. 2014, 2016; Shea et al. 2015; Azam et al. 2019; Chandel, Ghosh 2021). The studies have explored various models for assessing streamflow components in both glacierized and nonglacierized catchments. Current research emphasizes the importance of selecting a modeling strategy rather than relying on a single model, due to the complex and site-specific nature of high-altitude hydrology. A common trend in recent studies is the adoption of a coupled approach, integrating Geographic Information System (GIS) datasets, meteorological parameters, and glacio-hydrological models. This holistic method aims to provide a more accurate assessment of the streamflow component and the overall impact of climate change on the region. The synergy of these various datasets and models allows researchers to capture the complex interactions and dynamics within high-altitude catchments, contributing to a more comprehensive understanding of the hydrological implications of climate change in mountainous regions (Fig. 3).
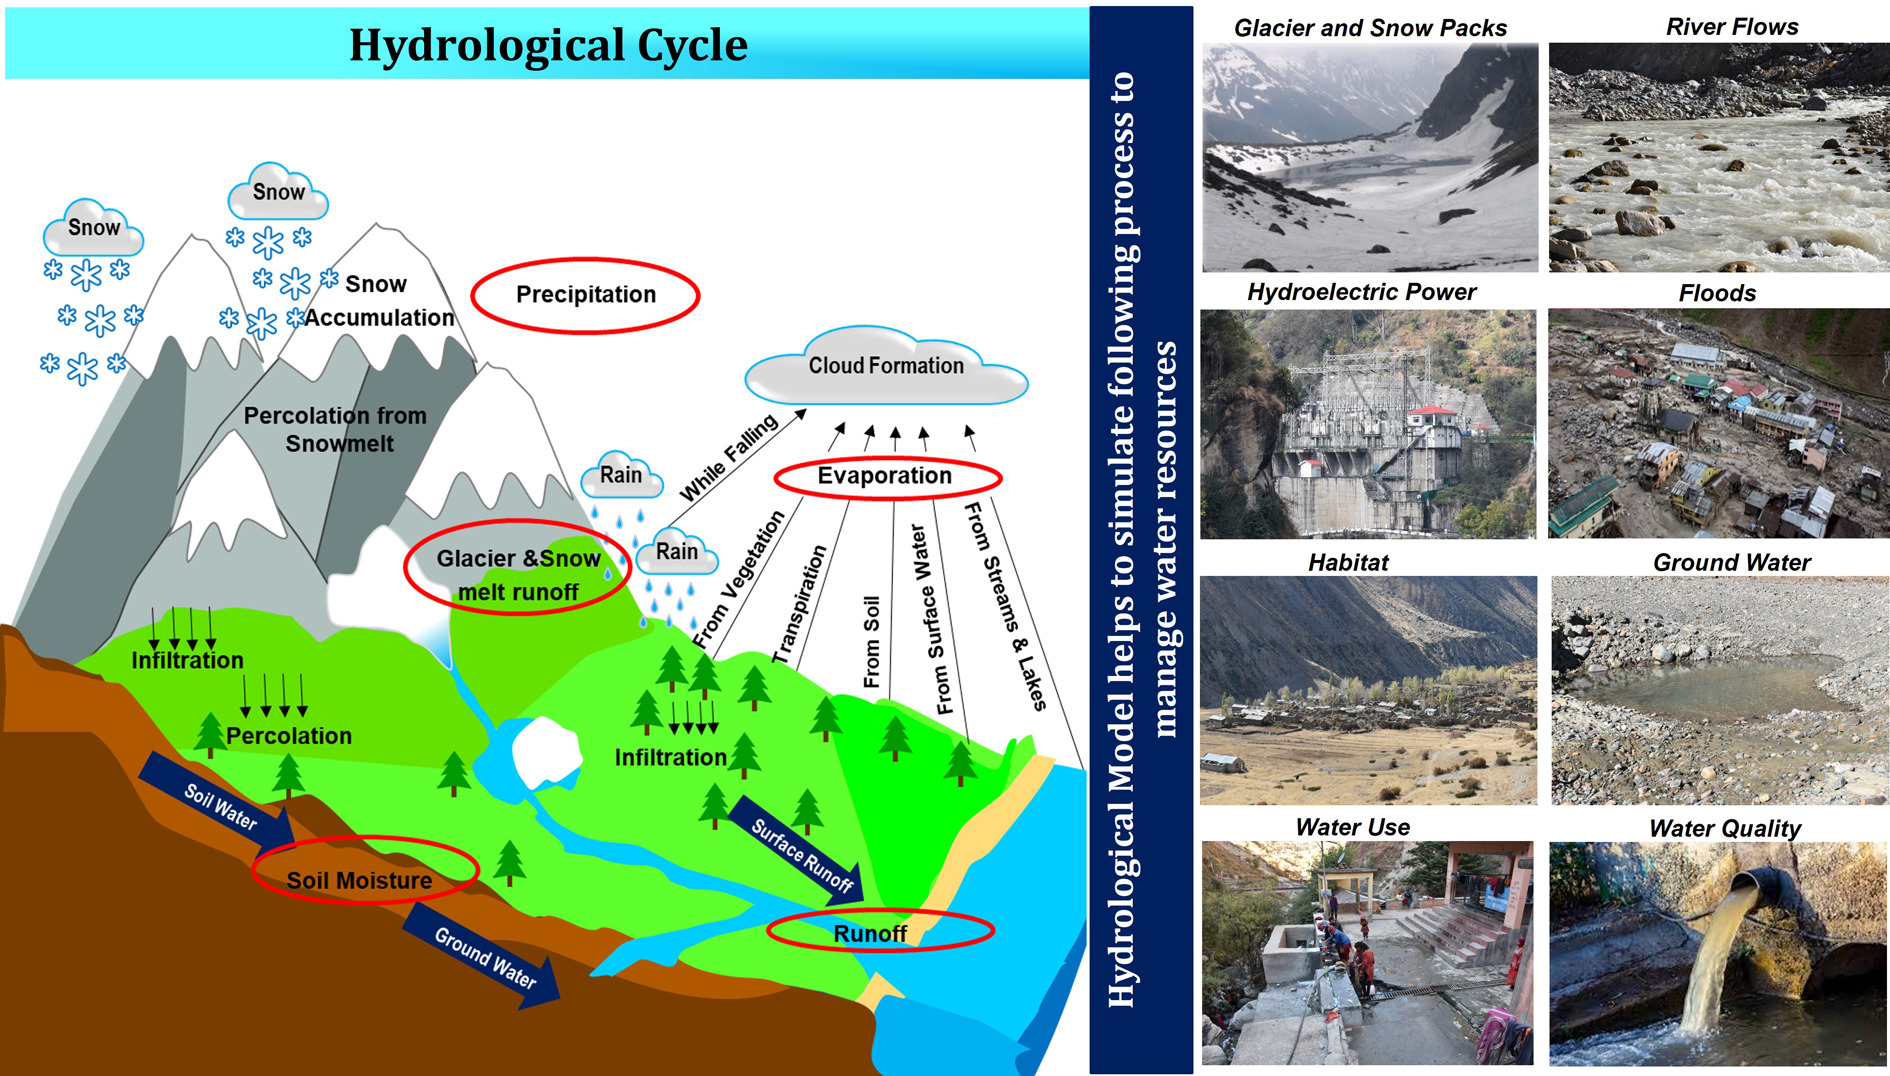
Fig. 3.
Illustration of the hydrological cycle: A comprehensive overview of precipitation, evaporation, and runoff dynamics in the water cycle, highlighting the importance of hydrological models for understanding and predicting hydrological processes in various environments.
6.1. Types of hydrological models
According to (Moradkhani, Sorooshian 2008), a model is a simplified representation of a real-world system. The best model is the one that gives results close to reality with the fewest parameters and least model complexity. Models are mainly used for predicting system behavior and understanding various hydrological processes. A model consists of various parameters that define the characteristics of the model. A runoff model can be defined as a set of equations that helps in the estimation of runoff as a function of various parameters used for describing watershed characteristics. The two important inputs required for all models are rainfall data and drainage area. Along with these, watershed characteristics such as soil properties, vegetation cover, watershed topography, soil moisture content, and characteristics of groundwater aquifers are also considered. Hydrologic models are simplified, conceptual representations of a part of the hydrologic cycle.
These models are primarily used for hydrologic prediction and for understanding hydrologic processes. They are currently considered important and necessary tools for water and environmental resource management. Three major types of hydrologic models can be distinguished (Fig. 4). The major hydrological models used in various studies and details of their applications are listed in Table 3.
Table 3.
Description of various models along with their application details.
| Model/Model type | Input | Application | Snow/Glacial melt | Source |
|---|---|---|---|---|
| Snowmelt runoff model (SRM)/Semi-Distributed Model | Snow cover area and ancillary data:temperature, precipitation, and runoff | Simulate and forecast daily streamflow in mountain basins where snowmelt is a major runoff factor | Computes snow melt, glacier module is not included | Martinec et al. (1994) |
| Snowmelt Model (SNOWMOD)/Distributed Model | Snow covered area, elevation bands and their areas, altitude of meteorological stations, precipitation, air temperatures, streamflow data, and informationon the initial soil moisture status of the basin | Simulate daily streamflow for mountainous basins having contributionsfrom both snowmelt and rainfall | Computes snow melt, glacier module is not included | Singh, Jain (2003) |
| Water flow and balance simulation model (WaSiM)/distributed, deterministic, physically based model | Precipitation and temperature, raster data for topography, land use,and soil properties. | Grid-based tool for investigating the spatial and temporal variability of hydrological processes in complex river basins | Glacier module is not included, computes short-term (floods) and long-term simulations (long-term water balance simulations) | Hess, Counsell (2000) |
| GEOtop/distributed model | Georeferenced maps, elevation (DTM), soil-type map, land-use map, weather (hourly) data time series | Simulate interaction between energy balance (evapotranspiration, heat transfer) and hydrological cycle (water, glacier,and snow) for relatively large mountain catchments | Computes snow cover dynamics | Endrizzi et al. (2014) |
| Hydrologiska Byråns Vattenbalansavdelning/semi-distributed model | Daily rainfall, temperature,and potential evaporation | Simulates daily discharge for glaciarized as well as non-glaciarized catchments | Glacier module is included | Seibert, Vis (2012) |
| Tracer Aided Catchment Model, Distributed (TAC D)/distributed model | Precipitation, temperature,and evapotranspiration | Applicable in process-based runoff generation | Glacier module is included but computation of melt of debris-covered glaciers is treated the same way as that of debris-free glaciers | Uhlenbrook et al. (2004) |
| Soil and Water Assessment Tool (SWAT)/semi-distributed model | Daily rainfall data, maximum and minimum air temperature, solar radiation, relative air humidity & wind speed, DEM,and land use/land cover maps | Simulates different hydrologic responses for a riverbasin or watershed using process-basedequations | Computes snow accumulation and snowmelt | Douglas-Mankinet al. (2010) |
| University of British Columbia Watershed Model(UBC)/semi-distributed model | Precipitation,temperature,and elevation bands information | Designed primarily for mountainous watersheds;calculates the total contribution from both snowmelt and rainfall runoff | A separate calculation can also be made for runoff occurring from glacier-coveredareas | Loukas, Vasiliades (2014) |
| Hydrologic Engineering Center -Hydrologic Modeling System (HEC-HMS)/semi-distributed model | DEM, precipitation, temperature, stream,and watershed characteristics | Suitable only for events not for long-termhydrological simulations | Computes Snow Melt | Visweshwaran (2017) |
| Mike-SHE/distributed model | Model extent -typically as a polygon, topography, precipitation, evapotranspiration, air temperature, solar radiation, sub-catchment delineation, river morphology (geometry + cross-sections), land use distribution, soil distribution, subsurface geology | Simulates the complete land phase of the hydrologic cycle | Computes snow melt | Soltani et al. (2017) |
| Variable Infiltration Capacity (VIC)/large-scale, semi-distributed | Daily rainfall, daily maximum and minimum temperature, soil map, land cover map, vegetation properties, lake and wetland features, digital elevation model, streamflow data | Subgrid variability, macroscale model; large-scale effects | Computes snow melt | Liang et al. (1994) |
| Spatial Processes in Hydrology model (SPHY)/spatially distributed | Digital Elevation Model (DEM), land use type, glacier cover, reservoirs and soil characteristics. precipitation, temperature, and evapotranspiration | Simulate terrestrial hydrology at flexible scales, under various land use and climate conditions | Glacier module is included | Terinket al. (2015) |
Fig. 4.
Classification of hydrological models along with their characteristics (Source: Devi et al. 2015).
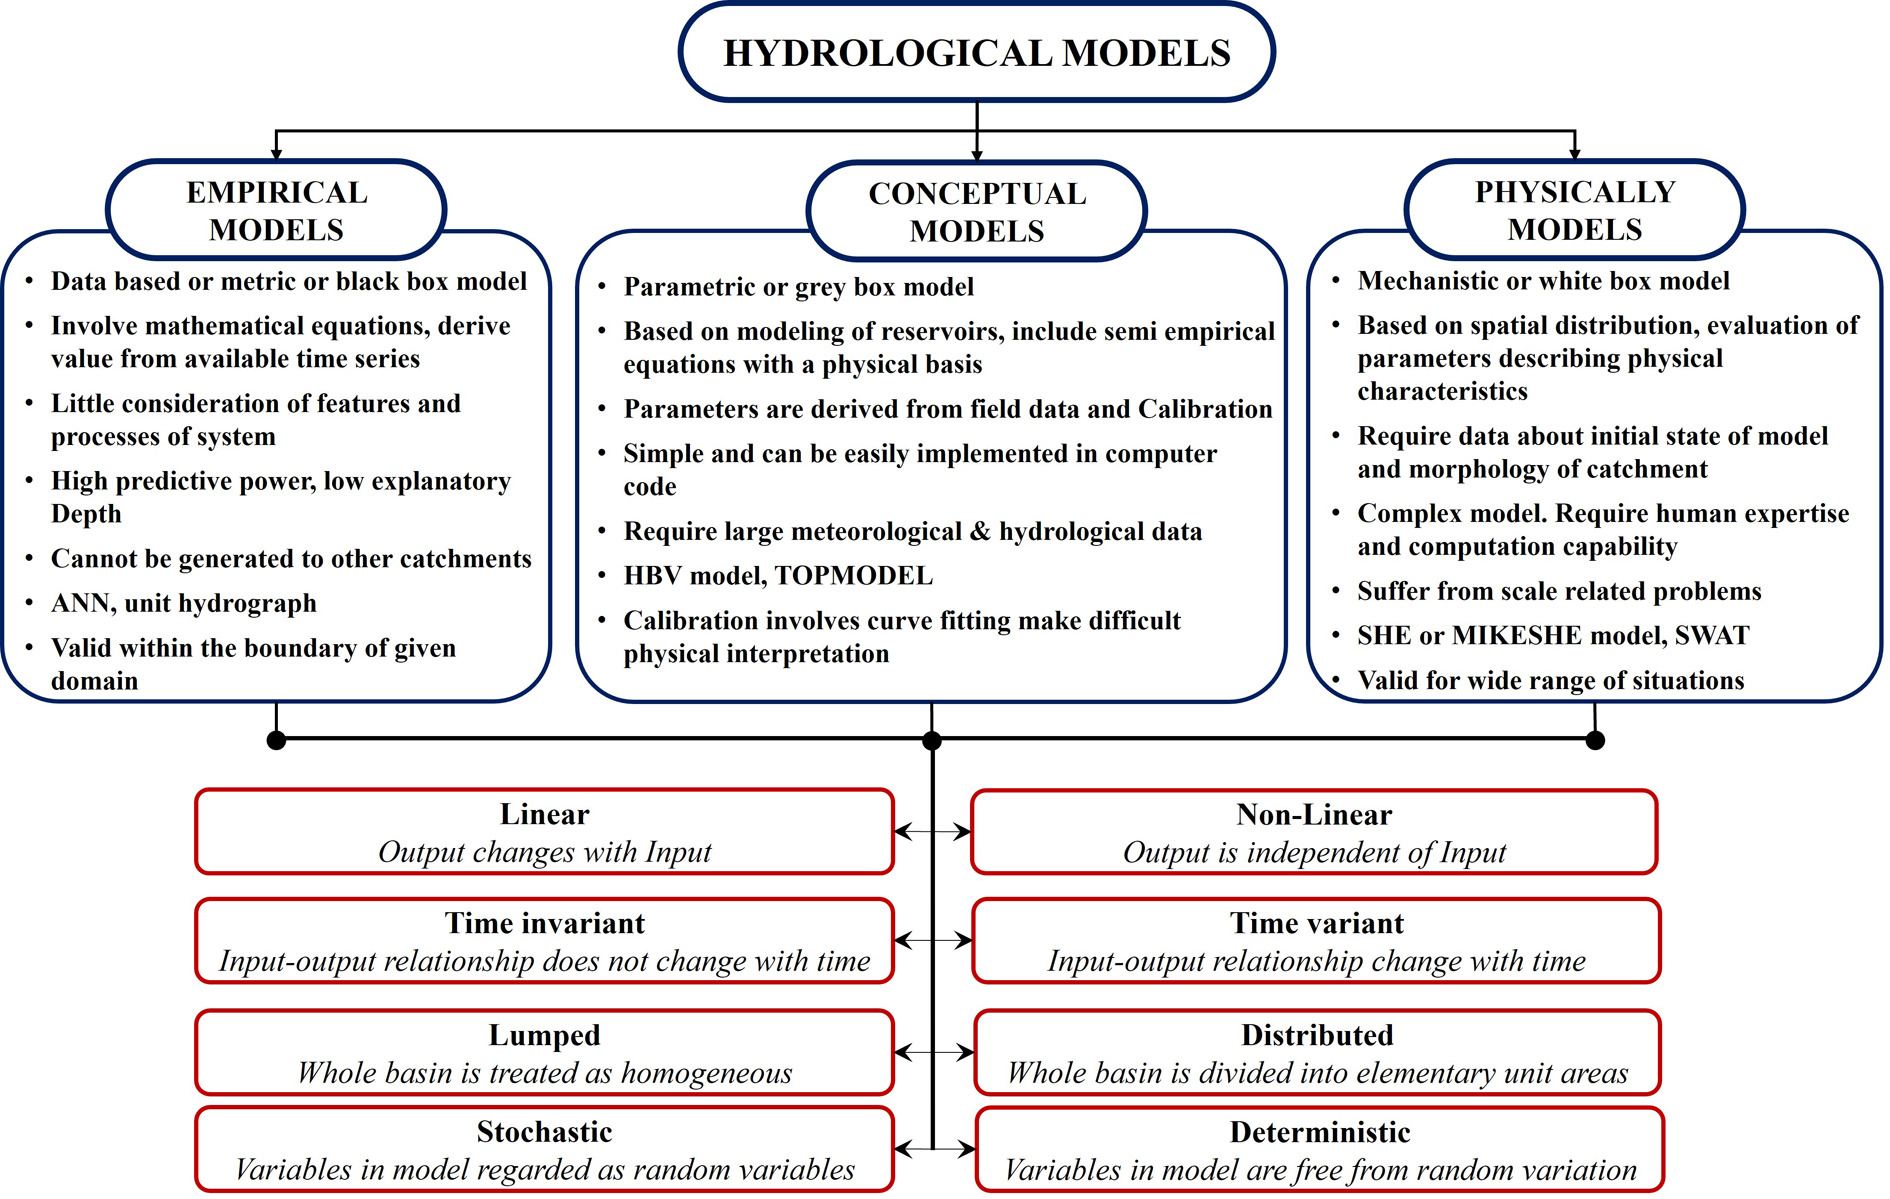
6.1.1. Empirical models (metric model)
These are observation-oriented models that take only the information from existing data without considering the features and processes of the hydrological system, and hence these models are also called data-driven models (Devi et al. 2015). They involve mathematical equations derived from concurrent input and output time series, and not from the physical processes of the catchment. These models are valid only within the boundaries. Unit hydrograph is an example of this method. Statistically based methods use regression and correlation models to find the functional relationship between inputs and outputs.
6.1.2. Conceptual methods (parametric models)
This type of model describes all of the component hydrological processes. It consists of a set of interconnected reservoirs that represent the physical elements in a catchment in which they are recharged by rainfall, infiltration, and percolation and are emptied by evaporation, runoff, and drainage. Semi-empirical equations are used in this method, and the model parameters are assessed not only from field data but also through calibration. A large number of meteorological and hydrological records is required for calibration. The calibration involves curve fitting, which makes the interpretation difficult and hence the effect of land use change cannot be predicted with much confidence. Stanford Watershed Model IV (SWM) is the first major conceptual model developed by Crawford and Linsley in 1966, with 16 to 20 parameters. Many conceptual models have been developed with varying degrees of complexity.
6.1.3. Physically based models
Physically based models are mathematically idealized representations of real phenomena. These models are also called mechanistic models; they include the principles of physical processes. They use state variables that are measurable and are functions of both time and space. The hydrological processes of water movement are represented by finite difference equations. Calibration does not require extensive hydrological and meteorological data, but the evaluation of a large number of parameters describing the physical characteristics of the catchment is required, including soil moisture content, initial water depth, topography, topology, river network geometries, and dimensions (Abbott et al. 1986 (1)). Physical models can overcome many defects of the other two models because the parameters have physical interpretations. They can provide a large amount of information even outside the boundary and can be applied for a wide range of situations. SHE/ MIKE SHE model is an example of a physically based model (Abbott et al. 1986 (1 & 2)). The above three models can be divided further into subcategories according to the variability of their input and output parameters with space and time, as discussed below.
Linear and Non-linear – A model is linear in the system-theory sense if it satisfies the principle of superposition: i.e., any change in input must be reciprocated in output. If not, it is a non-linear model.
Time invariant and Time variant – A model is time-invariant if its input-output relationship does not change with time. The form of the output depends only on the form of the input and not on the time at which the input is applied. Models that do not have this property are called time-variant. Most hydrologic systems are time-variant to accommodate variations in solar activity during the day and seasonal variations during the year. Yet, for simplicity, they are assumed to be time invariant.
Lumped and distributed – In lumped models, the whole basin is treated as homogeneous. Here parameters are independent of space. In distributed models, which attempt to calculate flow contributions from separate areas or sub-basins that are treated as homogeneous within themselves, to fully distributed models, in which the whole basin is divided into elementary unit areas like a grid net and flows are passed from one grid point to another as water drains through the basin.
Stochastic and Deterministic – If any of the variables in the model are regarded as random variables having probability distributions, then the model is stochastic. If all variables in the equation are regarded as free from random variation, so that none is thought of as having a probability distribution, then the model is deterministic.
6.2. Integration of remote sensing and GIS data in modeling
With the advent of various GIS-based hydrological models, remote sensing and GIS-based techniques are being integrated widely into studies. To understand the variation of glaciers (snow cover, ELA, snout, GLOFs, etc.) satellite imagery is being used in the studies. Gardelle et al. (2011) used Landsat Thematic Mapper (TM) and Enhanced Thematic Mapper Plus (ETM+) imagery to compare the evolution of lakes throughout the HKH and found that in the wetter, more eastern region, which is influenced by the Indian summer monsoon (India, Nepal, and Bhutan), glacial lakes are more numerous, larger, and are growing in size, while in the more western, drier region (Pakistan and Afghanistan), glacial lakes are decreasing in size. Glacier length is one of the most widely available datasets for the Himalaya (Lesher 2011). This parameter can be easily reported using remote sensing observations. Uttarakhand has the maximum number of observations of changes in glacier length. All the glaciers are retreating with an average rate of about 18 m/year (Singh et al. 2016). Various studies include DEM datasets for snow cover estimation. Surprisingly, apart from the shrinkage reported by various glaciological studies using remote sensing, a study by Bahuguna et al. (2014) using the same method suggests that 86.8% of 2018 glaciers mapped in Karakoram, Himachal Pradesh, Zanskar, Uttarakhand, Nepal, and Sikkim regions of the HKH were stable not retreating between 2000/2001 and 2010/2011 (Singh et al. 2016). Remote sensing has been used extensively for mapping changes in the area covered by glaciers and snow in the IHR. Mapping of Chhota Shigri, Patsio, and Samudra Tapu glaciers in the Chenab basin, Parbati glacier in the Parbati basin, and Shaune Garang glacier in the Baspa basin, has reported an overall deglaciation of 21% from 1962 to 2001 (Kulkarni et al. 2007). A study from western IHR suggests a loss of glacier area of 19 and 9% from two nearby river basins (Brahmbhatt et al. 2012). Moreover, various distributed grid-based hydrological models (VIC, MIKESHE) require DEM datasets, LULC, Soil maps, and glacier area extent. All of these parameters are computed with the help of remote sensing & GIS techniques. The Soil and Water Assessment Tool (SWAT) has been widely accepted as a suitable model for hydrological analysis in Himalayan watersheds (Swain et al. 2022). As a semi-distributed model, SWAT requires elevation-wise area information for glacierized and non-glacierized regions, which have been derived in previous Himalayan studies using GIS spatial analysis. These applications highlight the importance of accurate representation of elevation-dependent land cover and cryospheric processes in mountainous basins.
7. Case studies: hydrological model applications in the Himalayas
Numerous studies worldwide, including in the Himalayas, have focused on quantifying the contributions of different streamflow components (Alford, Armstrong 2010; Racoviteanu et al. 2013; Brown et al. 2014; Mimeau et al. 2019b; Kayastha et al. 2020; Kayastha, Kayastha 2020). The relative roles of glacier melt, snowmelt, rainfall runoff, and baseflow have been assessed across high-altitude catchments (Singh, Jain 2002; Immerzeel et al. 2010, 2012; Racoviteanu et al. 2013; Zhang et al. 2013; Lutz et al. 2014; Nepal et al. 2014; Savéan et al. 2015; Azam et al. 2019). These studies typically employ glacio-hydrological models to separate and quantify streamflow components. Several physically based distributed models have been applied in Himalayan catchments. Examples include SPHY (Spatial Processes in Hydrology) (Lutz et al. 2014; 2016), TOPKAPI-ETH (Ragettli et al. 2013; 2016), HBV (Stahl et al. 2008; Jost et al. 2012; Etter et al. 2017), Variable Infiltration Capacity (VIC) (Zhang et al. 2013; Zhao et al. 2013), the Distributed Hydrology Soil Vegetation Model (DHSVM) (Wigmosta et al. 2002; Naz et al. 2014; Frans et al. 2015, 2016; Mimeau et al. 2019a), and Glacier Evolution Runoff Model (GERM) (Huss et al. 2014). These tools provide insights into glacier mass balance, runoff partitioning, and the role of snow and ice melt under changing climate conditions. Hybrid approaches have also been developed. VIC has been integrated with glacier models to predict runoff (Zhang et al. 2013; Zhao et al. 2013; Ren et al. 2018; Yun et al. 2020). Temperature-index models are sometimes combined with VIC outputs using area-weighted factors to simulate glacier melt (Chandel, Ghosh 2021; Zhang et al. 2013). Remote sensing products have also supported hydrological modeling; for example, MODIS snow cover and TRMM precipitation estimates, were attributed to enhanced glacier runoff under warming conditions (Immerzeel et al. 2009). However, significant uncertainties persist in climate-forcing datasets, particularly for high-altitude hydrometeorology. Earlier studies in the Indus Basin relied on lumped or temperature-index models, which often oversimplify glacier-hydrology interactions. More recent work has emphasized distributed and process-based approaches that capture catchment heterogeneity (Bhanja et al. 2023; Dwivedi et al. 2025). Hydrological modeling has also been extended to non-glacierized basins to assess future scenarios; for example, the J2000 model applied in the Koshi River basin projected declining snowfall and reduced snow storage capacity under warming, leading to decreased snowmelt runoff from non-glaciated areas (Nepal 2016).
In glacierized basins, models generally project increasing glacier melt until mid-century, followed by declining melt contributions as glacier volumes shrink (Nepal 2016). Across Himalayan watersheds, climate change is expected to intensify both precipitation and glacier melt (Immerzeel et al. 2013; Lutz et al. 2014). While annual water availability may remain stable in the near term, the frequency of hydrological extremes such as floods and droughts is projected to increase (IPCC 2007). Representative Concentration Pathways (RCPs) are standardized greenhouse gas emission scenarios used in climate modeling, defined by their radiative forcing levels by 2100. Comparative analyses in Nepal and the Andes under RCP 4.5 and RCP 8.5 suggest consistent glacier retreat, with debris-free glaciers most sensitive, whereas debris-covered glaciers with stagnant, low-gradient termini exhibit relative stability (Ragettli et al. 2016). At the basin scale, semi-distributed conceptual models have been applied to quantify streamflow components. In the Gangotri glacier catchment (central Himalayas), snowmelt contributed 55.5% of total streamflow, followed by glacier melt (29.7%) and rainfall runoff (14.7%) (Arora et al. 2024). The model, calibrated with in situ records (2013-2016) and validated for 2016-2019, performed well overall, though performance declined during months of abrupt precipitation and temperature shifts. In the Chandra-Bhaga Basin, SPHY was applied for 1950-2022, calibrated against in situ runoff (1973-2006) and MODIS snow cover (2003-2018), and validated with Chhota Shigri runoff (2010-2015). Modeled mean annual runoff was 60.21 ± 6.17 m3/s, with glacier runoff contributing 39%, snowmelt from non-glacierized areas and baseflow contributing 25% each, and rainfall runoff contributing 11% (Srivastava et al. 2024). The SWAT model applied to the Satluj Basin (1986-2005) showed that snowmelt runoff was the dominant contributor, accounting for 68-71% of mean annual discharge at Rampur. Water yield averaged ~600 mm annually, ~50% of precipitation, mostly generated during early summer; actual evapotranspiration accounted for ~14% of precipitation (Shukla et al. 2021). Shared Socioeconomic Pathways (SSPs) are future climate scenarios that combine socioeconomic development trajectories with greenhouse gas forcing levels. In the Jhelum sub-basin, future projections indicate substantial glacier area loss (34.7 ±12.1% under the SSP245 scenario and 55.3 ±16.1% under the SSP585 scenario by the 2080s), accompanied by reduced glacier streamflow and declining water availability, with significant implications for agriculture and hydropower (Abdulla et al. 2025).
Studies across the IHR indicate that as much as 70% of summer flow in the Ganges and 0-60% in other major rivers originates from glacier melt (Barnett et al. 2005). Although reported values vary (Alford, Armstrong 2010; Armstrong 2010; Racoviteanu 2011), there is consensus that glacier contribution to streamflow increases from east to west across the IHR (Immerzeel et al. 2010). In the Central Himalaya, modeling at Dokriani Glacier revealed a linear relationship between increases in temperature, precipitation, and runoff, with higher runoff linked to the glacier’s proximity to the watershed outlet and its relatively high glacial cover (Singh et al. 2006).
Fig. 5.
Study area map of the Indian Himalayan Region (IHR) showing glacierized zones, elevation distribution, and locations of selected study points across Ladakh, Jammu & Kashmir, Himachal Pradesh, and Uttarakhand (top panel), along with a comparative synthesis of reported snow and glacier melt contributions (%) to streamflow for major Himalayan river basins compiled from previous studies (bottom panel).
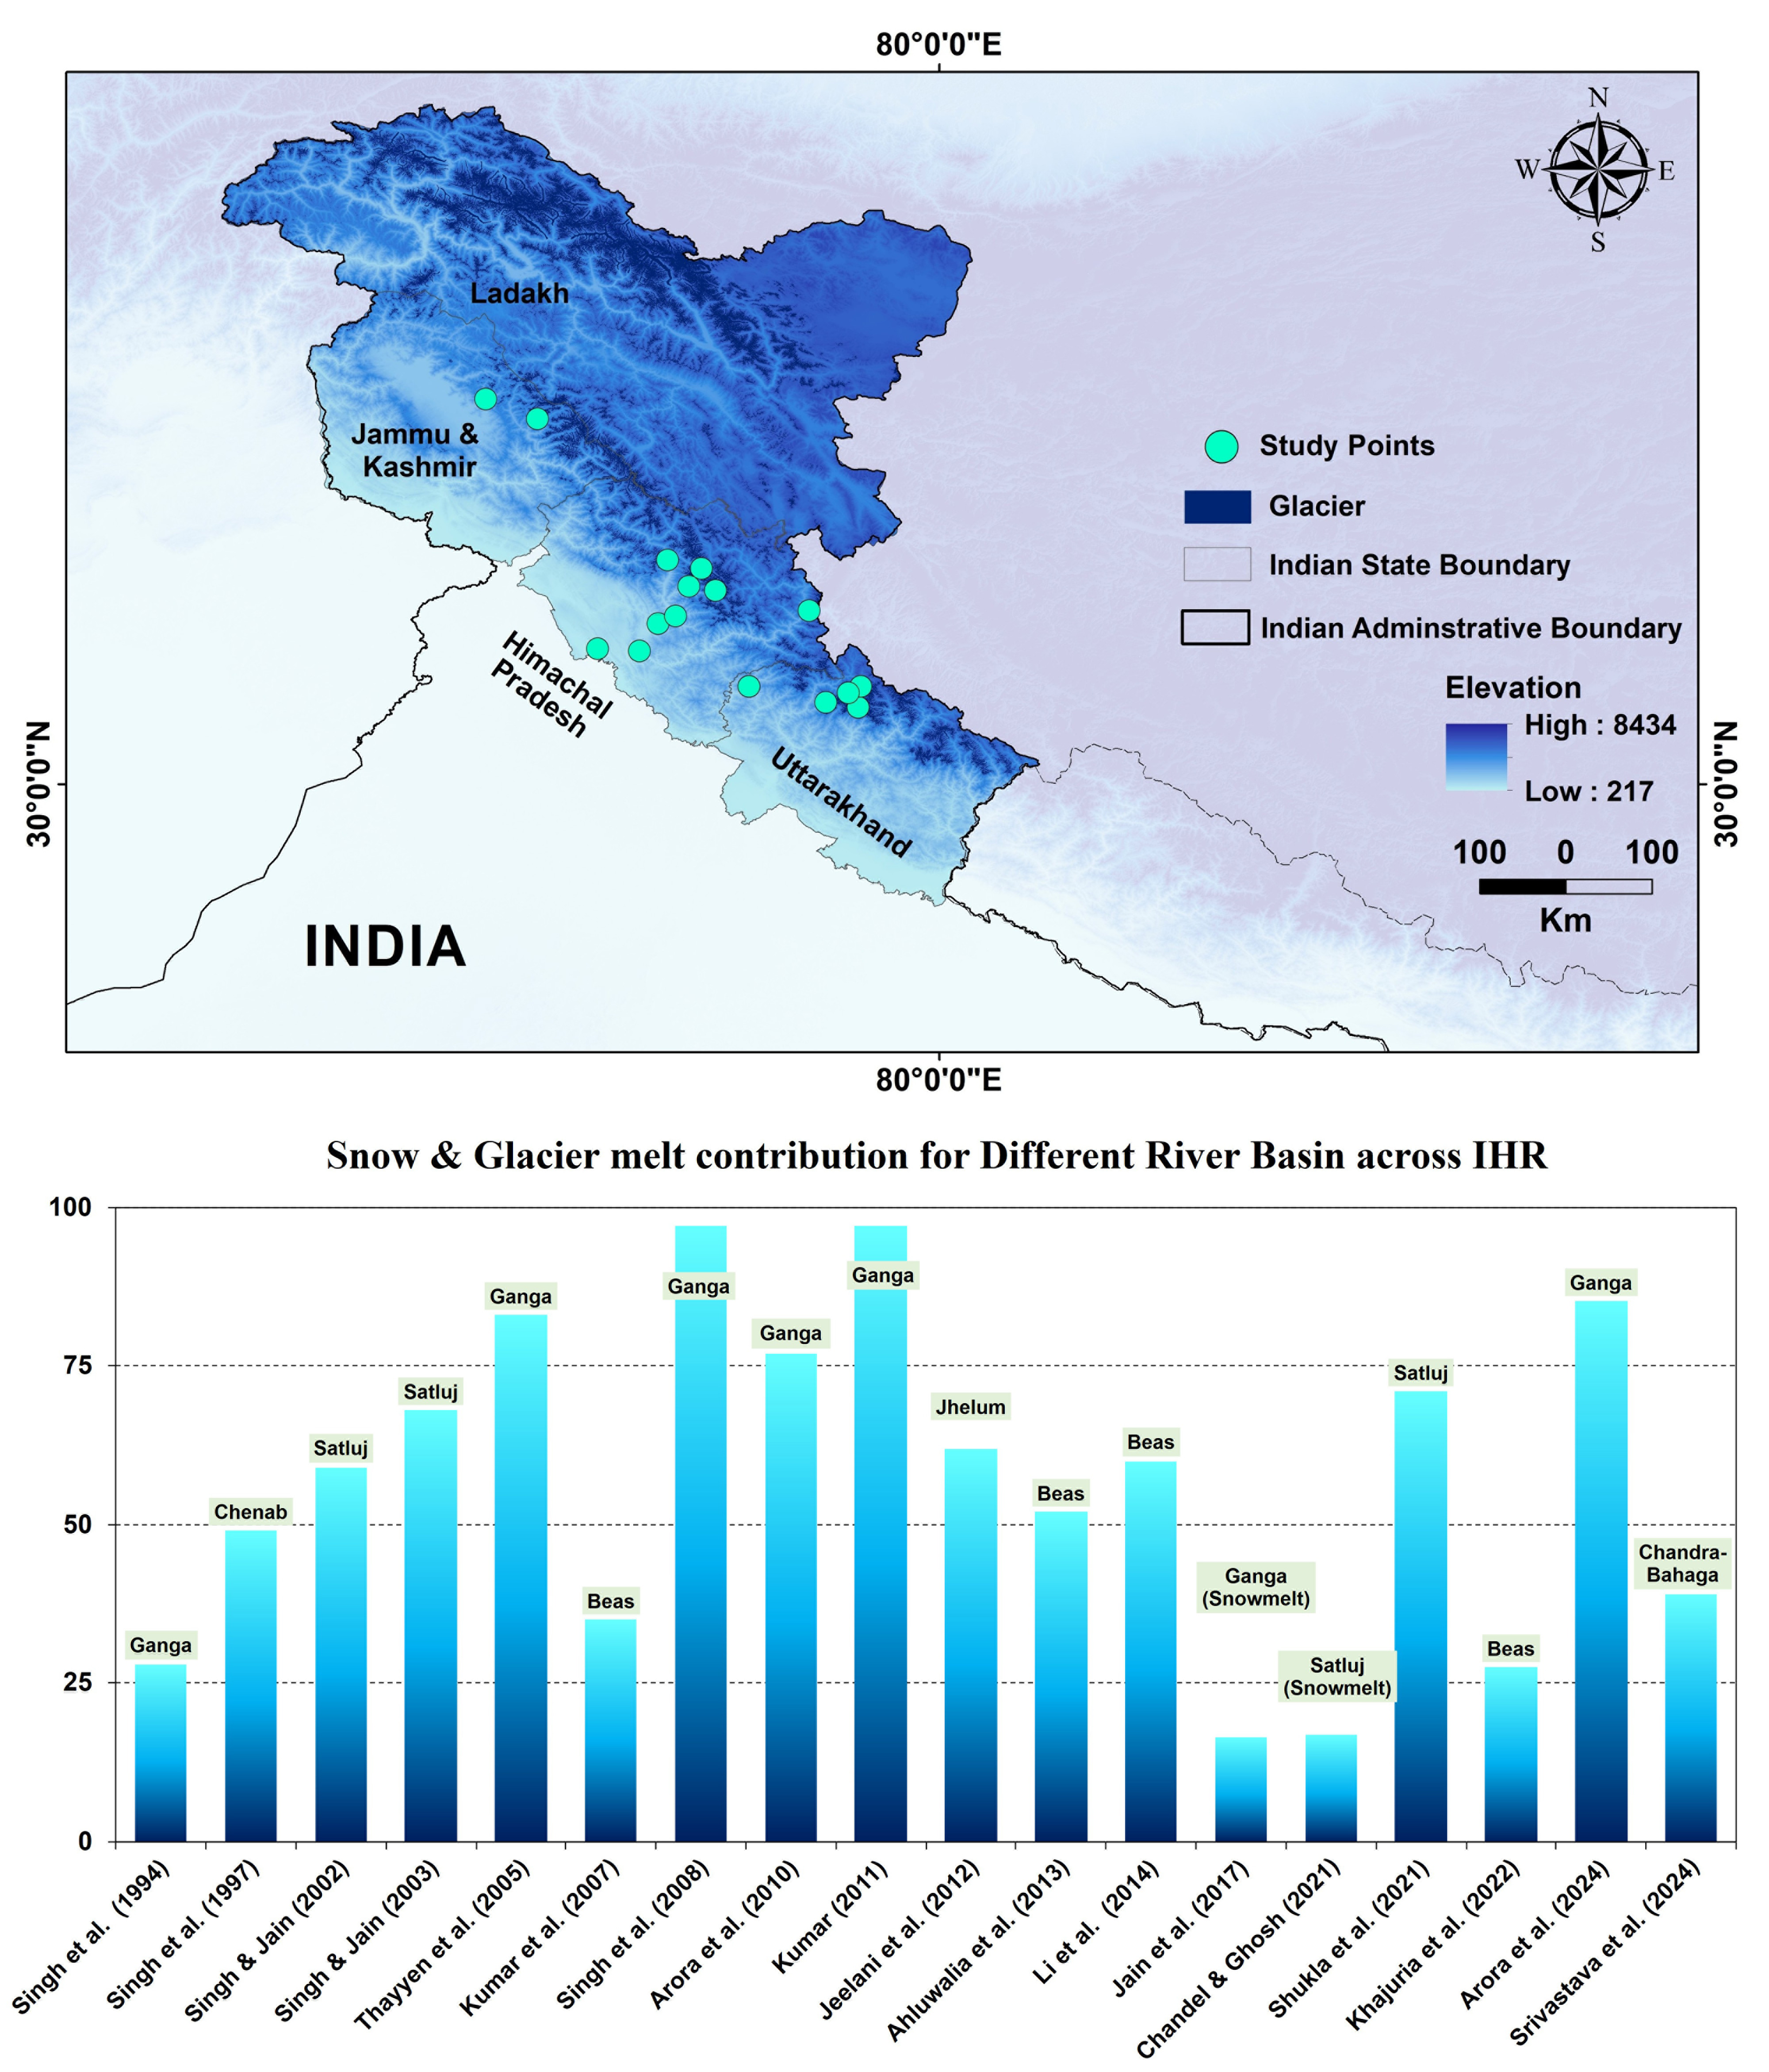
Table 4.
Basin-wise estimates of snow and glacier melt contributions to river discharge across major Himalayan catchments, derived using modelling approaches over different study periods, as reported in the cited literature.
| Rivers (basins) | Study period | Duration | Melt contribution (%) | Contributors | Approach/Method | References |
|---|---|---|---|---|---|---|
| Beas | 1987-2005 | Annual | 60 | Snow and Glacier Melt | Hydrological Modelling | Li et al. (2013) |
| 1990-2004 | Annual | 35 | Snow and Glacier Melt | Temperature Index Modelling | Kumar et al. (2007) | |
| 1993-1997 | Annual | 39 | Snow and Glacier Melt | Hydrological Modelling | Jain et al. (2010) | |
| 2010-2011 | (Apr.-Mar.) | 52 | Snow and Glacier Melt | Temperature Index Modelling | Saran Ahluwalia et al. (2015) | |
| 2015-2018 | Annual | 10 to 45 | Snow Melt | Temperature Index Modelling | Khajuria et al. (2022) | |
| Satluj | 1981-1993 | Annual | 16.9 | Glacier Melt | Hydrological Modelling | Chandel, Ghosh (2021) |
| 1985-1999 | Annual | 68 | Snow Melt | Temperature Index Modelling | Singh, Jain (2003) | |
| 1986-1996 | Annual | 59 | Snow and Glacier Melt | Temperature Index Modelling | Singh, Jain (2002) | |
| 1986-2005 | Annual | 71 | Snow Melt | Hydrological Modelling | Shukla et al. (2021) | |
| Jhelum | 1901-2010 | Annual | 62 | Snow and Glacier Melt | Temperature Index Modelling | Jeelani et al. (2012) |
| Chenab | 1982-1992 | Annual | 49 | Snow and Glacier Melt | Temperature Index Modelling | Singh, Kumar (1997) |
| Chandra-Bhaga | 1950-2022 | Annual | 39 | Glacier Melt | Hydrological Modelling | Srivastava et al. (2024) |
| Ganga | 1982-1992 | Annual | 28 | Snow and Glacier Melt | Hydrological Modelling | Singh, Hasnain (1998) |
| 1992-2005 | Annual | 13-20 | Snowmelt | Hydrological Modelling | Jain et al. (2017) | |
| 1994, 1998-2000 | (May-Oct.) | 76-90 | Snow and Glacier Melt | Hydrological Modelling | Thayyenet al. (2005) | |
| 1999-2002, 1983-1984, 1987 | (May-Oct.) | 77 | Snow and Glacier Melt | Temperature Index Modelling | Arora et al. (2010) | |
| 2000-2003 | (May-Oct.) | 97 | Snow and Glacier Melt | Temperature Index Modelling | Singh et al. (2008a) | |
| 2004-2006 | (May-Sep.) | 97 | Snow and Glacier Melt | Temperature Index Modelling | Kumar (2011) | |
| Bhagirathi River/Gangotri | 2013-2016 | Annual | 86 | Snow and Glacier Melt | Hydrological Modelling | Arora et al. (2024) |
8. Hydrological processes most impacted by climate change
The Himalayan region contains the largest volume of ice outside the polar zones and serves as a crucial freshwater source for downstream populations (Immerzeel et al. 2012; Ragettli et al. 2016). Climate change is altering key hydrological processes in these basins, particularly snow accumulation, snowmelt timing, glacier melt, and rainfall-runoff dynamics. Variations in forest cover further influence water availability, sediment load, and seasonal river flows, leading to environmental, socioeconomic, and ecological vulnerabilities. In such rapidly changing conditions, accurate meteorological forcing data and appropriate hydrological models are essential for evaluating catchment-scale water budgets. Degree-day or temperature-index models remain limited because they poorly represent the energy balance that drives snow and glacier melt (Dahri et al. 2021).
A significant climate-related concern in the region is the sharp rise in extreme rainfall events, which enhances the risk of floods, landslides, and other natural hazards (Singh et al. 2016). Combined with anthropogenic pressures such as land-use change, infrastructure expansion, and encroachment, these changes degrade ecosystem services and intensify hydrological instability (Wakeel et al. 2005; Sharma et al. 2007; Raman, Punia 2012; Boykoff, Yulsman 2013). To address these challenges, long-term monitoring of snow, ice, and water is essential, along with improved datasets to understand shifts in water demand and socioeconomic vulnerability (Pramanik, Bhaduri 2016).
Major uncertainties persist in quantifying the contributions of glacial melt, snow melt, and rainfall to total river discharge, especially in high-altitude catchments with heterogeneous terrain (Bolch et al. 2012; Cogley 2012). Studies already indicate declining snowfall, increasing melt rates, and shifts in melt season timing, processes that strongly influence streamflow seasonality and water security. Field measurement remains difficult due to logistical and accessibility constraints, prompting increased reliance on remote sensing for snow cover, glacier area, and ice volume mapping (Kääb et al. 2012; Gardelle et al. 2013; Shangguan et al. 2014). However, with climate change rapidly altering these environments, cryospheric measurements are urgently needed (Rohrer et al. 2013; Ragettli et al. 2015).
Overall, climate change is reshaping the hydrological regime of the Indian Himalayan region by affecting snowfall patterns, melt processes, rainfall extremes, and downstream water availability. Strengthening observational networks and improving process-based modeling will be critical for understanding and managing these evolving hydrological risks.
9. Data limitations and gaps in high-altitude hydrology
Various observations made so far have made it clear that assessment of high-altitude hydrology is a challenging task. Several factors can be responsible, including complex topography, limited availability of in-situ data, and uncertainties in modeling approaches. It has been observed that due to the scarcity of in-situ data, modeling studies have been conducted based on modeled data with numerous uncertainties, and hence, the results obtained from such studies will also have a certain level of ambiguity. High-altitude hydrology remains poorly understood, along with all the possible changes that will be observed in river flow in the near future. This lack of understanding can be attributed to high meteorological variability, physical inaccessibility, and the complex interactions between cryospheric and hydrological processes under the influence of climate change (Ragettli et al. 2016). Several hydrological studies have been conducted to quantify the impacts of climate change on the hydrological systems in the Himalaya (Sharma et al. 2000; Singh et al. 2016). The major constraint in the IHR is the unavailability of climate data, which results in limited meteorological input for hydrological modeling. The poor availability of in-situ parameters makes it necessary to use modeled data (e.g., IPCC GCMs) or averaged data from stations within the region or at similar elevations, and therefore, the direct and indirect effects of climate change in the more remote areas are poorly understood (Lesher 2011). To estimate the contribution of streamflow components (glacier melt, snowmelt, and runoff) to the total runoff, numerous hydrological model applications have been conducted over various catchments. Few studies use models that are data-intensive (Zhao et al. 2013; Ren et al. 2018); that is, they require more input parameters and thus become difficult to implement on a large spatial scale in a data-limited region such as the Himalayas. Moreover, most of the hydrological models do not include a glacier module to compute the glacier melt contribution. Earlier models did not include debris-covered glaciers, and few of the models include the effects of the topography of glaciers, a proper volume-area scaling formulation, and the impact of debris cover (Zhang et al. 2013). The major drawback that has been observed in hydrological modeling studies over glacierized catchments is that many studies have not included observations about the cryosphere other than initial glacier outlines (Prasch et al. 2013; Ragettli et al. 2013; Nepal et al. 2014). The use of fewer response variables in the modeling increases the risk of predictive uncertainty in the results (Beven 2000). Most of the meteorological stations are situated at lower altitude, i.e., ~3000 m above sea level (m.a.sl); there are very few stations in alpine zones. As a result, it has been observed that the meteorological data that have been used in modeling studies are being collected from stations below glacier elevation (Leng et al. 2023). There is limited consideration of debris thickness impacts on glacier melt in such studies, mainly due to data scarcity at higher elevations. The correct representation of internal states and process dynamics in glaciohydrological models often cannot be verified because of missing in situ measurements (Ragettli et al. 2015). Retreating glaciers not only affect the environment and hydrological regimes but also have livelihood and economic impacts on the downstream population. These implications will disturb the traditional knowledge and beliefs of the local communities (Allison 2015). It has been evident from the few studies carried out for IHR that difficult terrain and weather conditions also contribute to data scarcity in the region. This has increased the uncertainties and restricted the understanding of the probable impacts of changing climate in the region. Therefore, it is important to carry out studies that will help to generate a database and reduce the uncertainties about the changes observed in the IHR (Singh et al. 2016). A large knowledge gap exists related to the impact of climate change on water resources. In the present scenario, climate change effects on water resources and related hazards in the Himalayas and their downstream river basins are poorly understood.
9.1. Uncertainties in modeling climate change impacts
Uncertainties in modeling studies and delicate hydro-meteorological investigations have posed a serious constraint in assessing the impact of climate change on the hydrometeorology (Dahri et al. 2021). Numerous studies have attempted to assess and model the hydrological regime of the high-altitude western Himalayas (Archer 2003; Hasson 2016; Lutz et al. 2016; Hasson et al. 2019), yet there are significant uncertainties, and our understanding of the basin's hydrological regime remains poor. The greatest uncertainties are associated with the use of non-representative (mostly underestimated) precipitation in the higher altitude areas, which receive the bulk of precipitation and make major contributions to streamflow. In the case of a glacierized basin that is predominantly a snow and glacier-fed system, the temperature-index or degree-day based hydrological models may not accurately simulate the prevailing energy balance, which is the main driving force for streamflow generation from the snow and glacier systems. Their application is mainly limited to simulation of melt rates at daily or coarser resolution (Hock 2003; Pellicciotti et al. 2005). Assessment of the future hydrological regime is primarily constrained by very high uncertainties in the GCM outputs for the study domain. Specific knowledge of IHR with respect to climate change indicators is lacking due to both the inaccessibility of the location and the insufficient theoretical attention given to the complex interactions of spatial scales in weather and climate phenomena in mountain areas.
The Ministry of Environment & Forest (MoEF) discussion paper reported that over the past 100 years, the Himalayan glaciers have shown an erratic pattern. A study conducted for Sonapani glacier revealed that the glacier has retreated by about 500 m during the past 100 years, whereas another study for Kangriz glaciers has not shown any reasonable retreat in the same period; the glacier has retreated less than an inch. A study reported that the Siachen glacier increased in length by 700 m from 1862 to 1909, retreated from 1929 to 1958 (400 m), and for the past 50 years, negligible retreat has been observed. Gangotri glacier showed a significant and rapid retreat of 20 m per year, but has slowed more recently (National Research Council 2012). A similar trend has been observed for Bhagirath Kharak and Zemu glaciers. There are numerous underlying factors, physical features, and a complex interplay of climatic factors that may be responsible for such contrasting behavior. Besides such statements, there are a few studies that have reported that one of the major impacts of climate change over the glacierized region has been an increase in the formation of glacier lakes. The remote nature and lack of meteorological stations and stream flow data in many high-altitude lakes in the Himalayas limit the availability of data required to model the water balance of a watershed or lake, and therefore, few lakes in the Himalayas have been modeled (Lesher 2011). To understand the complex glacier and hydrology interaction, glacio-hydrological models are considered indispensable tools. This coupled approach makes it easy to understand the characteristics of a catchment and its response to climate. But this modeling approach also has its fair share of uncertainty and complications that make the application of such models at high altitudes a challenging task. They are subject to several factors that include: (1) a lack of representative data to force the models (Huss et al. 2014; Pellicciotti et al. 2014), (2) simplifications in model structure due to insufficient process understanding and the scarcity of detailed information about glacio-hydrological processes (Huss et al. 2014), and (3) parametric uncertainty due to insufficient quality or quantity of data for model calibration and validation (Ragettli et al. 2013; 2015).
Given the multitude of control factors, often acting at relatively fine scales, current projections of global glacier change models do not adequately constrain the mechanisms underlying the variations in river flow from high-altitude catchments. It is therefore uncertain whether such models can correctly capture the response times and the magnitudes of future changes. (Marzeion et al. 2012; Huss, Hock 2015; Ragettli et al. 2016). Due to a lack of observed meteorological data and extremely complex orography interacting with synoptic-scale atmospheric circulation, it can be concluded that significant uncertainties still exist to hamper precise representation of the basin's hydrometeorological regime (Andermann et al. 2012; Lutz et al. 2014). The greatest uncertainties in the higher-altitude areas are associated with the spatiotemporal distribution of precipitation and the dynamics of glacial ice mass. Structural limitations of the climate and hydrological modeling frameworks, and lack of reliable and representative observations for bias corrections and validations also impose limitations.
9.2. Data scarcity: implications for model uncertainties and calibration
Hydrological modeling in data-scarce regions such as the Himalayan river basins is fundamentally constrained by the limited availability of reliable meteorological observations. Basic variables such as precipitation, temperature, humidity, and snow parameters are either sparsely measured or completely absent across high-altitude regions due to harsh terrain, inaccessibility, and logistical challenges (Immerzeel et al. 2014; Nepal et al. 2017). As a result, modelers often rely on interpolated or gridded meteorological datasets to drive hydrological models. While these datasets offer spatially continuous coverage, they come with inherent uncertainties related to coarse resolution, interpolation algorithms, and biases arising from sparse ground-truth observations (Huffman et al. 2010; Karger et al. 2017). Interpolated gridded temperature and precipitation products are commonly applied in large-scale hydrological models; however, their quality is typically evaluated only by cross-validation using the limited station network available (Freudiger et al. 2016). This limitation raises critical concerns regarding their representativeness in high-altitude catchments where observation density is extremely low (Freudiger et al. 2016). For example, precipitation in the Himalayas exhibits considerable spatial variability due to elevation, aspect, and orographic effects and patterns that are often poorly captured by coarse-resolution datasets. Conventional gauge-based rainfall estimates may be accurate locally, but interpolations to ungauged regions in complex terrain often yield approximations that deviate substantially from actual rainfall (Bookhagen, Burbank 2010; Palazzi et al. 2013).
Remote sensing products and global reanalysis datasets have emerged as valuable substitutes in data-sparse regions such as the Indian Himalayan Region (IHR). Studies increasingly utilize products such as ERA-Interim, ERA5, JRA-55, and APHRODITE for hydrological simulations. ERA-Interim and JRA-55 precipitation has been used along with observed datasets. It has been reported that these gridded datasets overestimate precipitation because of spatial variability, and this effect transfers to streamflow predictions. JRA-55 produced higher peaks, and ERA-Interim results were comparatively closer to station-driven simulations. Similar findings have been reported across the Himalayas, where reanalysis datasets frequently overestimate winter precipitation and underestimate convective summer rainfall, adversely affecting calibration and validation outcomes (Soncini et al. 2017; Sabin et al. 2020). These biases directly translate into uncertainties in simulated streamflow, snowmelt contributions, and extreme event estimation. Consequently, hydrological models such as SWAT, VIC, and HBV require careful bias-correction and multi-dataset intercomparison to ensure reliable performance in such regions (Ménégoz et al. 2013; Dahri et al. 2018). The scarcity of observed hydro-meteorological data in the IHR continues to be a major source of uncertainty in hydrological modeling. Improving station density, integrating multisource products, and adopting calibration strategies such as regionalization or multi-objective optimization remain essential for reducing uncertainties and strengthening model reliability.
9.3. Application of bias-corrected and downscaled climate projections in Himalayan hydrologic models
The complex spatial climatic characteristics of the Himalayas pose significant challenges for regional climate models (RCMs), making some form of correction essential before applying RCM simulations for hydrological assessments. In recent years, simple bias-correction techniques have been complemented or replaced by more advanced methods. Several studies across the IHR have applied both simple (linear scaling) and more complex (quantile mapping) bias-correction techniques for temperature and precipitation. Bias correction substantially improved the wetter and colder RCM estimates, and hydrological model responses further demonstrated its importance. However, many studies observed no major difference between the outputs of linear scaling and quantile mapping, because both techniques exhibit almost identical performance, suggesting that simpler methods may be sufficient in certain Himalayan applications (Shrestha et al. 2017). SWAT has also been confirmed as a suitable model for hydrological analysis in Himalayan basins at both monthly and daily time scales (Shrestha et al. 2017; Swain et al. 2022). Further work projecting future hydrological changes using a multi-GCM, multi-bias correction method (BCM) and multi-parameter ensembles, identified three major sources of uncertainty: GCM selection, bias collection methods, and model parameterization. Studies highlight that GCM-related uncertainty can be substantially reduced through bias correction, indicating that the number of GCMs used becomes less critical once they are corrected. Although using more GCMs is generally recommended, it also incurs significant computational cost. Notably, Wang et al. (2020) found that uncertainty trends remained largely unchanged when more than two GCMs were included. Similar conclusions were drawn in recent analysis over the western Himalayas, demonstrating that uncertainty from GCMs, bias-correction techniques, and hydrological model structure collectively influences future hydrological projections (Mehboob, Kim 2024).
A few studies have applied CMIP6 global climate model outputs in Himalayan regions, where projections have been statistically downscaled using tools such as SDSM, and bias-corrected with CMhyd to improve their suitability for hydrological applications (IPCC 2021; Alasqah et al. 2025). Although downscaling provides a reasonable fit, CMIP6 models still exhibit uncertainty-related biases, particularly in precipitation, due to strong variability in spatial patterns and emission scenarios. Projections generally indicate rising temperatures, with potential decreases in rainfall in arid regions and increases in humid areas, offering useful insights into future water resource conditions. However, studies across the Himalayas have shown that non-linear bias correction techniques significantly improve precipitation estimates, especially for extremes, which are often underrepresented in widely used gridded datasets. Overall, while CMIP5 and CMIP6 projections are valuable for climate and hydrological assessments in the Himalayas, their effective use requires robust downscaling and bias correction to reduce persistent uncertainty in complex mountain terrain (Alasqah et al. 2025).
10. Implications for decision-makers and stakeholders
Hydrological modeling in the Himalayan river basin offers critical support for informed water resource planning, particularly in regions that are highly sensitive to climatic variability and limited by scarce observational data. Integrated modeling tools enable the estimation of natural and altered flow conditions, including dry-season recession flows, and can incorporate locally available observations to improve simulation accuracy. GIS-based interfaces further streamline catchment delineation and flow assessment, allowing water managers to quickly generate transparent, reproducible outputs that guide the design and placement of irrigation systems, hydropower projects, and other water resource interventions. Such tools are also effective for multi-stakeholder dialogues, helping decision-makers communicate the implications of various water-use scenarios in a clear and accessible manner.
For policymakers, the use of hydrological models enhances understanding of spatial and temporal variations in water availability, aids drought preparedness, and informs long-term investment in climate-resilient practices. Although numerous models exist, careful consideration is needed to determine which modeling approaches and datasets are most appropriate for Himalayan conditions, especially in snow and glacier-fed catchments. Equally important is assessing how model outputs translate into societal impacts, such as implications for downstream communities, equity in water distribution, and the capacity of local institutions to adapt to changing hydrological regimes. Strengthening hydrological modeling and integrating its insights into planning processes will be crucial for building resilience and supporting sustainable water management across the IHR.
11. Conclusion – research needs and future directions
Hydrological research in the Himalayas urgently requires improved observational networks, long-term in situ measurements, and standardized data collection to reduce uncertainties in modeling snow and glacier-fed catchments. Future studies should prioritize high-resolution climate datasets, process-based hydrological models, and integrated remote sensing approaches to better capture the complex hydro-climatic dynamics of the region. Strengthening interdisciplinary collaborations and enhancing monitoring of snow, ice, and runoff will be essential for developing reliable projections and effective climate-adaptation strategies for the Himalayan basin.
11.1. Future research opportunities
Climate change is expected to exert significant impacts on snowmelt and glacier runoff across the Himalayas (Brock et al. 2000; Immerzeel et al. 2014; Ragettli et al. 2016). Minimum temperature, an important control on precipitation type in mountainous terrain, is among the least studied parameters in the IHR, with limited long-term observations except for a few studies (Bhutiyani et al. 2007). The rapid rise in minimum temperature observed, particularly in the western IHR, warrants continued investigation using extended instrumental records. Future studies should further examine the relationships between climatic variables, glacier discharge, and basin-scale hydrology, along with improved projections of streamflow variability (Singh et al. 2016). High-resolution, process-based modeling efforts remain essential for capturing the complex hydro-climatic behaviour of high-altitude catchments (Viviroli et al. 2011; Fernández, Mark 2016; Ragettli et al. 2016). Strengthening coordination among research organizations is also necessary to guide climate adaptation, forest conservation, and soil erosion control efforts across the region (Pramanik, Bhaduri 2016).
Glaciological studies continue to face major challenges from limited accessibility and sparse field data; hence, most predictive assessments still rely on secondary datasets. Establishing long-term monitoring stations and standardizing measurement protocols are critical for reducing uncertainties in hydrological research outcomes (Pramanik, Bhaduri 2016). Despite advances in climate modeling, substantial uncertainty persists in simulating current and future climate processes in the Himalayas, marking this as an ongoing research priority (Knutti, Sedláček 2013; Dahri et al. 2021).
In addition, emerging opportunities lie in applying machine learning (ML) and hybrid physics-ML models for snow cover mapping, glacier mass balance reconstruction, streamflow forecasting, and gap-filling sparse hydro-meteorological datasets. ML approaches – when combined with physically based models and remote sensing inputs – can significantly enhance predictive skill in data-scarce Himalayan basins and help reduce model uncertainties (Ouyang et al. 2025).
11.2. Recommended models for Himalayan basins
Comparing fully distributed and semi-distributed hydrological models such as SPHY, HBV, and HECHMS provides a robust basis for discharge estimation in Himalayan catchments. Semi-distributed models like HBV-Light and HEC-HMS often outperform SPHY in data-scarce regions because their parameterization requirements are relatively modest, making them more suitable for the limited observational network available. Future simulations can be further improved by integrating satellite-based products and reanalysis datasets to supplement sparse in situ observations (Abbaspour et al. 2015; Arora et al. 2024). With ongoing climatic changes affecting snow and glacier energy balance, the need for enhanced ground-based measurements and models that can incorporate such observations is increasingly emphasized (Rohrer et al. 2013; Ragettli et al. 2015).
While semi-distributed glacio-hydrological models have yielded satisfactory results across many Himalayan basins, the region's high spatial heterogeneity and sensitivity to climate forcing underscore the importance of adopting coupled approaches. These approaches integrate field observations, physically based modeling, and advanced Artificial Intelligence (AI), Machine Learning (ML)/Deep Learning (DL), capture complex, nonlinear processes, and handle diverse, multi-source datasets: capabilities that traditional models often lack (Maity et al. 2024). Emerging research demonstrates promising applications of AI/ML/DL in precipitation forecasting, evapotranspiration estimation, groundwater variability assessment, and extreme event prediction (floods or compound events).
Furthermore, the adoption of Explainable AI (XAI) and transfer learning can enhance interpretability, improve cross-basin adaptability, and support stakeholder trust in these advanced models (Ouyang et al. 2025). Overall, integrating AI/ML/DL with conventional process-based hydrological models represents a transformative shift toward more accurate, scalable, and reliable hydrological predictions for the Himalayan region.