1. Introduction
Sudan is situated at the intersection of North Africa and the eastern Sahel, encompassing a broad range of climatic zones from hyper-arid deserts in the north to semi-arid savannahs in the south. This geographic and climatic diversity renders the country highly sensitive to variations in temperature and precipitation. Rising temperatures, intensified heat extremes, and shifts in seasonal climate patterns pose significant risks to food security, water availability, energy demand, and public health. With more than 80 % of the population dependent on rain-fed agriculture and pastoral livelihoods, even modest warming can substantially disrupt crop yields, livestock productivity, and hydrological systems (NUPI, SIPRI 2022; WBG 2023).
Historically, Sudan’s climate exhibits pronounced spatial and seasonal gradients. Mean annual temperatures are high across the country, ranging from approximately 22°C in the southern regions to >28°C in the northern deserts, with summer (June-September) and winter (December-February) as the two dominant seasonal periods affecting agricultural and water-resource planning. Observational analyses indicate a consistent warming trend across Sudan over the past five decades, in line with regional and global signals of anthropogenic climate change (NUPI, SIPRI 2022). Nevertheless, high-resolution projections of future seasonal temperatures remain limited, hindering robust adaptation planning.
Global climate models (GCMs) from the Coupled Model Intercomparison Project Phase 6 (CMIP6) provide a state-of-the-art framework for assessing potential future climates under alternative socioeconomic and emissions pathways. The Shared Socioeconomic Pathways (SSPs) describe internally consistent scenarios linking demographic, economic, and technological developments with greenhouse-gas emissions. Of particular relevance to mid- and late-century planning are SSP2-4.5, a “middle-of-the-road” scenario representing intermediate mitigation, and SSP5-8.5, a high-emission trajectory reflecting limited mitigation efforts (Almazroui et al. 2020). These scenarios encompass plausible futures for Sudan’s climate and provide a foundation for evaluating adaptation strategies.
Although numerous studies have examined climate trends across the broader Sahel, most focus on precipitation or annual mean temperature and often employ coarse spatial resolution. Seasonal-scale temperature projections for Sudan, particularly those that resolve sub-national gradients and inter-model uncertainty, remain scarce. Recent African climate assessments highlight warming trends but often aggregate Sudan into larger sub-regions, obscuring spatial patterns critical for local adaptation (NUPI, SIPRI 2022; WMO 2024). The spread between models, internal climate variability, and systematic biases further complicate interpretation if not addressed through bias correction and ensemble analysis.
To address these knowledge gaps, this study applies high-resolution (0.5°) bias-corrected CMIP6 simulations to quantify projected seasonal and annual temperature over or mid-century (2041-2060) and end-of-century (2081-2100). Bias correction is performed using Equidistant Quantile Mapping (EQM), a well-established statistical approach that reduces systematic model errors while preserving projected climate signals (Cannon et al. 2015). By focusing on annual, summer, and winter anomalies relative to the 1995-2014 baseline, and explicitly assessing inter-model agreement and spread, this study provides a scientifically rigorous, high-resolution assessment of future temperature changes over Sudan.
The primary objectives of this study are to quantify projected seasonal temperature changes across Sudan for the periods 2041-2060 and 2081-2100 under the SSP2-4.5 and SSP5-8.5 scenarios, respectively, and to evaluate the spatial distribution of warming to identify regions and seasons most vulnerable to increasing temperatures. By achieving these objectives, this work delivers a robust, high-resolution assessment of mid- and late-century temperature change over Sudan.
2. Data and study area
2.1. Data sources
Near-surface air temperature data were derived from two primary sources. Observational data were obtained from the Climate Research Unit (CRU) monthly dataset, version 4.09 (Harris et al. 2023) at 0.5° × 0.5° resolution for 1995-2014, providing a robust baseline for model evaluation and bias correction. Historical and future projections for the mid-century (2041-2060) and late-century (2081-2100) periods were obtained from ten CMIP6 models under the SSP2-4.5 (moderate emissions) and SSP5-8.5 (high emissions) scenarios. CMIP6 datasets were accessed via https://data.ceda.ac.uk/badc/cmip6/data/CMIP6/.
All CMIP6 datasets were re-gridded to the CRU grid (0.5° × 0.5°) to ensure spatial consistency and were subsequently bias-corrected against the observational reference. Only models with complete monthly coverage over the historical period were included. A full list of models, along with their horizontal resolutions, variant labels, and key references, is provided in Table 1. These datasets were used to evaluate projected changes in near-surface air temperature over Sudan.
Table 1.
CMIP6 models used in this study, with horizontal resolution, variant label, and source institute.
| No. | CMIP6 Model | Institute/Country | Resolution (°) | Variant label | Reference |
|---|---|---|---|---|---|
| 1 | ACCESS-ESM1-5 | CSIRO & Bureau of Meteorology/Australia | 1.9° × 1.3° | r1i1p1f1 | Ziehn et al. (2020) |
| 2 | BCC-CSM2-MR | Beijing Climate Center/China | 1.1° × 1.1° | r1i1p1f1 | Wu et al. (2019) |
| 3 | FIO-ESM-2-0 | First Institute of Oceanography/China | 1.3° × 0.9° | r1i1p1f1 | Bao et al. (2019) |
| 4 | GISS-E2-1-G | NASA Goddard Institute for Space Studies/USA | 2° × 2.5° | r1i1p1f1 | Kelley et al. (2020) |
| 5 | HadGEM3-GC31-LL | Met Office Hadley Centre/UK | 1.9° × 1.3° | r1i1p1f3 | Jones et al. (2024) |
| 6 | INM-CM4-8 | Institute of Numerical Mathematics/Russia | 2° × 1.5° | r1i1p1f1 | Volodin et al. (2023) |
| 7 | KACE-1-0-G | Korea Meteorological Administration/South Korea | 1.3° × 0.9° | r1i1p1f1 | Byun et al. (2023) |
| 8 | MPI-ESM1-2-HR | Max Planck Institute for Meteorology/Germany | 0.9° × 0.9° | r1i1p1f1 | Gutjahr et al. (2019) |
| 9 | TaiESM1 | Research Center for Environmental Changes/Taiwan | 1.3° × 0.9° | r1i1p1f1 | Lee et al. (2020) |
| 10 | UKESM1-0-LL | Met Office Hadley Centre & UK partners/UK | 1.9° × 1.3° | r1i1p1f2 | Sellar et al. (2019) |
2.2. Study area
The study encompasses the entire territory of Sudan, which extends from approximately 8° N to 23.5° N in latitude and from 21° E to 39° E in longitude. Sudan spans a broad climatic gradient, ranging from hyper-arid deserts in the north to semi-arid plains and savannah landscapes in the central and southern regions. This gradient produces pronounced spatial differences in temperature, rainfall, and seasonal climate patterns, resulting in distinct hot-dry and cooler-wet periods across the country (Funk et al. 2011; WBG 2023).
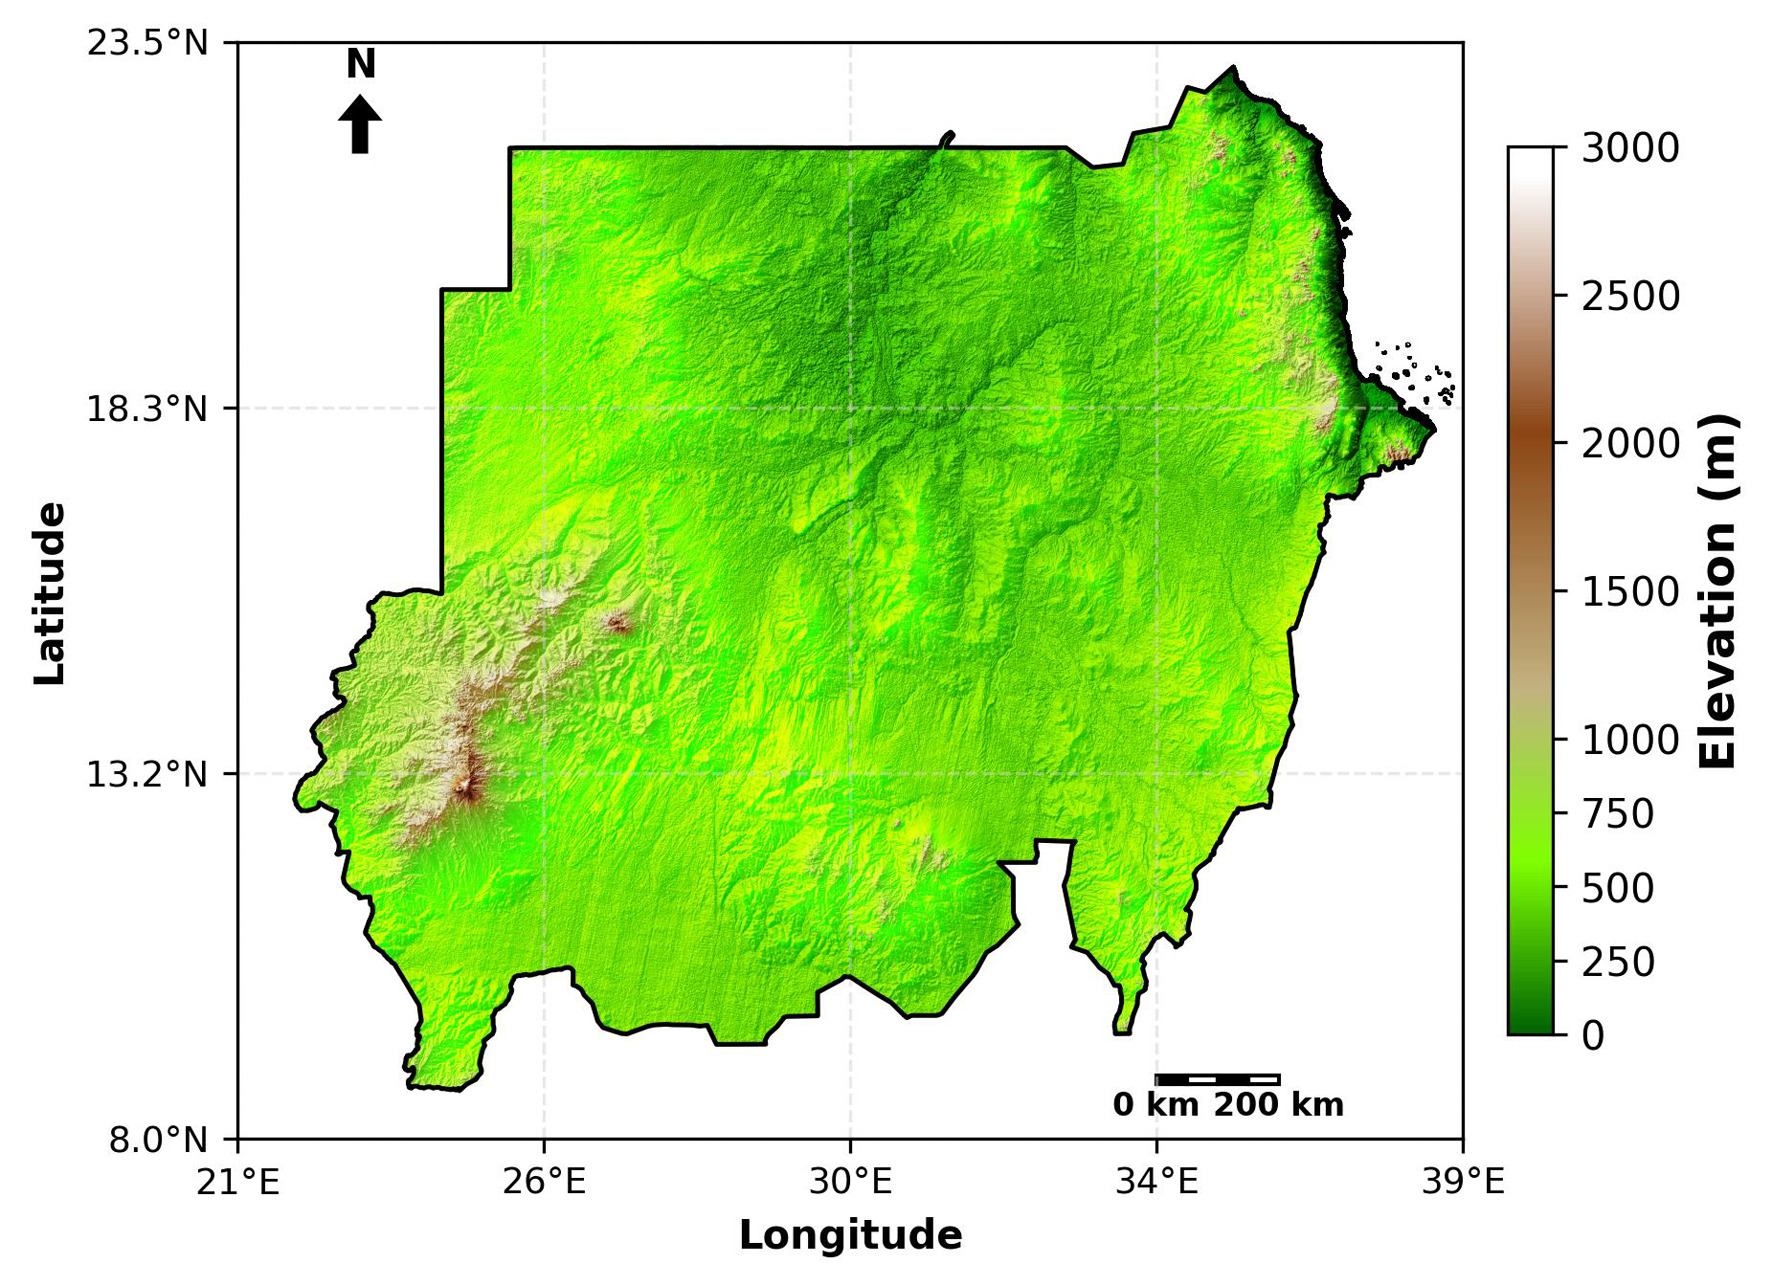
Mean annual temperatures generally range from around 22°C in the southern savannahs to above 28°C in the northern deserts. Topography and elevation strongly influence local and regional temperature regimes and climate variability. Elevation ranges from roughly 200 m above sea level in the southern plains to approximately 1,800 m in the northern and eastern highlands, with the Jebel Marra volcanic massif in western Sudan rising above 3,000 m (Fig. 1). These topographic differences, along with land cover, soil properties, and proximity to rivers, shape local and topo-climatic conditions and modulate the distribution of heat across the country (WMO 2024).
Fig. 1.
Topographic map of Sudan illustrating elevation gradients from 200 m in the southern plains to 1,800 m in the northern and eastern highlands, with Jebel Marra exceeding 3,000 m.
Sudan’s sensitivity to climate variability, reliance on rain-fed agriculture, limited water resources, and exposure to extreme heat events make understanding seasonal temperature variability particularly important. Characterizing temperature changes across these diverse climatic zones provides essential information for agricultural planning, water-resource management, and public-health preparedness. A spatially explicit understanding of warming patterns is therefore critical for informing adaptation strategies and mitigating the impacts of projected mid-century temperature increases (NUPI, SIPRI 2022; WBG 2023).
3. Methodology
3.1. Bias correction
CMIP6 model outputs were bias-corrected against CRU TS 4.09 observations to reduce systematic deviations in historical simulations and improve the reliability of future projections. Two complementary methods were employed: Empirical Quantile Mapping (EQM) for historical simulations and Delta Quantile Mapping (DQM) for future projections.
EQM is a non-parametric technique that adjusts the cumulative distribution of simulated values to match the observed distribution. For a raw model value Xraw, the bias-corrected value is defined as:
where Fmod represents the empirical cumulative distribution function (CDF) of the model data, and Fobs−1 is the inverse CDF of the observational data (Gudmundsson et al. 2012). Applying EQM ensures that historical simulations accurately reflect observed climatology, providing a validated baseline for subsequent analyses.
Delta Quantile Mapping (DQM) was applied to future projections to adjust biases while preserving the projected climate signal. For a future model value Xfut, the corrected value is given by:
where p represents the percentile of the future value within the historical model distribution Fmod,mod,hist (Xavier et al. 2022). This method preserves anomalies relative to the historical period while adjusting for systematic biases. Comparative evaluations have shown that quantile-based methods such as DQM maintain the climate change signal more reliably than traditional quantile mapping techniques (Lehner et al. 2023).
Using both EQM and DQM provides a robust framework for assessing projected temperature changes. EQM ensures the historical baseline is accurate, while DQM allows future projections to retain their physical consistency, enabling reliable quantification of seasonal and annual temperature anomalies as well as inter-model uncertainty over Sudan.
3.2. Data processing, ensemble statistics, and model agreement
Monthly mean near-surface air temperature (TAS) from ten CMIP6 GCMs and CRU observational data (CRU TS 4.09; Harris et al. 2023) were aggregated into annual, summer, and winter climatologies for the 1995-2014 baseline period. To ensure spatial consistency with observations, all CMIP6 outputs were regridded to the CRU 0.5° × 0.5° latitude–longitude grid using conservative remapping in the Climate Data Operators (CDO) and masked to Sudan’s national boundary.
Future projections under SSP2-4.5 and SSP5-8.5 were evaluated for the mid-century (2041-2060) and late-century (2081-2100) periods. For each SSP and season, the multi-model ensemble mean was used to represent the central tendency of projected monthly mean TAS changes, while the ensemble standard deviation quantified inter-model spread. Grid cells where at least two-thirds of models projected warming of the same sign were classified as regions of likely change (≥66 % model agreement), following standard CMIP6 assessment protocols (Eyring et al. 2016; IPCC 2021).
Projected changes were tested for statistical significance at each grid cell using a two-sample Student’s t-test, comparing the historical baseline period (1995-2014) with the mid- and late-century periods. Grid cells with p < 0.05 were considered significant. Significance hatching in figures is applied only where both the t-test criterion and the ≥66 % model-agreement criterion are satisfied, ensuring that displayed changes reflect robust forced signals rather than natural variability (IPCC 2021; Harris et al. 2023).
3.3. Bias correction evaluation metrics
The fidelity of CMIP6 simulations over the 1995-2014 baseline was evaluated using the Pearson correlation coefficient, the modified Kling-Gupta Efficiency (KGE'), and Taylor diagrams (Taylor 2001; Kling et al. 2012; Enyew et al. 2024).
The modified Kling-Gupta Efficiency (KGE') combines correlation, variability ratio, and coefficient-of-variation ratio into a single metric, providing a robust assessment of model skill relative to CRU observations:
where r is the spatial correlation between model and observations,
is the ratio of coefficients of variation (CV), with 𝜎 denoting the standard deviation and 𝜇 the mean. Specifically,
Taylor diagrams were employed to visualize the spatial correlation, normalized standard deviation, and centered root-mean-square difference (CRMSD) for individual models and the ensemble mean. EQM bias-corrected outputs were included in this evaluation to illustrate improvements in model performance following systematic bias correction.
4. Results
4.1. Temperature climatology and annual cycle (1995-2014)
The spatial distribution and temporal variability of mean annual temperature across Sudan during 1995-2014 are shown in Figure 2a. Observed mean annual temperatures exhibit substantial spatial variability, ranging from 17.9°C to 30.33°C. The coolest conditions (<20°C) occur in the northern desert regions, whereas the warmest conditions (>30°C) are observed in the central and southern parts of the country. The national mean temperature is 27.76°C, with a median of 28.31°C and a standard deviation of 1.80°C, reflecting moderate variability across Sudan.
Fig. 2.
Mean annual temperature over Sudan (1995-2014): (a) spatial distribution based on CRU observations; (b) annual cycle comparing CRU observations with the ensemble mean of 10 CMIP6 models.
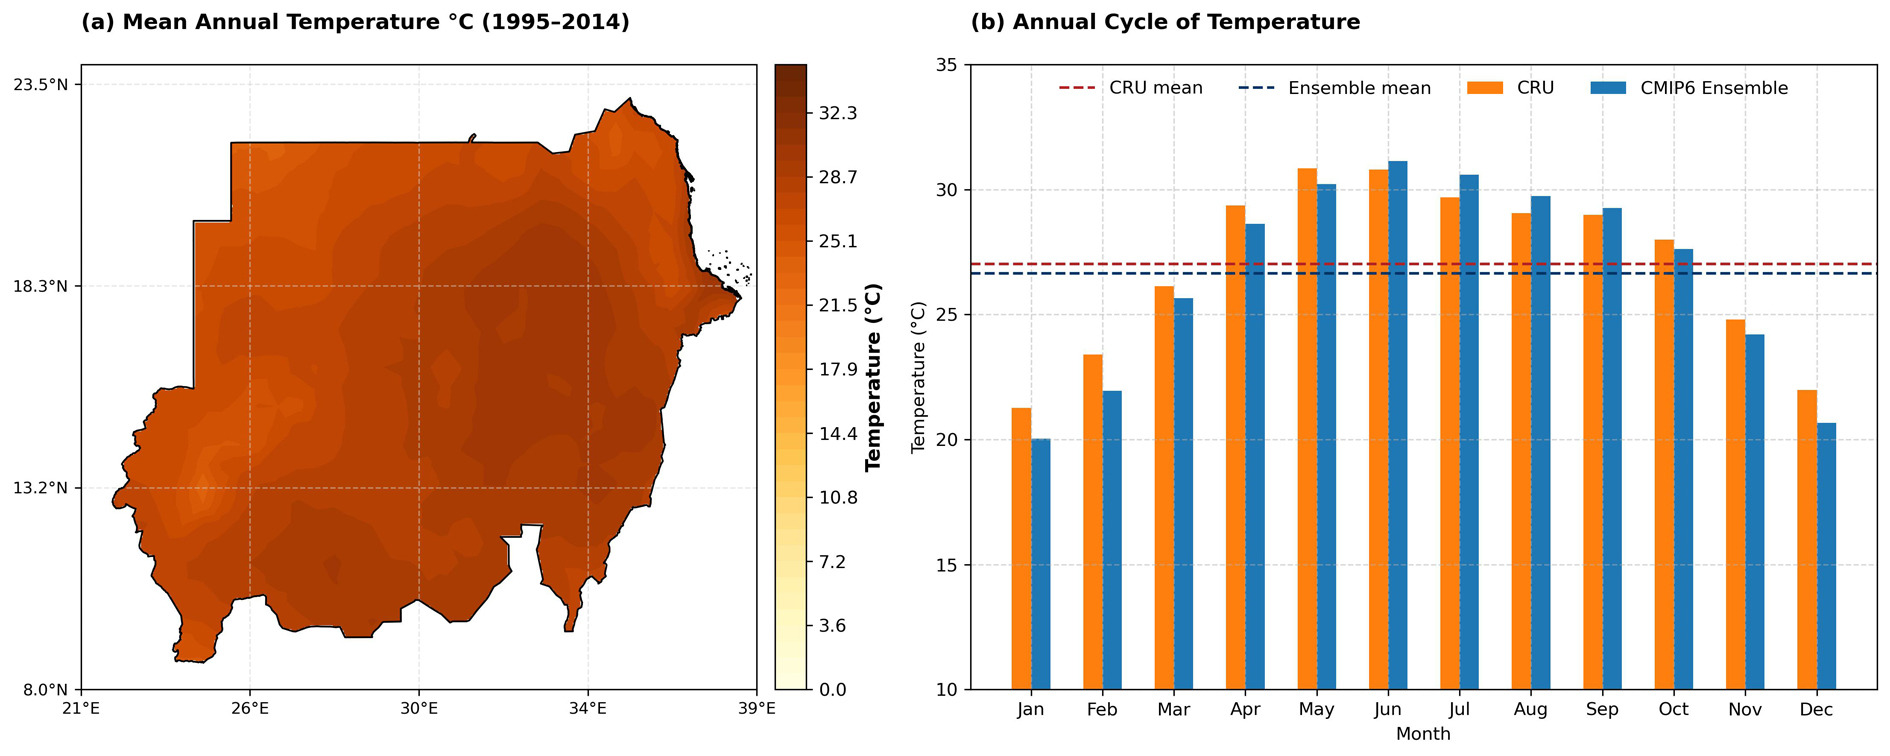
The annual cycle of observed and simulated temperatures over Sudan is illustrated in Figure 2b. The CMIP6 ensemble successfully reproduces the characteristic seasonal evolution of temperatures across the country; however, noticeable departures from observations persist throughout the year. The ensemble shows a slight warm anomaly during the peak summer season (+0.55°C), marking the only period in which simulated temperatures exceed the CRU observations. During winter, the ensemble underestimates temperatures by −1.33°C (CRU: 22.21°C; Ensemble: 20.88°C), representing the most pronounced cold deviation of the year. For the other seasons, the simulated annual temperature cycle in the CMIP6 ensemble is within approximately 1°C of the observations. On the annual scale, the ensemble mean (26.65°C) remains close to the CRU estimate (27.03°C), resulting in a modest annual bias of −0.38°C.
Taken together, these results demonstrate that, while the ensemble captures the overarching structure and timing of Sudan’s annual temperature cycle, persistent but seasonally distinct deviations remain – most notably the summer warm excess contrasted with the larger winter cold bias. This integrated view of spatial climatology and seasonal evolution provides a robust baseline for evaluating climate model performance and bias-correction procedures.
4.2. Evaluation of temperature bias correction
The Empirical Quantile Mapping (EQM) method substantially improves the performance of CMIP6 temperature simulations over Sudan during 1995-2014 (Fig. 3). After correction, model standard deviations converge to a narrow range (3.32-3.37°C), nearly matching the CRU reference (3.34°C) and contrasting with the broader spread in the raw simulations (3.28-4.56°C). CRMSD values decrease markedly from 1.35-1.77°C in the raw data to 0.90-0.97°C after correction, indicating closer alignment with the observed spatio-temporal temperature structure. Correlation coefficients remain high (≈0.96), showing that EQM reduces systematic biases without altering the underlying temporal signal.
Fig. 3.
Evaluation of CMIP6 temperature simulations over Sudan (1995-2014). Left: heatmaps of raw and EQM-corrected model performance (Bias, CRMSD, correlation, KGE). Right: Taylor diagram showing improved agreement with CRU after bias correction.
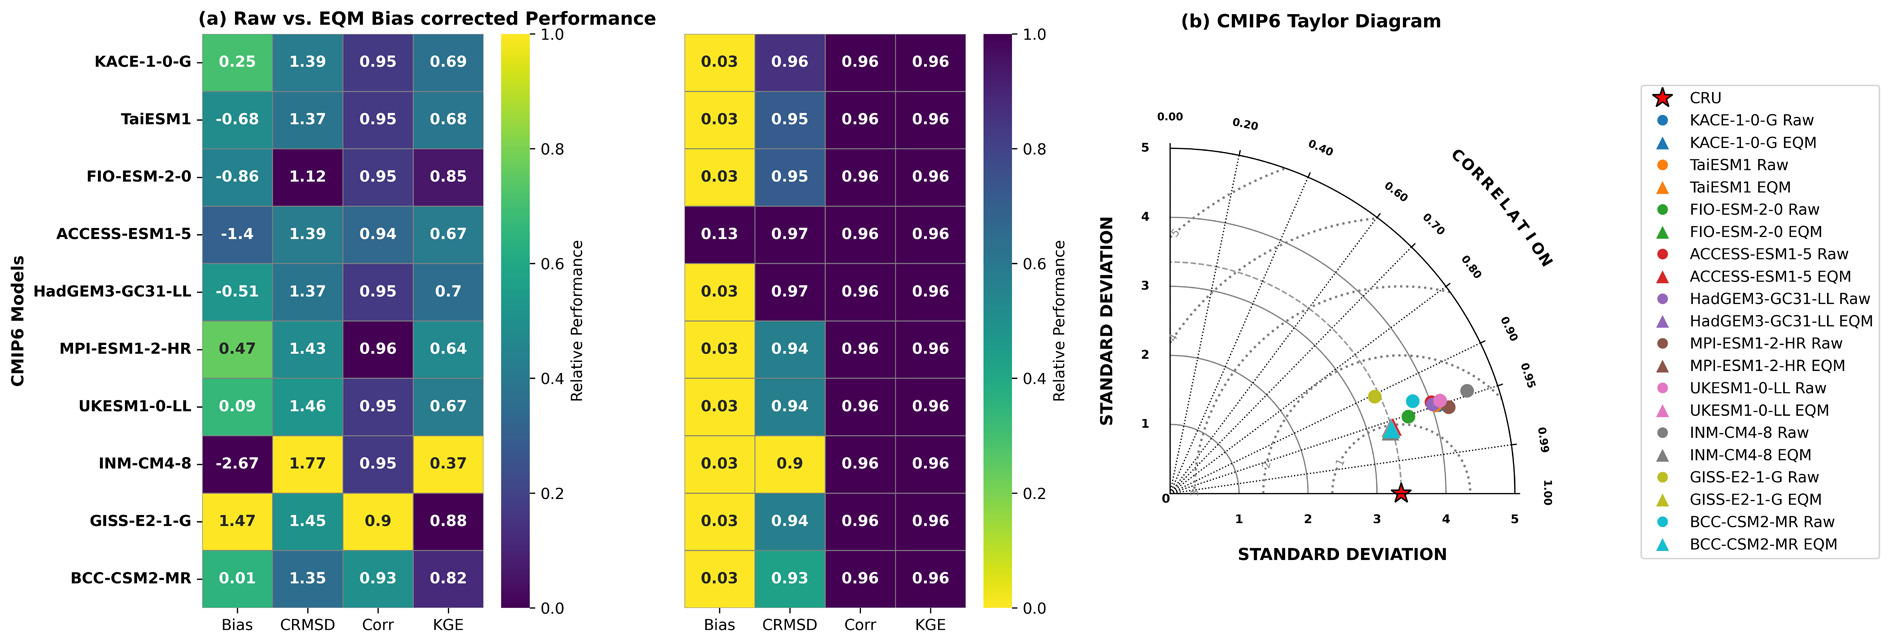
The largest improvement is observed in the Kling-Gupta Efficiency (KGE) metric, where raw models range widely (0.37-0.88), but all EQM-corrected models achieve consistently high values (0.96). As illustrated in Figure 3, corrected models cluster tightly around the observational benchmark, emphasizing the strength and consistency of the improvement. Overall, EQM provides a robust enhancement of model skill, yielding corrected datasets that are more reliable for historical assessment and future projections.
Figure 4 illustrates the spatial patterns of temperature biases in raw and ΔBias-corrected CMIP6 simulations over Sudan. In the raw simulations, annual temperatures are modestly underestimated relative to CRU observations (mean −0.59°C; SD = 0.87°C). Summer biases are predominantly positive (mean +0.45°C; SD = 0.76°C), while winter exhibits the strongest cold bias (mean −1.52°C; SD = 1.31°C).
Fig. 4.
Spatial patterns of raw and ΔBias-corrected temperature biases in CMIP6 simulations over Sudan for annual, summer, and winter seasons. ΔBias correction substantially reduces biases across all seasons. Cross-hatched areas indicate regions of model agreement of 66% or greater.
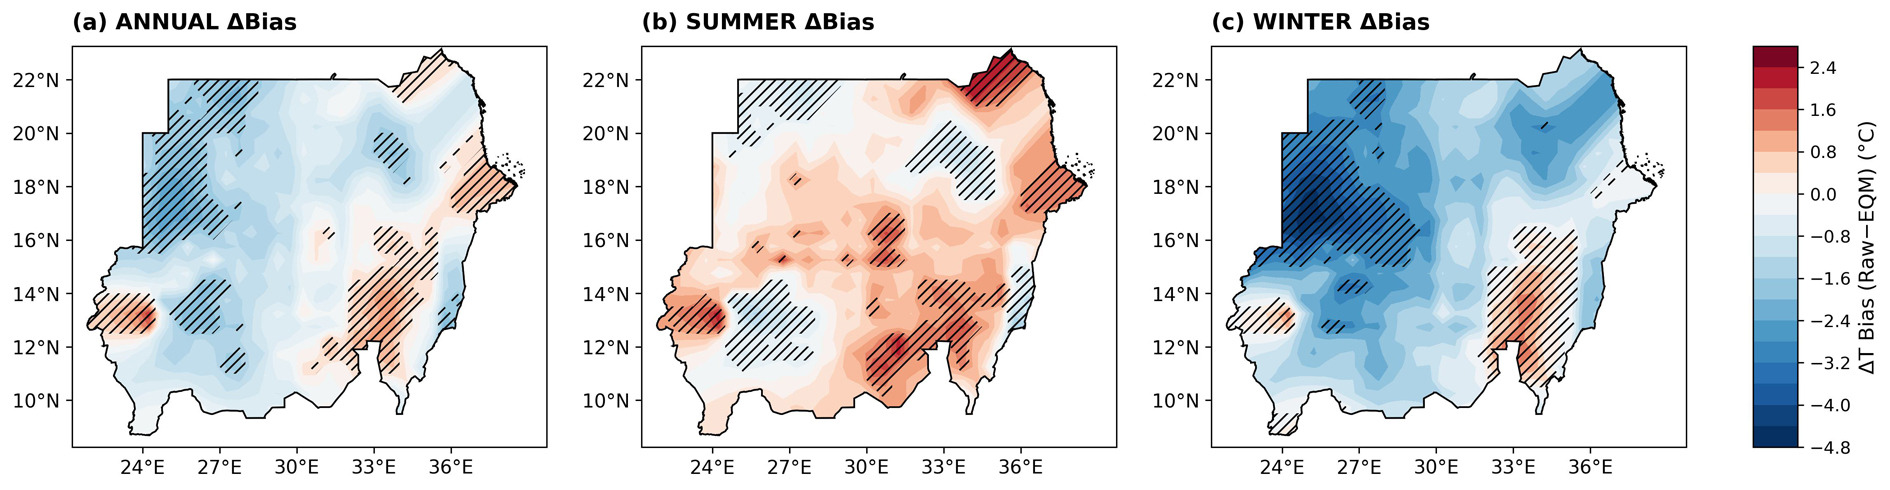
Following ΔBias correction, median biases are substantially reduced across all seasons (annual: −0.65°C; summer: +0.48°C; winter: −1.51°C), accompanied by narrower interquartile ranges (annual: 1.88°C; summer: 1.46°C; winter: 2.73°C), indicating improved agreement with observations. The fraction of grid cells with positive biases (annual: 25%; summer: 73%; winter: 12%) highlights pronounced seasonal asymme-tries, likely linked to regional climate processes, particularly the influence of the West African monsoon during summer.
Hatched areas denote residual extremes outside the central 66% range, identifying localized regions where bias correction remains less effective. Overall, ΔBias correction markedly reduces both the magnitude and spatial extent of temperature biases, with the greatest improvements observed for annual and summer, while winter retains some localized cold bias.
Figure 5 presents the ensemble mean changes in annual near-surface air temperature relative to the 1995-2014 baseline for mid-century (2041-2060) and late-century (2081-2100) under the SSP2-4.5 (moderate emissions) and SSP5-8.5 (high emissions) scenarios. Panels show (a) mid-century SSP2-4.5, (b) mid-century SSP5-8.5, (c) late-century SSP2-4.5, and (d) late-century SSP5-8.5.
Fig. 5.
Ensemble mean annual temperature anomalies relative to the 1995-2014 baseline for the mid- and late-century periods under SSP2-4.5 and SSP5-8.5. Cross-hatched areas indicate regions of model agreement of 66% or greater.
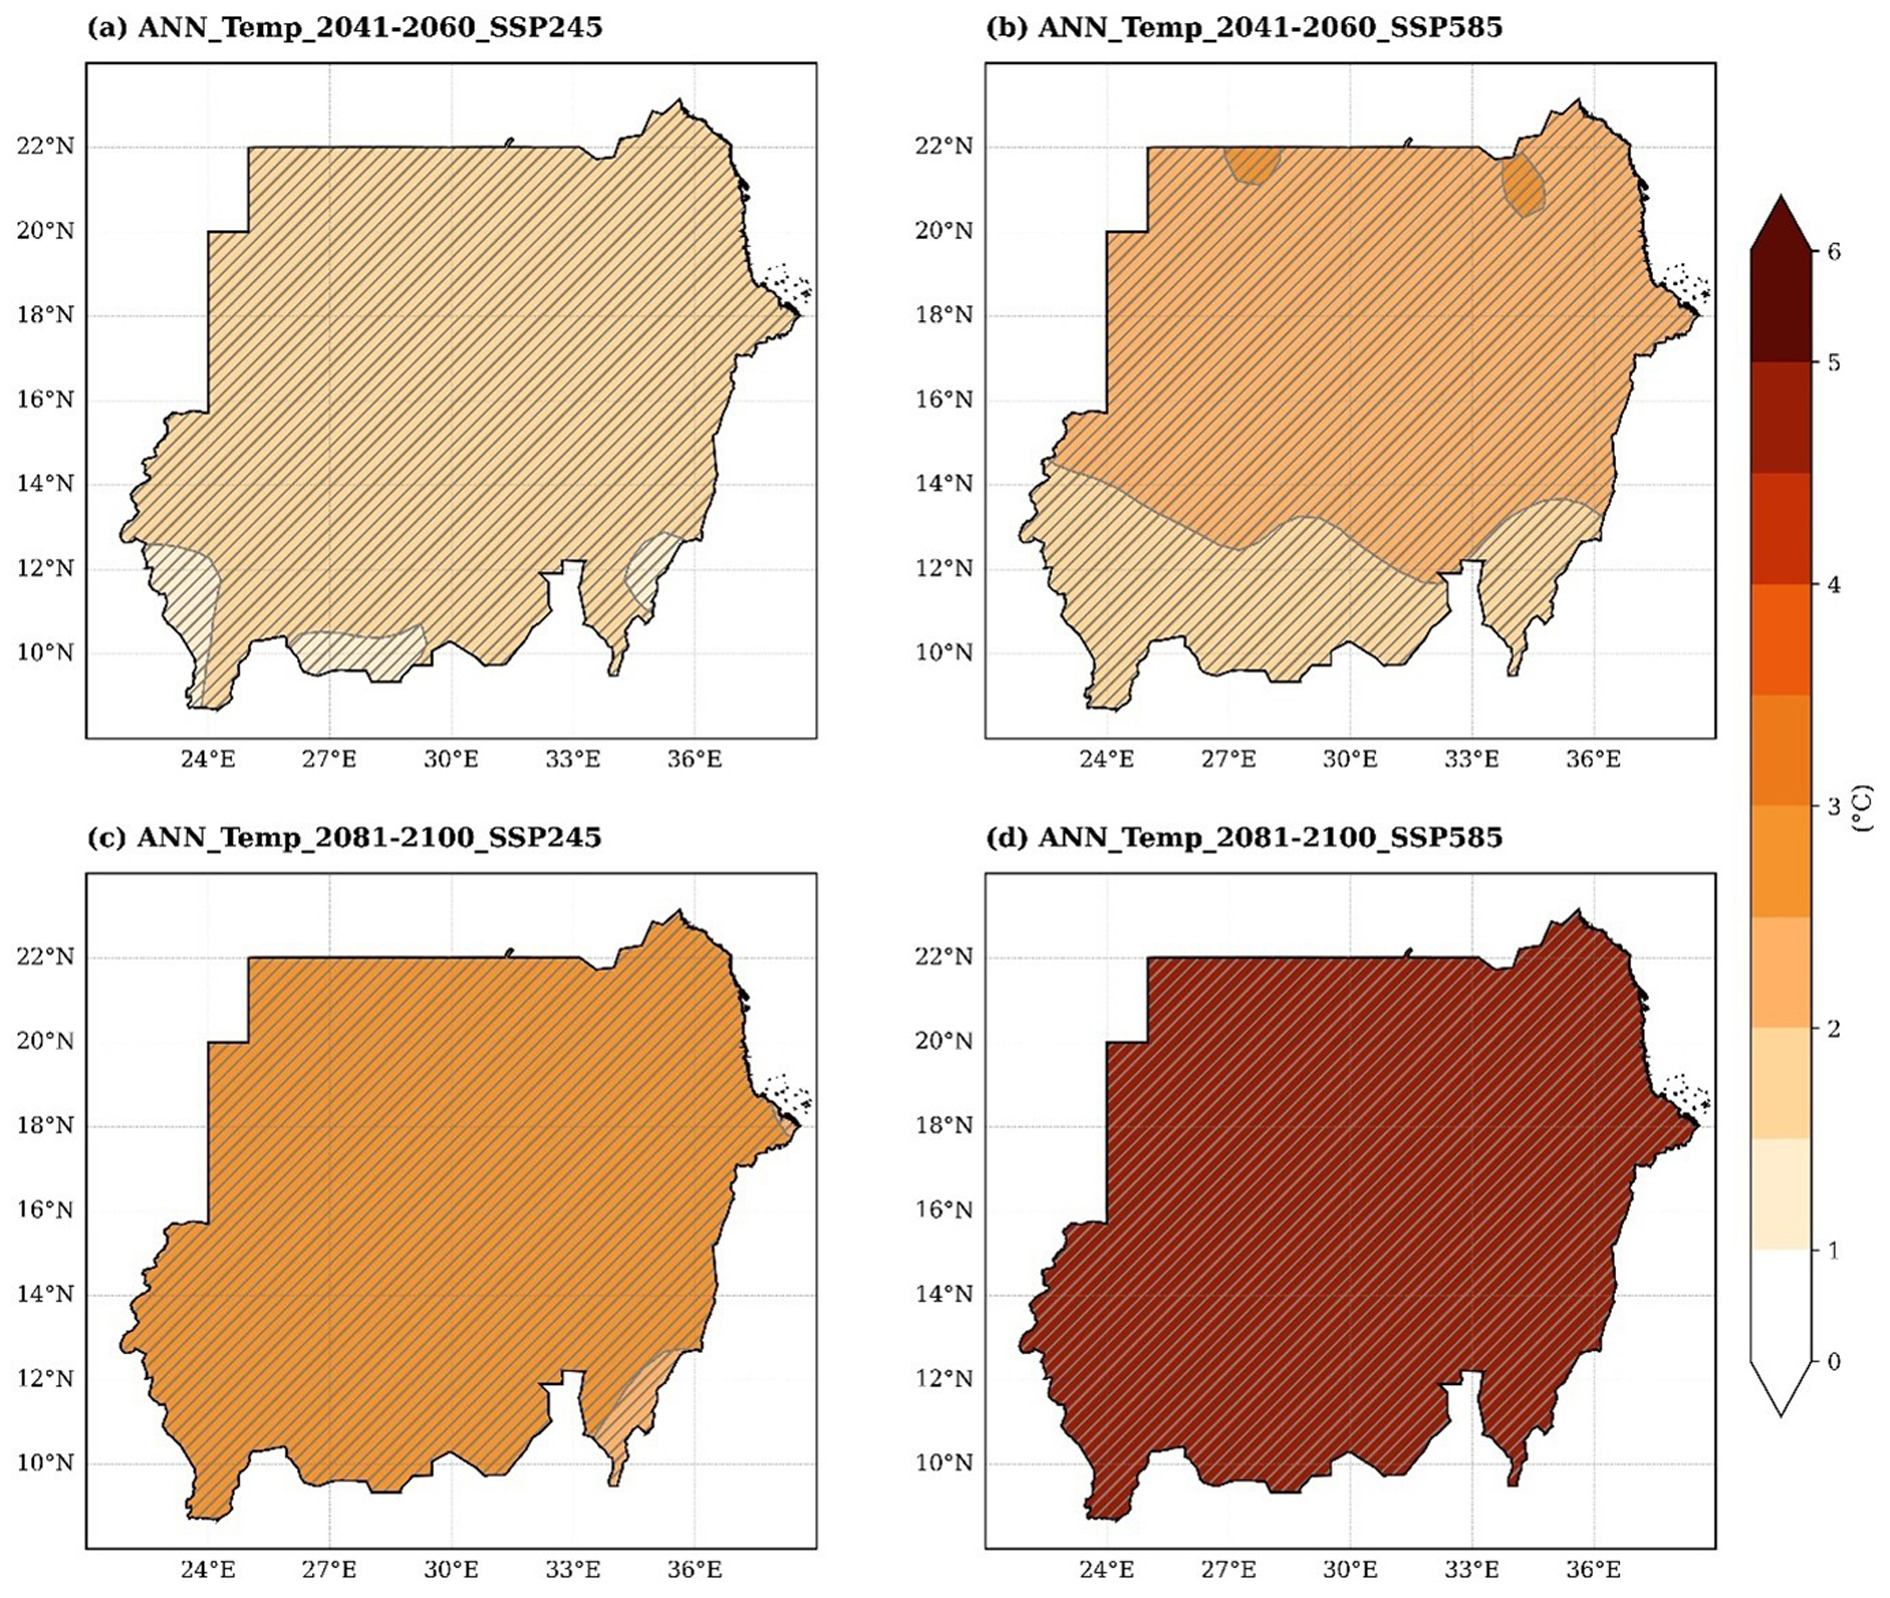
By mid-century, ensemble mean warming over Sudan is projected to reach 1.65°C under SSP2-4.5 and 2.16°C under SSP5-8.5, with corresponding 66% likely ranges of 1.12-1.97°C and 1.55-2.48°C, respectively. Warming intensifies substantially by late-century, increasing to 2.67°C (66% range: 1.89-3.30°C) under SSP2-4.5 and 5.00°C (66% range: 3.92-6.01°C) under SSP5-8.5. These results underscore the strong scenario dependence of future warming in Sudan, with high-emission pathways leading to markedly greater temperature increases. Hatched regions denote areas of robust warming where both statistical significance (p < 0.05) and strong inter-model agreement (≥66%) are satisfied. The 66% likely ranges quantify inter-model uncertainty, and the corresponding numerical statistics are summarized in Table 2.
Table 2.
Ensemble statistics of future annual and seasonal temperature anomalies (°C) over Sudan under SSP2-4.5 and SSP5-8.5 for mid- and late-century.
Figure 6 shows the ensemble time series of annual mean near-surface air temperature anomalies over Sudan for 2041-2100 under SSP2-4.5 and SSP5-8.5. Solid lines represent the ensemble mean, shaded envelopes indicate the 66% likely range, and dashed lines show the inter-model minimum and maximum. Under SSP2-4.5, anomalies increase gradually from 1.68°C in 2041-2060 to 2.68°C by 2081-2100, with the 66% likely range widening from 1.34-2.15°C to 2.02-3.52°C. The associated linear warming trend is 0.247°C decade-1. In contrast, SSP5-8.5 exhibits much stronger warming, rising from 2.18°C in 2041-2060 to 4.87°C by late-century, with the 66% likely range expanding from 1.84-2.67°C to 4.11-6.17°C, corresponding to a linear trend of 0.703°C decade-1.
Fig. 6.
Ensemble time series of annual mean near-surface air temperature anomalies over Sudan for 2041-2100 under SSP2-4.5 and SSP5-8.5. Solid lines represent the ensemble median, dashed lines indicate the ensemble mean, and shaded areas show the 66% likely range.
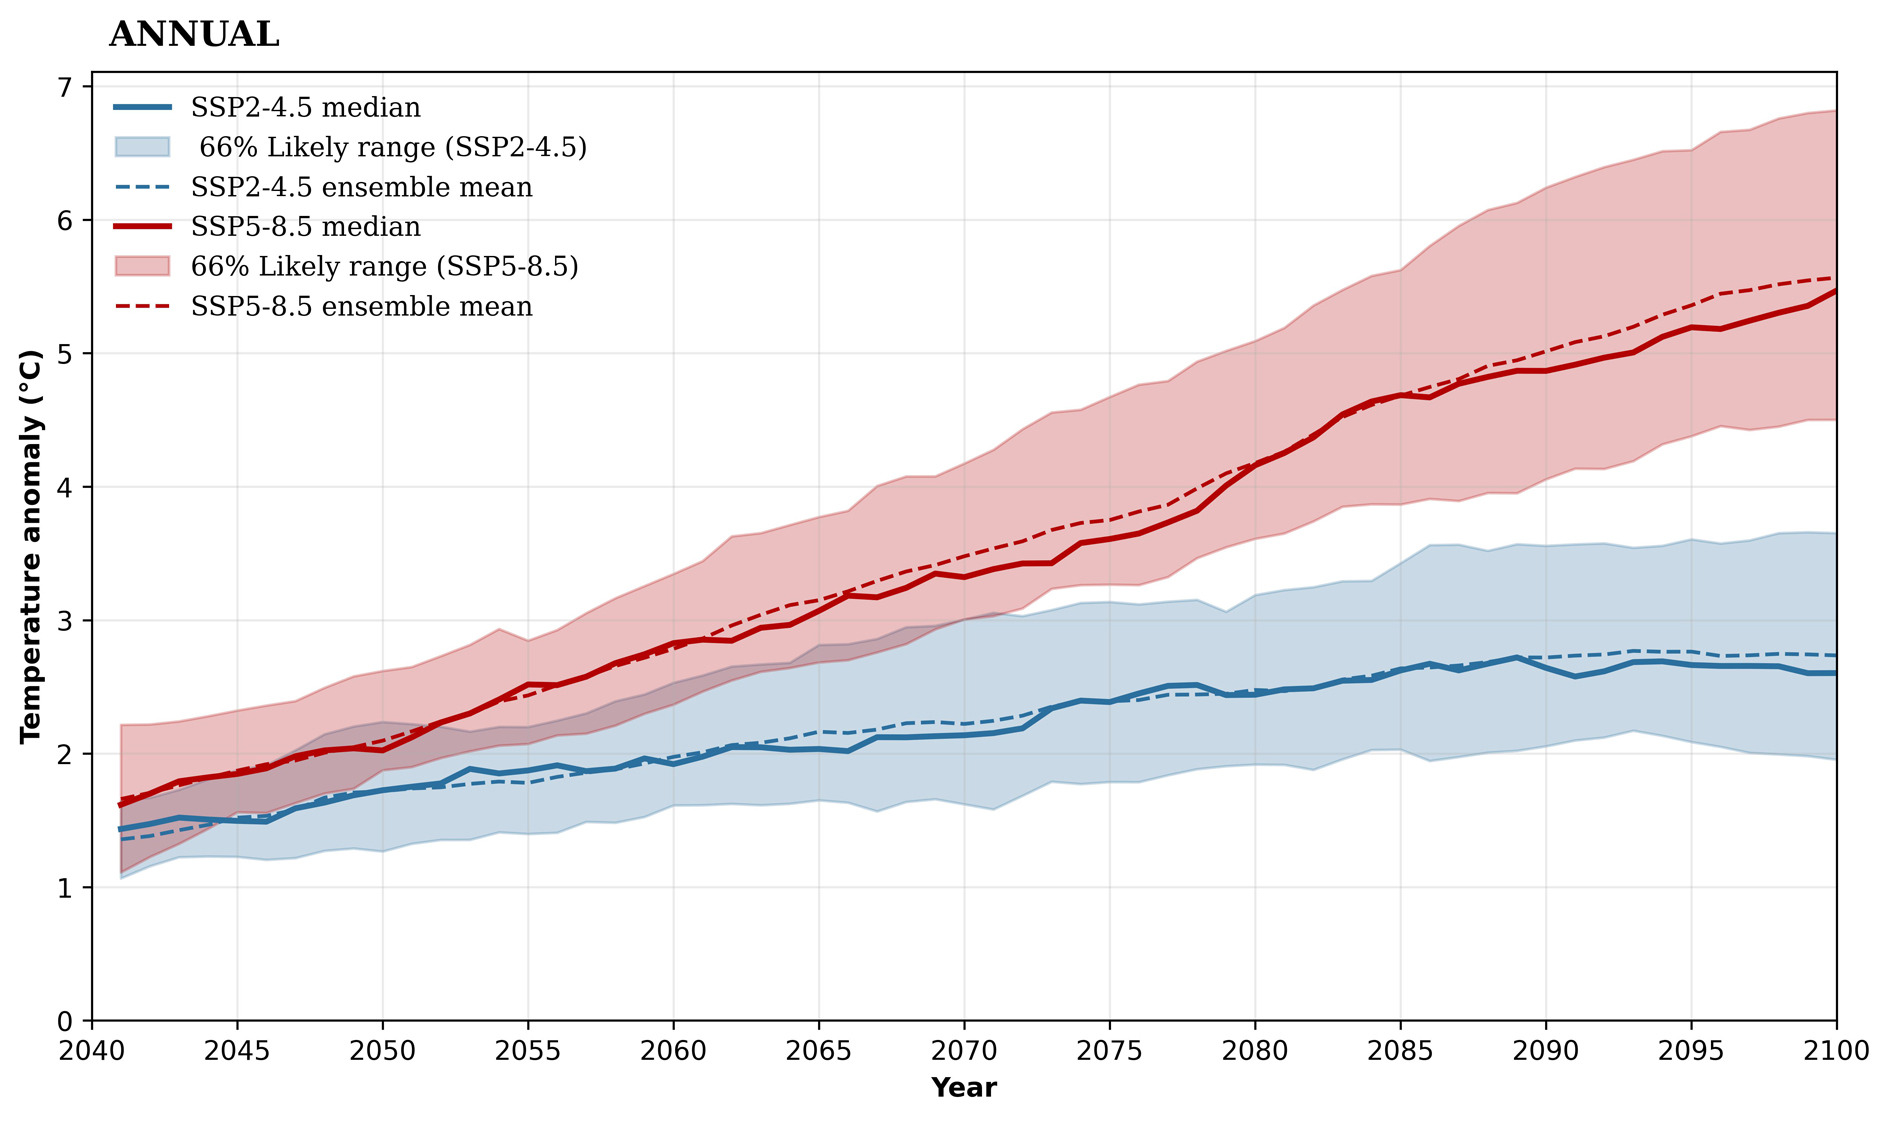
Overall, these projections are broadly consistent with IPCC AR6 Working Group I assessments, which report likely warming of approximately 1.5-2.5°C under SSP2-4.5 and 2.5-4.0°C under SSP5-8.5 for East Africa and the Sahel by mid-century (IPCC 2021). The slightly narrower uncertainty ranges in this study reflect the use of a bias-corrected subset of CMIP6 models focused specifically on Sudan. Nevertheless, the magnitude, spatial distribution, and temporal evolution of projected warming closely align with the broader multi-model patterns reported by the IPCC.
4.4. Future seasonal warming
Summer projections are shown in Figure 7, which presents the ensemble mean changes in near-surface air temperature relative to the 1995-2014 baseline for the mid-century (2041-2060) and late-century (2081-2100) periods under the SSP2-4.5 and SSP5-8.5 scenarios. Panels (a-d) correspond to mid- and late-century projections for both emissions pathways.
Fig. 7.
Ensemble mean summer near-surface air temperature anomalies relative to the 1995-2014 baseline for the mid-century and late-century periods under SSP2-4.5 and SSP5-8.5. Cross-hatched areas indicate regions of model agreement of 66% or greater.
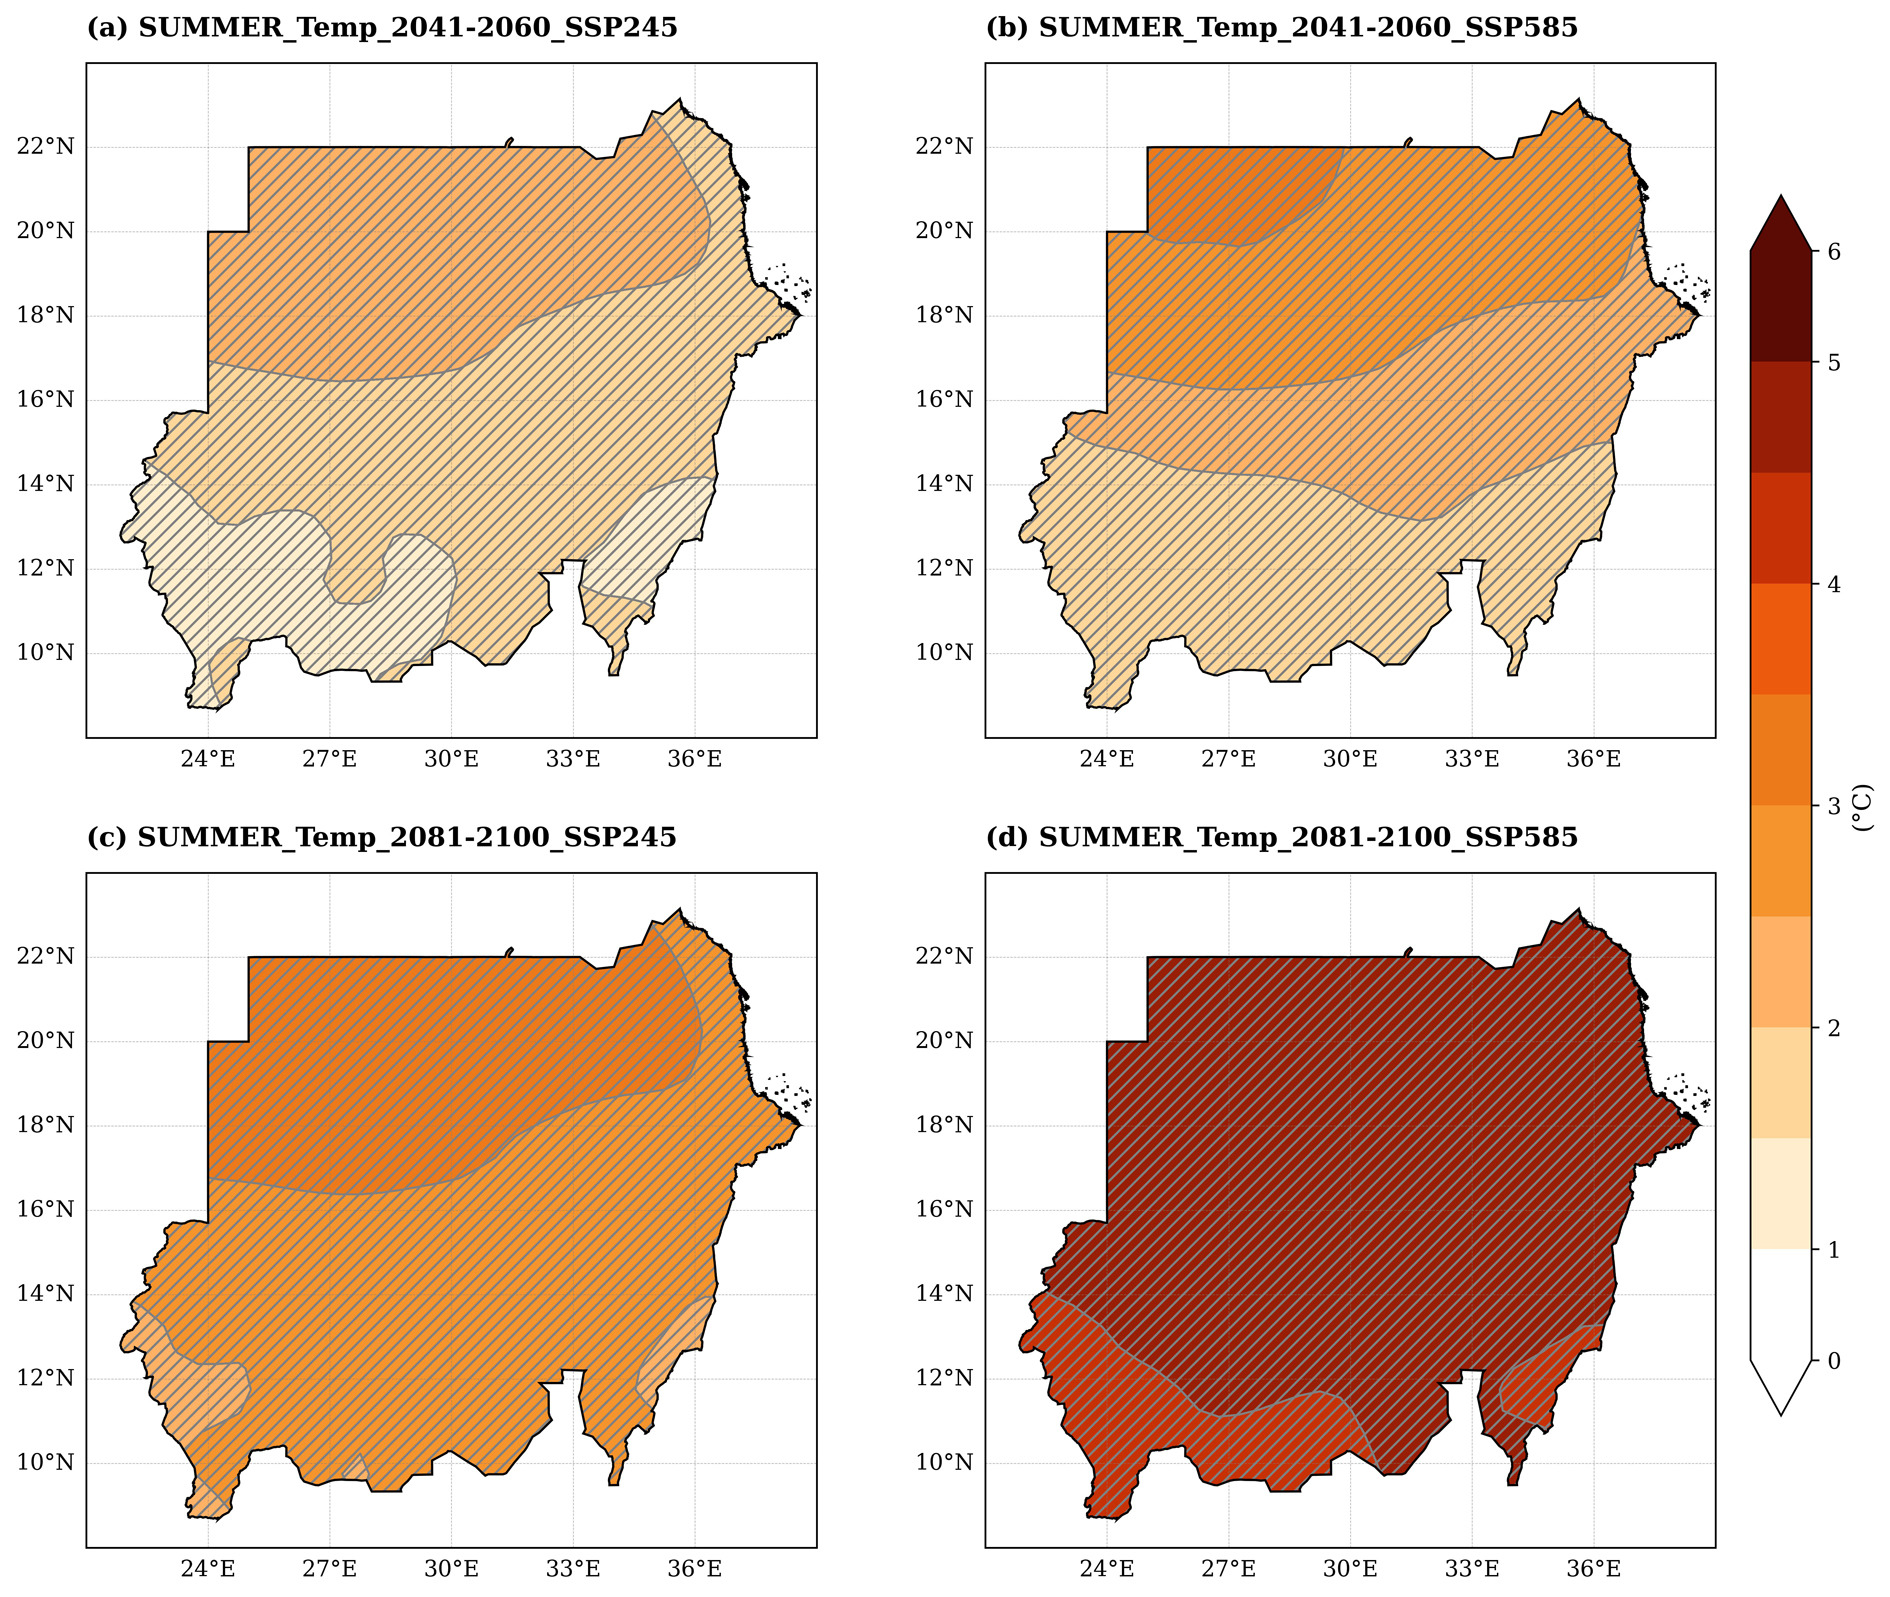
During the mid-century period, ensemble mean summer warming is projected to reach 1.78°C under SSP2-4.5 and 2.30°C under SSP5-8.5, with 66% likely ranges of 1.49-2.18°C and 1.88-2.90°C, respectively. By late-century, warming intensifies further, increasing to 2.80°C (66% range: 2.53-3.21°C) under SSP2-4.5 and 4.79°C (66% range: 4.47-5.00°C) under SSP5-8.5.
Hatched regions indicate areas of robust warming where both statistical significance (p < 0.05) and strong inter-model agreement (≥66%) are satisfied. These results demonstrate that future summer warming in Sudan is strongly scenario dependent, with higher emissions leading to substantially greater temperature increases. The detailed numerical statistics for these projections are summarized in Table 2.
Winter projections are presented in Figure 8, with panels (a-d) corresponding to mid- and late-century projections under the SSP2-4.5 and SSP5-8.5 scenarios. During the mid-century period, ensemble mean winter warming is projected to reach 1.58°C under SSP2-4.5 and 1.98°C under SSP5-8.5, with 66% likely ranges of 1.51-1.64°C and 1.89-2.07°C, respectively. By late-century, winter warming intensifies to 2.57°C (66% range: 2.51-2.63°C) under SSP2-4.5 and 4.90°C (66% range: 4.75-5.00°C) under SSP5-8.5.
Fig. 8.
Ensemble mean winter near-surface air temperature anomalies relative to the 1995-2014 baseline for the mid-century and late-century periods under SSP2-4.5 and SSP5-8.5. Cross-hatched areas indicate regions of model agreement of 66% or greater.
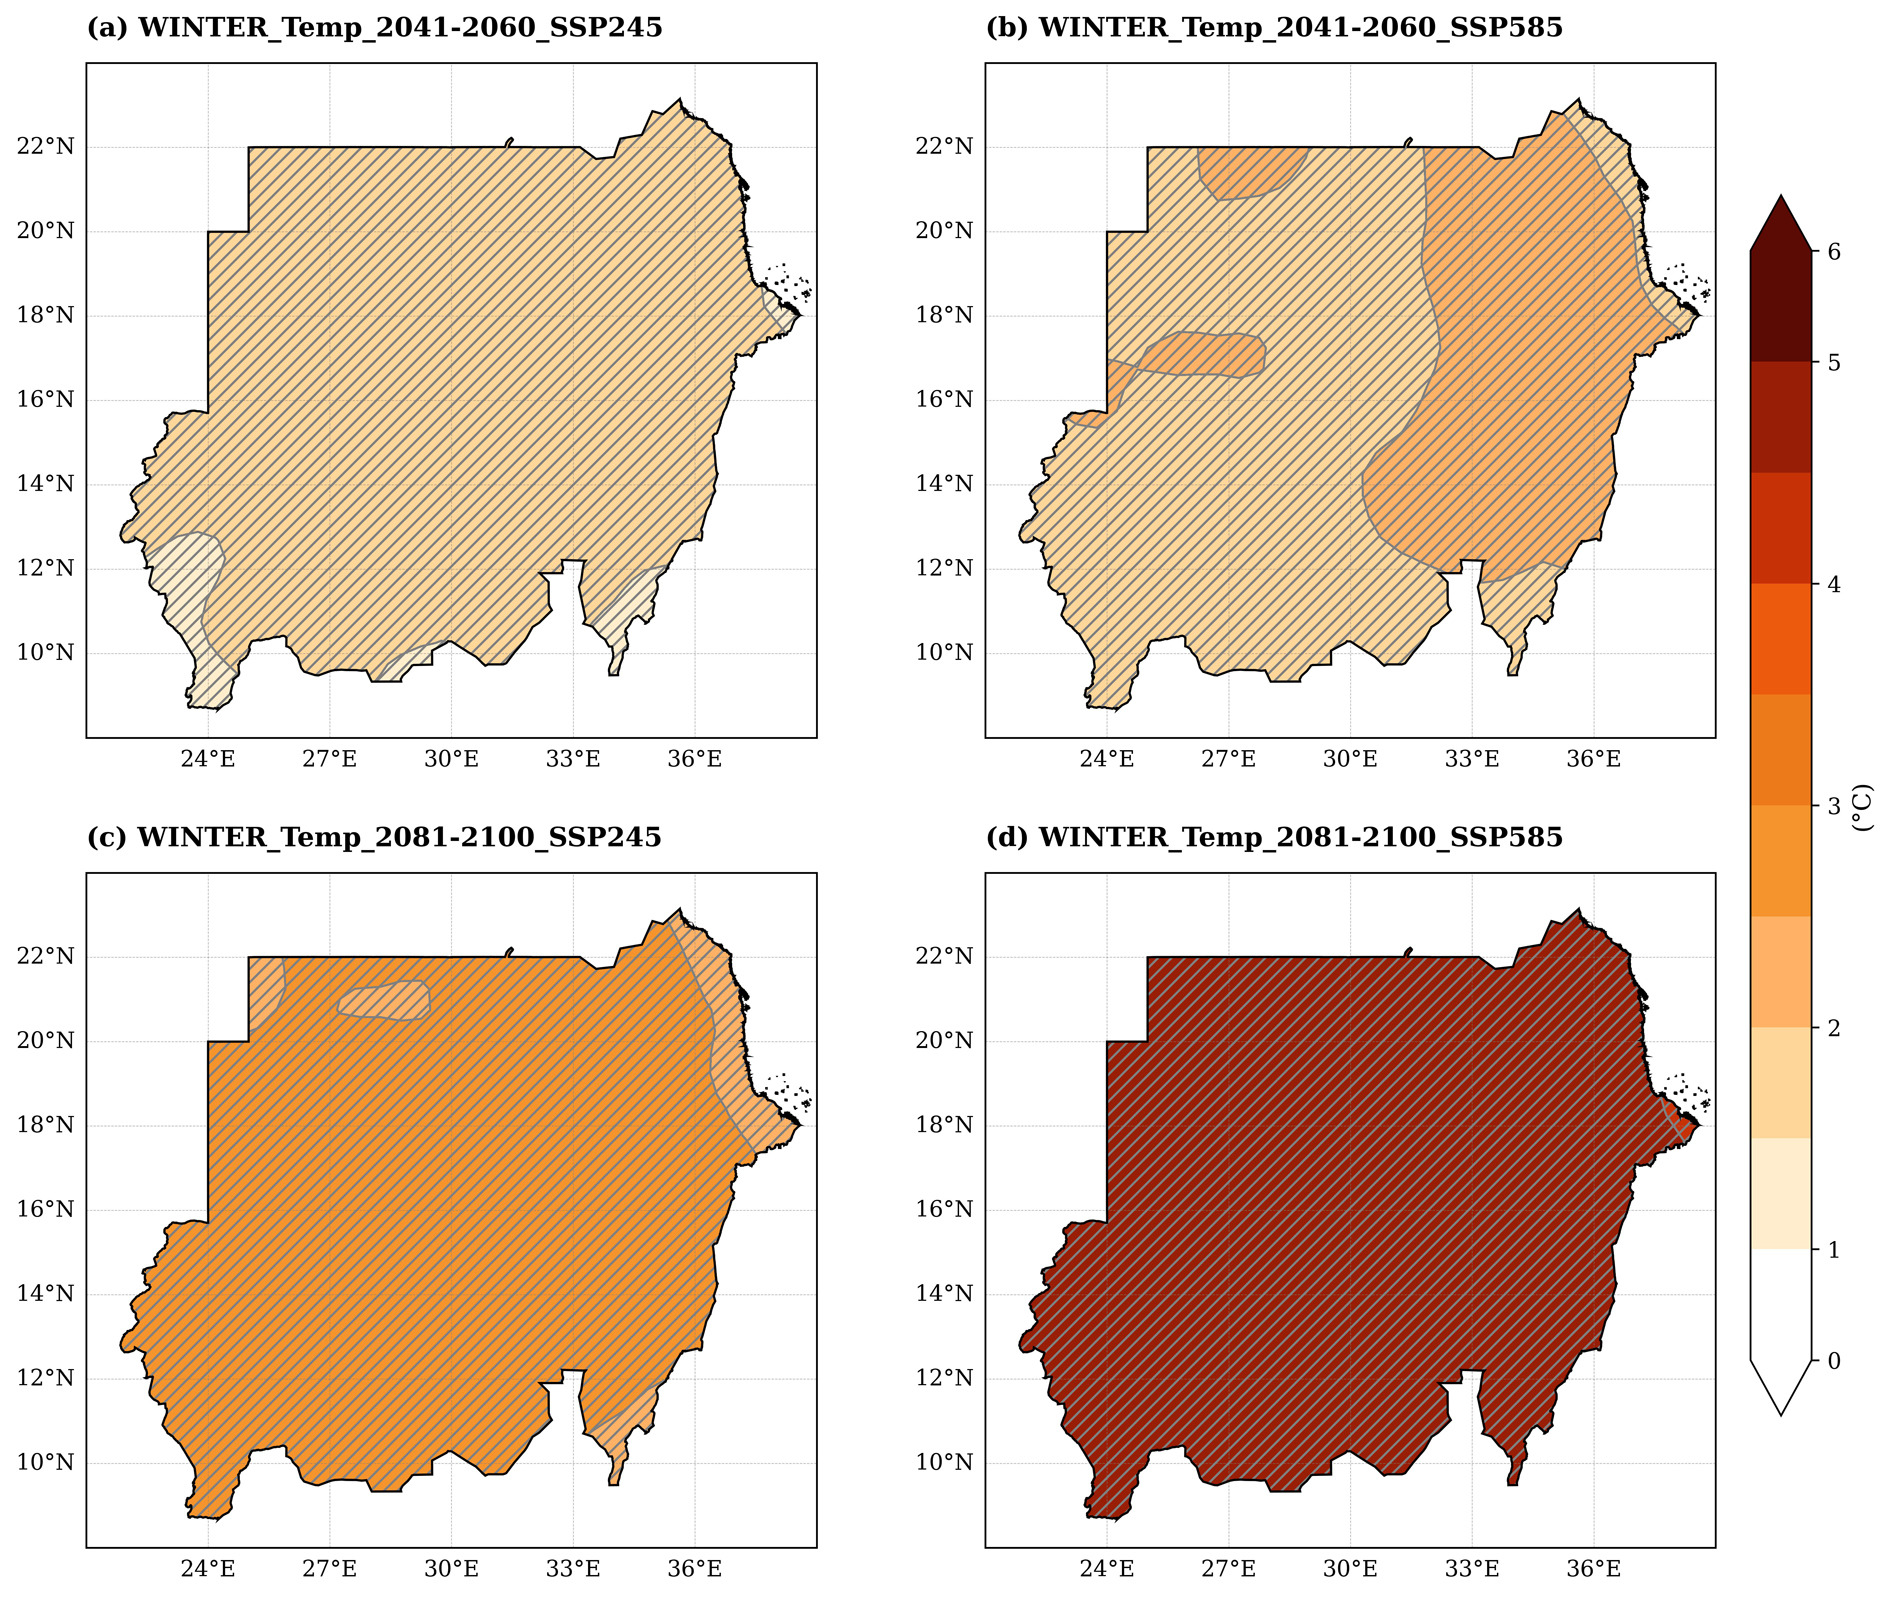
Compared to summer, winter warming exhibits greater temporal stability and narrower uncertainty intervals, reflecting reduced inter-model spread. Hatched regions denote areas of robust warming, defined by both statistical significance (p < 0.05) and strong inter-model agreement (≥66%), consistent with the criteria applied to annual and summer projections.
Overall, these results indicate that while both seasons experience substantial warming, the magnitude and variability are consistently higher during the summer months. Corresponding winter statistics are summarized in Table 2.
Figure 9 illustrates the seasonal evolution of near-surface air temperature anomalies over Sudan from 2041 to 2100. Panel (a) presents summer anomalies, which display a pronounced upward trajectory. Under SSP5-8.5, the 66 % likely ranges progressively widen, indicating accelerated warming and increased inter-model divergence during the monsoon season. Panel (b) shows winter anomalies, which also increase over time but follow a more stable trend with narrower uncertainty intervals, consistent with the reduced model spread identified in the statistical analysis.
Fig. 9.
Ensemble time series of seasonal near-surface air temperature anomalies over Sudan for 2041-2100 under SSP2-4.5 and SSP5-8.5. (a) summer anomalies, (b) winter anomalies. Solid lines represent the ensemble median, dashed lines indicate the ensemble mean, and shaded areas show the 66% likely range.
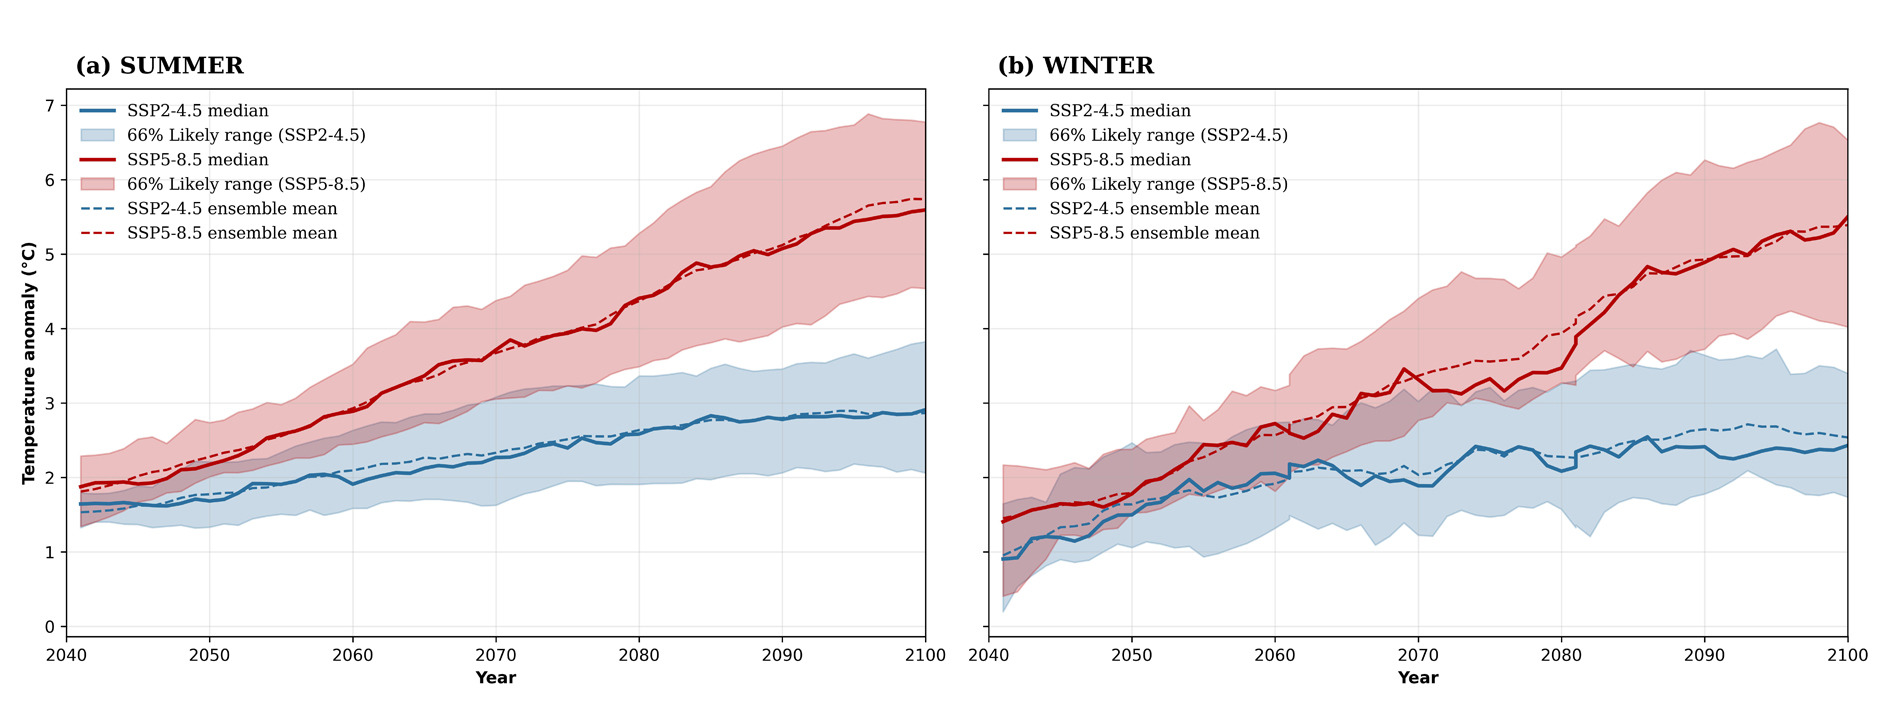
Seasonal warming rates over 2041-2100 are estimated at approximately 0.265°C per decade (summer) and 0.243°C per decade (winter) under SSP2-4.5, and 0.742°C per decade (summer) and 0.718°C per decade (winter) under SSP5-8.5. These projections indicate that Sudan will continue to experience sustained warming throughout the 21st century in both seasons, with summer warming occurring at a faster rate and exhibiting greater variability than winter warming.
Overall, the results align closely with regional projections reported in the IPCC AR6, underscoring strong scenario-dependent warming across northern and north-eastern Africa.
4.5. Scenario divergence
The temperature differences between the moderate- and high-emission pathways exhibit a clear, increasingly pronounced divergence from mid-century to late-century (Fig. 10a-c). During the mid-century period (2041-2060), the separation between scenarios is already detectable, with consistently positive warming differences across all seasons. Annual differences remain modest yet robust, with a mean increase of 0.49°C and a narrow 66% likely range of 0.38-0.58°C, indicating strong inter-model agreement. Seasonal patterns follow a similar structure: winter differences average 0.41°C, while summer shows a larger response of 0.53°C, reflecting enhanced land-atmosphere coupling during hotter months. The tight uncertainty ranges across all mid-century estimates underscore the stability and consistency of the modeled scenario divergence.
Fig. 10.
Projected temperature differences (SSP5-8.5 minus SSP2-4.5) over Sudan. Panels a-c show mid-century (2041-2060) annual, winter, and summer differences; panels d-f show late-century (2081-2100) differences. Color shading indicates mean differences, and cross-hatched areas indicate regions of model agreement of 66% or greater.
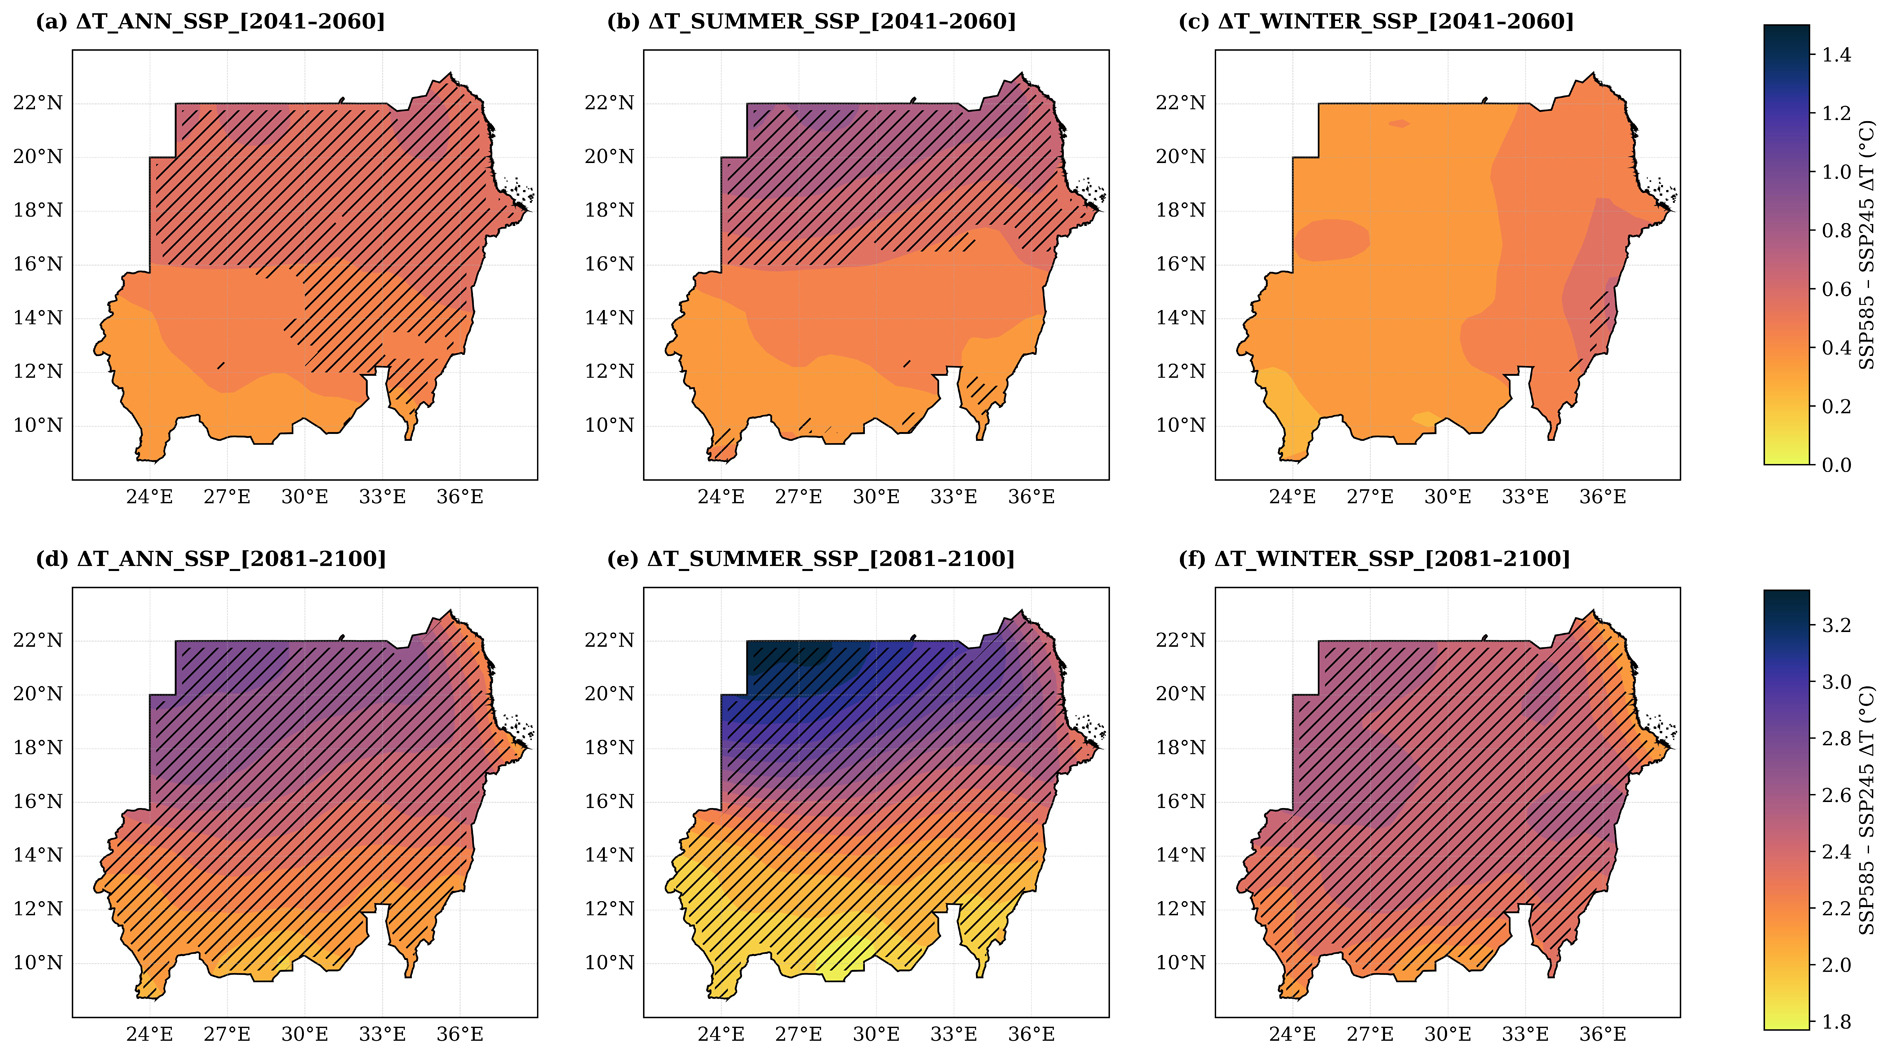
By the late-century period (2081-2100), the contrast between emissions pathways intensifies substantially (Fig. 10d-f). Annual differences increase to a mean of 2.36°C, with a constrained 66% likely range of 2.13-2.63°C, highlighting the dominant influence of cumulative greenhouse-gas emissions on long-term warming. Seasonal differences reach comparable magnitudes, with winter and summer increases of 2.37°C and 2.39°C, respectively. Although inter-model spread widens slightly, particularly during summer due to amplified radiative forcing and surface feedbacks, warming remains consistently higher under the high-emission scenario across all models.
Overall, these results demonstrate that while mid-century scenario separation is moderate and tightly bounded, late-century divergence becomes pronounced and climatically significant. The persistence of
positive differences, combined with narrow mid-century uncertainty and coherent late-century ranges, provides high confidence that Sudan’s future thermal conditions, particularly summer heat stress, will be strongly governed by the global emissions trajectory.
5. Discussion and conclusions
This study provides a detailed assessment of projected annual and seasonal temperature changes over Sudan for the mid-century (2041-2060) and late-century (2081-100) periods under the SSP2-4.5 and SSP5-8.5 scenarios, using bias-corrected CMIP6 multi-model ensembles. The results indicate a robust and consistent warming signal across all seasons, with a strong dependence on future emissions pathways.
For annual mean temperature, the mid-century ensemble median warming is projected to reach 1.65°C under SSP2-4.5 (66% likely range: 1.12-1.97°C) and 2.16°C under SSP5-8.5 (66% likely range: 1.55-2.48°C). By late-century, annual warming intensifies substantially to 2.67°C (66% range: 1.89-3.30°C) under SSP2-4.5 and 5.00°C (66% range: 3.92-6.01°C) under SSP5-8.5 (Table 2) (IPCC 2021; World Bank 2023). The corresponding linear warming trends of 0.247°C per decade and 0.703°C per decade, respectively, illustrate the accelerated temperature increase associated with high-emission pathways (Fig. 6).
Summer exhibits the fastest and most variable warming. Mid-century median summer anomalies are projected at 1.68°C under SSP2-4.5 (66% range: 1.49-2.18°C) and 2.16°C under SSP5-8.5 (66% range: 1.88-2.90°C). By late-century, summer warming reaches 2.69°C (66% range: 2.53-3.21-°C) under SSP2-4.5 and 5.00°C (66% range: 4.47-5.00°C) under SSP5-8.5 (Table 2; Fig. 7). Corresponding warming rates of approximately 0.265°C per decade and 0.742°C per decade reflect strong land–atmosphere feedback during the hottest months.
Winter warming is comparatively more stable. Mid-century median anomalies reach 1.60°C (66% range: 1.51-1.64°C) under SSP2-4.5 and 1.98°C (66% range: 1.89-2.07°C) under SSP5-8.5. By late-century, winter warming increases to 2.56°C (66% range: 2.51-2.63°C) and 5.00°C (66% range: 4.75-5.00°C), respectively, with linear trends of 0.243°C per decade and 0.718°C per decade (Table 2; Fig. 8). Compared to summer, winter projections exhibit narrower uncertainty ranges, indicating reduced inter-model spread and greater seasonal stability.
Spatially, northern and central Sudan are projected to experience stronger warming than southern regions, consistent with heterogeneous climate regimes, land–atmosphere interactions, and topographic influences. The 66% likely ranges provide a quantitative measure of inter-model uncertainty, indicating robust warming signals across most regions. These findings are consistent with regional assessments for East Africa and the Sahel reported in IPCC AR6 WGI (IPCC 2021) and complement recent analyses of climate-related peace and security risks in Sudan (NUPI, SIPRI 2022).
Scenario divergence is already evident by mid-century. Annual temperature differences between SSP5-8.5 and SSP2-4.5 average 0.49°C (66% likely range: 0.38-0.58°C), with summer differences of 0.53°C (66%
range: 0.30-0.84°C) and winter differences of 0.40°C (66% range: 0.24-0.63°C). By late-century, these contrasts become climatically significant, with annual differences of 2.37°C (66% range: 1.91-2.83°C), summer divergences reaching 2.40°C (66% range: 1.77-3.32°C), and winter divergences of 2.39°C (66% range: 2.01-2.63°C) (Fig. 10). This confirms that cumulative greenhouse-gas emissions will strongly govern future thermal conditions, particularly extreme summer heat stress (IPCC 2021; NUPI, SIPRI 2022; WBG 2023).
Bias correction using Equidistant Quantile Mapping (EQM) and Delta Quantile Mapping (DQM) substantially reduces systematic model errors, improves Kling-Gupta Efficiency (KGE'), and constrains inter-model spread, thereby enhancing confidence in the projections. Nevertheless, several limitations remain. CMIP6 models’ coarse spatial resolution (~100-200 km) may underestimate local warming hotspots; EQM assumes stationary bias structures that may not fully hold under future climate conditions; and sparse observational coverage in northern Sudan introduces uncertainty into the reference climatology (IPCC 2021).
The projected warming has significant socioeconomic implications. Enhanced summer temperatures are likely to exacerbate heat stress, reduce agricultural productivity, intensify water scarcity, and challenge hydropower generation. Northern and central Sudan appear particularly vulnerable to compounded heat-wave and drought risks. These findings underscore the urgent need for targeted adaptation strategies, including climate-resilient crops, improved water-resource management, and strengthened early-warning systems, consistent with broader climate risk and security assessments (NUPI, SIPRI 2022; WBG 2023).
In conclusion, Sudan is projected to experience substantial annual and seasonal warming throughout 2041-2100, with summer exhibiting the fastest and most variable increases. The growing divergence between moderate- and high-emission pathways highlights the critical importance of global mitigation efforts, while strong multi-model agreement provides robust guidance for national adaptation planning. Bias-corrected CMIP6 ensembles offer actionable insights for policymakers and stakeholders, supporting evidence-based climate risk assessments and long-term adaptation strategies (IPCC 2021; NUPI, SIPRI 2022; WBG 2023).