1. Introduction
Egypt faces significant challenges due to limited water resources, necessitating efficient use of both natural and non-conventional water sources (Gado et al. 2023). Effective management of floodwaters requires constructing hydraulic structures such as dams, reservoirs, channels, and culverts. Additionally, meteorological data is necessary to anticipate and mitigate flood-related risks. Precise knowledge of extreme rainfall events, including their magnitude and duration, is essential for ensuring the safety of lives, property, and infrastructure (Parvez et al. 2019; Kawara, Elsebaie 2022). Consequently, accurate estimates of maximum runoff are essential for planning and constructing such hydraulic systems (Das et al. 2022). However, the availability of reliable rainfall data in Egypt is hindered by several challenges, including missing data, short record lengths, and inconsistent spatial distribution of rainfall stations. These limitations underscore the importance of developing robust methodologies to estimate rainfall intensities and durations accurately.
In recent years, Egypt has undertaken numerous infrastructure development projects, such as roadways, monorails, railways, bridges, and urban drainage systems in new cities. Before initiating such activities, comprehensive meteorological and hydrological investigations were required to design flood protection systems (Division of Hydrometeorology 2007). Rainfall patterns, including their frequency, intensity, and spatial distribution, are increasingly influenced by climate change, which has been identified as a major factor in the increased frequency of heavy rainfall events and shifting patterns (Das et al. 2022). Notably, Egypt has already experienced increased frequency of extreme rainfall events and altered seasonal distributions (Nashwan et al. 2019; Roushdi 2022), highlighting the urgent need for updated methodologies to address evolving climatic conditions. Specifically, observed changes in Egypt’s rainfall patterns include increased extreme rainfall events and altered seasonal distributions, which have significant implications for water resource management and infrastructure planning. These changes highlight the urgent need for updated methodologies to address evolving climatic conditions (Nashwahan et al. 2019; Roushdi 2022).
In arid and semi-arid areas, significant changes in the properties of rainfall from one time to another can be noted. Therefore, understanding the dynamics of rainfall processes, including total rainfall, intensity over specific periods, and year-to-year variability, is essential. Reliable estimates of rainfall depths require comprehensive analyses of long-term historical rainfall data (Parvez et al. 2019). The availability of extensive rainfall records is crucial for conducting frequency analyses to derive accurate rainfall depth estimates (Al-Amri, Subyani 2017; Matos 2018). In Egypt, obtaining long-term, continuous rainfall records can be challenging because of issues such as the limited number of long-operating stations and gaps in existing datasets. These challenges are particularly pronounced for short-duration rainfall data, which is critical for designing hydraulic structures and urban drainage systems. The scarcity of recording rain gauges capable of capturing high-resolution temporal rainfall information, especially in remote or ungauged areas, exacerbates this issue. Additionally, inconsistencies in data collection practices, such as variations in measurement techniques and equipment, further contribute to the limitations of historical rainfall data.
Intensity–duration–frequency (IDF) curves and isopluvial maps are widely used in meteorology, hydrology, and water resource engineering for design, planning, operation, and management purposes (Subyani, Al-Amri 2015; Şen 2019). For example, IDF curves have already been developed for the Sinai Peninsula, a distinct climatic region in Egypt (El-Sayed 2011; Fathy et al. 2014). However, these Sinai-specific curves may not accurately represent rainfall characteristics across the diverse climatic zones of the entire country. The development of new IDF curves for Egypt is not only justified but necessary to address the limitations of outdated data, insufficient spatial and temporal resolution, and the impacts of climate change. These updated curves provide a valuable resource for modern infrastructure planning and water resource management, ensuring that designs are both safe and sustainable in the face of evolving climatic challenges.
The scarcity of short-duration rainfall data in many parts of Egypt exacerbates the challenge of accurately estimating rainfall intensities for critical infrastructure design. This scarcity is often attributed to the limited number of recording rain gauges capable of capturing high-resolution temporal rainfall information. Using reliable rainfall data is strongly recommended for the effective and secure design of flood protection projects (Ewea et al. 2017). Furthermore, analyzing trends and variability in annual maximum daily rainfall series and understanding their impacts on total rainfall are critical areas of study (Ghenim, Megnounif 2016).
Since climate change has gained international attention from scientists, the intense study of rainfall frequency relationships, including the creation of isopluvial maps, has become an important tool for understanding broader climatic trends (Bonnin et al. 2011; The Rainfall Atlas of Hawai’i 2011; Schroeder 2013).
The objective of this study is to develop an empirical formula and a comprehensive atlas of isopluvial maps for Egypt, using statistical methodologies and GIS tools. Specifically, the study aims to:
Estimate short-duration rainfall depths based on daily rainfall records.
Generate isopluvial maps for various durations and return periods.
Investigate the potential influence of climate change on the derived rainfall estimates and their implications for future infrastructure design.
The expected contributions include providing engineers and policymakers with reliable tools for designing hydraulic structures, urban drainage systems, and flood protection measures. These outputs will enhance the accuracy of rainfall predictions and support adaptive planning in response to evolving climatic conditions. The findings of this study are expected to offer significant benefits to engineers, policymakers, and other stakeholders involved in water resource management and infrastructure planning. By providing accurate rainfall estimates for specific durations and return periods, the study supports the design of resilient hydraulic structures, urban drainage systems, and flood mitigation strategies (Rana et al. 2023). Additionally, the isopluvial maps serve as a valuable resource for identifying high-risk areas and optimizing resource allocation for infrastructure projects (Carvalho et al. 2022). This study offers a novel, nationwide assessment of short-duration rainfall depths and isopluvial mapping for Egypt, building upon existing regional studies such as the IDF curves developed for the Sinai Peninsula. Unlike previous studies that focused on specific regions, this research provides a comprehensive framework applicable to Egypt’s diverse climatic zones, incorporating updated methodologies and considerations for climate change impacts.
2. Data and methods
2.1. Study area
Egypt spans diverse climate zones that exhibit significant variability in rainfall patterns, both temporally and spatially. A recent high-resolution climatic classification study identified distinct zones using image clustering techniques applied to meteorological data. These climatic zones reflect differences in rainfall magnitude, frequency, and seasonal variability across the country (Hamed et al. 2022).
Mediterranean Coastal Zone: This region experiences relatively higher rainfall compared to the rest of Egypt, with precipitation concentrated during the winter months from the influence of Mediterranean cyclones.
Nile Valley and Delta Zone: Characterized by moderate rainfall, this zone benefits from proximity to the Nile River and exhibits more uniform rainfall distribution compared to desert regions.
Western Desert Zone: This arid region receives minimal rainfall, with sporadic and highly variable precipitation events driven by rare convective storms.
Eastern Desert and Red Sea Coast Zone: This zone experiences localized but intense rainfall events, often associated with tropical systems or Red Sea troughs.
Sinai Highlands Zone: Includes mountainous parts of the Sinai Peninsula that occasionally receive convective or orographic rainfall, mostly in spring and autumn.
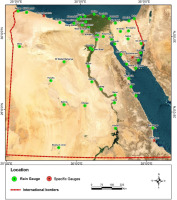
Understanding these climatic differences is critical for effective water resource management and infrastructure planning. This study focuses on rainfall data collected from 54 meteorological stations distributed across Egypt, ensuring comprehensive coverage of the country’s varied climatic conditions. The locations of these stations are shown in Figure 1, highlighting their strategic placement within each climatic zone to capture regional rainfall variability.
2.2. Data collection
Egypt is monitored by an extensive network of rainfall recording stations with more than 100 stations nationwide., Daily rainfall data from 54 meteorological stations were used in this study, with observation periods ranging from 19 to 118 years. These 54 stations were chosen because they provide a representative sample of Egypt’s diverse climatic zones, including coastal, desert, and semi-arid regions. Stations with incomplete records or significant data gaps were excluded to ensure data quality.
Rainfall measurements were recorded hourly or daily, depending on the station. Table 1 details the range of available records and the geographic coordinates of these stations. The rainfall data obtained from the Egyptian Meteorological Authority (EMA) stations are recorded on a daily basis for all 54 stations, while the data obtained from the Water Resources Research Institute (WRRI) are recorded on an hourly basis (only three WRRI stations were selected).
Table 1.
Years of record and locations of rain gauge stations.
Most stations (41 out of 54) have data spanning over 40 years, with 10 stations exceeding 75 years of records. Conversely, 13 stations have records shorter than 40 years, and only two have data for less than 19 years. The data were purchased from the Egyptian Meteorological Authority (EMA), ensuring access to high-quality, officially recorded rainfall measurements.
Additionally, short-duration rainfall data from various climatic zones in Egypt were collected and analyzed to estimate maximum rainfall depths for different durations. Rainfall storm data for durations of up to 24 hours were obtained from three specific stations: Saint Katherine, Marsa Matrouh, and Shalateen. These stations were selected because they represent distinct climatic zones: coastal (Marsa Matrouh) , mountainous (Saint Katherine) , and desert (Shalateen), ensuring the generalizability of the results across diverse regions. Furthermore, these stations are equipped with hourly monitoring provided by the Water Resources Research Institute (WRRI), which is critical for capturing high-resolution temporal rainfall data. The limited density of hourly recording stations in Egypt, combined with challenges such as insufficient monitoring infrastructure in remote areas and inconsistent recording practices, made it difficult to expand the analysis to a larger network. Additional stations were considered but excluded due to insufficient storm event data or inconsistent recording practices.
These rainfall events occurred during the period from 2015 to 2024, ensuring a robust dataset for analysis. The availability of hourly data allowed for precise estimation of short-duration rainfall depths, which is critical for constructing accurate empirical formulas and IDF curves.
2.3. Methods
Rain storms recorded from three gauges distributed across Egypt were collected for analysis. Two methods were applied to determine the ratios (generalized WRRI ratios) of storm depths at various durations, ranging from 10 minutes to 18 hours, relative to the 24-hour depth. The first method relies on recorded rainfall depths, while the second method employs frequency analysis. Frequency analysis was used, along with direct recording, to address specific limitations of relying solely on recorded depths. Recorded rainfall data may not adequately capture extreme rainfall intensities due to the limited number of storm events observed over time. Frequency analysis helps overcome these limitations by statistically modeling rainfall patterns and providing estimates for return periods that extend beyond the obs erved record. This ensures a more robust representation of rainfall intensities, particularly for rare but high impact events, which are critical for infrastructure design and flood risk management.
Initially, daily rainfall data were used to compile the maximum annual daily rainfall series. These maximum values were then converted into shorter durations (5, 10, 20, 30 minutes, and 1, 2, 3, 6, 12, 18 hours) using the generalized WRRI ratios. These durations are standard for hydrological analysis in Egypt and align with international practices for IDF curve development. Subsequently, the derived series were subjected to statistical analysis to estimate rainfall values corresponding to return periods of 2, 5, 10, 20, 25, 50, 100, and 200 years. These return periods align with standard infrastructure design requirements in Egypt, ensuring the practical applicability of the findings for engineering projects such as drainage systems, flood protection measures, and hydraulic structures.
The methodology for creating the isopluvial maps comprised five steps (Trypaluk 2024):
Data Preparation: Maximum daily rainfall records were collected and converted into short durations (e.g., 5, 10, 20, 30 minutes, and up to 24 hours) using generalized WRRI ratios.
Frequency Analysis: Various statistical distributions, including gamma, Gumbel, and log-normal, were tested. The gamma distribution was identified as the best fit based on goodness-of-fit metrics (Awadallah, Younan 2012).
Rainfall Depth Estimation: Rainfall values for durations from 5 minutes to 24 hours and return periods of 2 to 200 years were estimated.
GIS-Based Mapping: Using GIS tools and the inverse-distance-weighted (IDW) interpolation method, isopluvial maps were generated for different durations and return periods (Muhammad 2016).
Validation: The empirical formula and isopluvial maps were validated against observed rainfall data and previous studies to ensure accuracy (Fathy et al. 2014; El-Sayed 2017).
By integrating these steps, the study presents a comprehensive methodology for analyzing rainfall variability and providing valuable input for hydrological and engineering applications.
3. Results and discussion
3.1. Reduction formula
The Indian Meteorological Department (IMD) recommended an empirical reduction formula to estimate short-duration rainfall intensities from annual maximum rainfall data. This approach is especially useful in regions where sub-daily rainfall data are scarce or unavailable, because it allows engineers and hydrologists to derive short-duration rainfall estimates using more widely available daily rainfall records (Rasel, Islam 2015; Jalee, Farawn 2017). In Saudi Arabia, proposed ratios for 1-day rainfall are as follows: 0.37, 0.40, 0.46, 0.53, 0.61, 0.66, 0.70, 0.76, 0.80, and 0.87 for durations of 10, 15, 30, 60, 120, 180, 240, 360, 480, and 720 minutes, respectively (AlHassoun 2011; Kawara, Elsebaie 2022). Similarly, for the Sinai Peninsula, the proposed ratios for 1-day rainfall are 0.5, 0.57, 0.68, 0.70, 0.72, and 0.82 for durations of 0.5, 1, 2, 6, 12, and 18 hours, respectively (Awadallah, Younan 2012). Additionally, for Sinai, the WRRI-proposed ratios for 1-day rainfall are 0.18, 0.3, 0.36, 0.46, 0.58, 0.72, 0.77, 0.85, and 0.92 for durations of 5, 10, 20, 30, 60, 120, 360, 720, and 1080 minutes, respectively (El-Sayed 2017). The ratios from Saudi Arabia and the Sinai Peninsula were chosen because they represent arid and semi-arid regions with climatic conditions similar to those in Egypt. These regions also rely on sparse but reliable rainfall data, making their methodologies comparable. However, recent rainfall data were employed to develop a generalized equation for estimating short-duration rainfall from daily rainfall records.
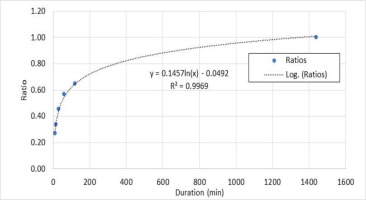
The reduction formula was derived using high-resolution, short-duration rainfall data collected from three key stations equipped with advanced monitoring capabilities: Saint Katherine, Marsa Matrouh, and Shalateen. These stations record rainfall depths at a high temporal resolution (5 minutes), ensuring precise and reliable estimates of maximum rainfall depths for durations ranging from 10 minutes to 24 hours. To derive the reduction formula, maximum rainfall depths for each storm were calculated at different durations and accordingly, the corresponding maximum annual rainfall depth. Frequency analyses were performed, and the ratio of storm depths for each duration was computed relative to the 24-hour rainfall depth for each return period. Table 2 illustrates the ratios developed using two distinct methods, while Figure 2 displays the average ratios for durations up to two hours. A logarithmic trendline was applied because it provided the best fit based on statistical metrics such as R2 and mean absolute error (MAE). The corresponding fitting equation was derived, providing a predictive tool for estimating short-duration rainfall depths.
Table 2.
Average depth ratios with respect to 24 hr. depth at different durations.
| Ratio | Duration(min) | |||||
|---|---|---|---|---|---|---|
| 10 | 15 | 30 | 60 | 120 | 1440 | |
| Firstmethod | 0.30 | 0.38 | 0.50 | 0.59 | 0.70 | 1.00 |
| Secondmethod | 0.24 | 0.30 | 0.42 | 0.54 | 0.60 | 1.00 |
| Average | 0.27 | 0.34 | 0.46 | 0.57 | 0.65 | 1.00 |
The Generalized Water Resources Research Institute (GWRRI) developed an empirical reduction formula to estimate short-duration rainfall depths for durations up to two hours. The formula is:
Rt = R * [0.1457 ln(t) 0.0492]
where: Rt is the estimated rainfall depth in mm at t duration; R is the daily rainfall depth in mm; t is the storm duration in minutes for which the rainfall depth is estimated.
This formula provides a practical tool for converting daily rainfall data into precise short-duration estimates, facilitating its application in hydrological modeling and engineering designs. Validation demonstrated its reliability in capturing extreme rainfall events critical for infrastructure projects. Validation was performed using R2. The results showed high accuracy, with R2 values exceeding 0.95 for most stations. The method’s ability to address gaps in conventional estimation methods makes it particularly valuable for adaptive planning.
Furthermore, a comparison between the ratios derived from data and frequency analysis (Table 2) and those estimated using the GWRRI formula (Table 3) reveals strong agreement. For most durations, the differences between the two methods are minimal, underscoring the reliability and robustness of the empirical formula. This consistency highlights the formula's effectiveness in providing accurate and reliable estimates of short-duration rainfall depths across diverse climatic zones in Egypt.
Table 3.
Comparison between the calculated GWRRI ratios and WRRI ratios.
| Ratio | Storm Duration (min) | |||||||||
|---|---|---|---|---|---|---|---|---|---|---|
| 5 | 10 | 20 | 30 | 60 | 120 | 360 | 720 | 1080 | 1440 | |
| GWRRI formula | 0.18 | 0.29 | 0.35 | 0.45 | 0.55 | 0.65 | 0.81 | 0.91 | 0.97 | 1.00 |
| WRRI ratios | 0.18 | 0.30 | 0.36 | 0.46 | 0.58 | 0.72 | 0.77 | 0.85 | 0.92 | 1.00 |
The rainfall depths estimated using the GWRRI formula have been compared with the WRRI ratios for Sinai (El-Sayed 2017), as shown in Table 3. The comparison reveals that the developed GWRRI ratios closely align with the WRRI ratios, demonstrating a fairly good agreement between the two methods. This consistency highlights the reliability of the GWRRI formula for estimating short-duration rainfall depths. Also, the new formula improves accuracy by incorporating recent rainfall data, making it more adaptable to current climatic conditions in Egypt.
3.2. Short duration estimation
The one-day annual maximum rainfall series was extracted from all available stations, using rainfall data from 54 stations to estimate short-duration rainfall. Daily rainfall records from various stations spanning the entire area of Egypt were converted into shorter durations using the GWRRI ratio.
Short durations of 5, 10, 20, 30, 60, 120, 360, 720, and 1080 minutes were generated for all years of available records. These durations are standard for hydrological analysis in Egypt and align with international practices for IDF curve development. As an example, Table 4 presents the tabulated short-duration rainfall data for the Abu-Redis station. Abu-Redis was chosen as an example because it represents a typical station with moderate rainfall variability, making it suitable for illustrating the methodology. Similarly, short-duration rainfall data were tabulated for the remaining 53 stations, providing a comprehensive dataset for analysis across Egypt.
Table 4.
Short duration rainfall series for Abu-Redis station.
3.3. Frequency analysis
The availability of data is essential for frequency analysis. The objective of frequency analysis is to relate the magnitude of extreme events to their frequency of occurrence by applying different probability distributions (Al-Amri, Subyani 2017; Gado et al. 2023). Several theoretical distribution functions have been used worldwide, such as Type I extreme value (Gumbel), general extreme value (GEV), Weibull, gamma, normal, log-normal, Pearson type III and log-Pearson type III distributions (Al-Aboodi et al. 2019; Shamkhi et al. 2022). Previous studies in Egypt and similar arid and semi-arid regions approached rainfall frequency analysis using a variety of probability distributions, often selected based on the availability of data and the specific climatic conditions of the region. In Egypt, previous research has commonly employed distributions such as the Gumbel, log-normal, and Pearson type III to model extreme rainfall events. These distributions were chosen for their ability to capture the variability and extremes observed in historical rainfall records (Trypaluk 2024).
In this study, the available data are sufficient at almost all stations to perform frequency analysis. Multiple probability distribution functions were applied to estimate maximum rainfall values for different return periods using Hyfran Plus v2.1 (El Adlouni, Bobée 2015; Almheiri et al. 2024) and Flood Frequency Analysis (Freq) software v2.0 (Hamed, Rao 2019). These programs offer a suite of powerful, adaptable, and user-friendly mathematical tools for statistically analyzing extreme events. They support various probability distributions and enable users to compare fitting results across multiple statistical dis tributions within the same dataset. Additionally, the Freq software employs standard goodness -of-fit tests, such as the chi-square test and the Kolmogorov-Smirnov test, to assist in selecting the best-fit distribution.
The probability distributions were analyzed to identify the distribution that best fits the annual rainfall data series. For all 54 stations, the gamma distribution provided the best fit. The gamma distribution was selected based on its statistically validated superiority over other distributions, its adaptability to regional variations, and its consistent performance across all stations. These considerations ensure that the chosen model provides accurate and reliable rainfall estimates for engineering and hydrological applications across Egypt. Consequently, this distribution was used to estimate rainfall values for durations ranging from 5 minutes to 1440 minutes (24 hours) and for return periods of 2, 10, 25, 50, 100, and 200 years. They provide a robust framework for addressing both current and future challenges posed by rainfall variability and climate change, ensuring that hydraulic structures and urban systems are resilient and sustainable. Table 5 illustrates the results of the frequency analysis for the El-Hasana station as an example. Similar analyses were conducted for the rainfall series from the remaining stations, ensuring a comprehensive understanding of rainfall patterns across Egypt.
Table 5.
Frequency results of rainfall depth (mm) at El-Hasana station.
3.4. IDF curves
The rainfall depths obtained from the frequency analysis were used to calculate rainfall intensity for various return periods (2, 5, 10, 20, 25, 50, 100, and 200 years) and durations ranging from 10 minutes to 1440 minutes (Table 4). Rainfall IDF curves, which illustrate the relationship between rainfall intensity, duration, and frequency, were developed for specific rainfall stations. The curves were derived directly from the frequency analysis results without additional adjustments. A total of seven sets of IDF curves were constructed for selected locations. Figure 3 shows the IDF curves for the Saint Katherine station as an example. Importantly, although the IDF curve formulation is consistent across the analyzed stations, the specific intensity values vary significantly due to spatial variation in rainfall depths.
Fig. 3.
Maximum rainfall intensities for different time intervals and return periods at Saint Katherine station.
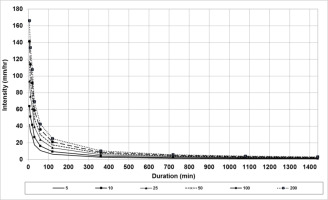
Significant spatial variations in rainfall intensities were observed across Egypt's diverse climatic zones. These curves are essential tools for hydrological and hydraulic design, providing critical insights into the expected rainfall intensities over various durations and frequencies for engineering and water resource planning purposes. Previous IDF curves for Egypt, such as those developed for the Sinai Peninsula (Fathy et al. 2014), were based on limited datasets and did not account for recent climate trends. The IDF curves developed in this study incorporate updated rainfall data through 2024 and are based on advanced statistical techniques, making them more accurate and reflective of current climatic conditions. These new IDF curves generally show higher rainfall intensities, particularly for shorter durations and higher return periods, compared to the older curves for the Sinai Peninsula, likely reflecting the impact of more recent and extensive data.
3.5. Isopluvial maps
Various short durations, up to 24 hours and return periods up to 200 years, were used to create isopluvial maps. These maps were generated using the Spatial Analyst tool of Arc-GIS. A raster surface is interpolated from points using the spatial analyst's inverse distance-weighted (IDW) approach. The IDW interpolation method is straightforward and easy to implement. It is based on the principle that objects adjacent to one another are more similar than those farther apart. Also, it assigns weights to sample points, such that the influence of one point on another declines with distance from the new point being estimated. A review of comparative studies of more than 70 spatial interpolation methods for 53 comparative studies in environmental sciences concluded that IDW, ordinary kriging (OK), and ordinary co-kriging (OCK) are the most frequently used methods (Muhammad 2016).
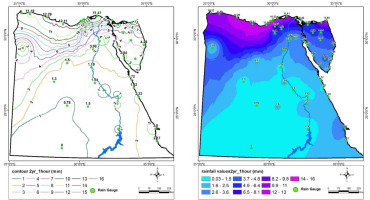
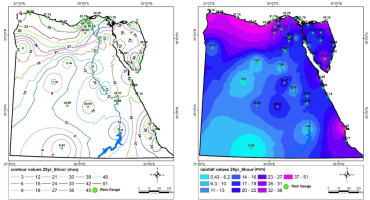
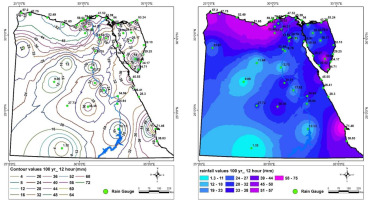
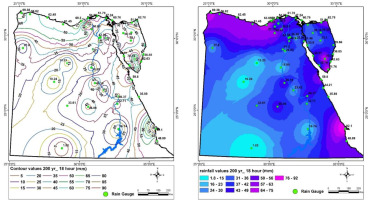
Isopluvial maps were developed for short durations of 5, 10, 15, 30, 60, 120, 360, 720, 1080, and 1440 minutes for various return periods; 2, 5, 10, 20, 25, 50, 100, and 200 years. These maps were generated using the IDW interpolation method. The accuracy of the IDW-generated maps was evaluated using rainfall data from independent stations not included in the interpolation process. Cross -validation techniques were applied by withholding data from specific stations, interpolating rainfall values for those locations, and comparing the interpolated results with the observed rainfall data. Further, the results were qualitatively validated by comparing the interpolated maps with observed rainfall patterns at selected stations, ensuring alignment with real-world observations. While IDW is straightforward and effective for evenly distributed data, it may over-smooth rainfall estimates in areas with sparse or unevenly distributed stations, such as Egypt's desert regions. This sensitivity to station density highlights a potential limitation of IDW in capturing local extreme rainfall events, particularly in regions with complex terrain. However, these evaluations confirmed that the IDW method provided reliable estimates of rainfall intensity across Egypt. The resulting maps were demonstrated both with and without filling the contour, as illustrated in Figures 3 through 6. The spatial resolution of the generated maps is 1 × 1 km, ensuring sufficient detail to capture local variations in rainfall intensity. This resolution aligns with standard practices for hydrological applications and ensures that the maps are suitable for engineering design and water resource management.
These maps highlight spatial variations in rainfall intensity across Egypt, offering essential tools for infrastructure planning. Figures 4-7 illustrate sample maps, which are valuable for identifying high-risk areas and optimizing the design of flood protection measures and hydraulic systems. These maps can be integrated into current engineering practices by providing precise rainfall intensity estimates at specific locations, aiding in the calibration of hydrological models and the design of drainage infrastructure tailored to local conditions. For instance, urban planners can use these maps to design stormwater management systems capable of withstanding extreme weather events. To quantify the uncertainty associated with the isopluvial maps, confidence intervals were calculated for the interpolated rainfall values at a 95% confidence level, providing a range within which true values are expected to fall with a specified level of confidence. These intervals ensure the reliability of the maps for practical applications. Sensitivity analyses were performed by comparing the IDW interpolation method with alternative techniques, such as kriging and spline interpolation. The results demonstrated that IDW outperformed the other methods in accurately capturing spatial rainfall patterns for this dataset. However, the analyses also highlighted the importance of considering alternative methods in future studies, particularly for regions with complex terrain or limited station coverage.
3.6. Climate change implications
The analysis conducted in this study revealed an increasing frequency of extreme rainfall events, consistent with global trends associated with climate change. These findings align with observations from previous studies that have documented shifts in rainfall patterns driven by rising global temperatures and changing atmospheric dynamics (Zittis et al. 2022). Specifically, the results indicate a notable increase in the intensity and variability of short-duration rainfall events across various regions of Egypt, particularly in coastal and mountainous areas (Nashwan et al. 2019; Roushdi 2022).
To quantify these changes, recent rainfall data (2000-2024) were compared with historical records (1968-2000). The analysis shows a statistically significant upward trend in extreme rainfall intensities, with an average increase of 15-20% in maximum daily rainfall depths across the studied regions. The statistical significance of these trends was confirmed using the Mann-Kendall test, yielding p-values less than 0.05 for most of the stations analyzed. These observed trends are supported by regional climate models, such as the Coordinated Regional Climate Downscaling Experiment (CORDEX) for Africa. Specifically, CORDEX projections under RCP4.5 and RCP8.5 scenarios indicate a 10-30% increase in extreme rainfall intensities by the end of the century, particularly in coastal and western regions of Egypt. These results highlight the need to revise existing design standards for hydraulic structures and adopt proactive strategies to address evolving climatic conditions. Incorporating satellite-based observations could further enhance adaptability by enabling real-time monitoring and extending coverage to remote areas. Furthermore, the spatial distribution of rainfall estimates in this study aligns with the high-resolution climatic zonation of Egypt developed by Hamed et al. (2022), which provides a reliable benchmark for validating the isopluvial maps. Comparing the interpolated rainfall depths with the observed data analyzed by Nashwan et al. (2019) further validates the accuracy of the IDW-generated maps. This study highlights the critical importance of continuous data updates and adaptive planning to enhance resilience against evolving climate challenges (Kourtis, Tsihrintzis 2022).
4. Conclusions and recommendations
This research introduces a comprehensive framework for rainfall estimation and infrastructure planning in Egypt. The analysis highlights an increasing frequency of heavy rainfall events and noticeable shifts in rainfall patterns, largely driven by climate change. This emphasizes the need to reassess the safety of existing hydraulic structures and incorporate updated rainfall analyses into the design of new structures. The methodologies outlined in this study provide practical guidelines for developing temporal and spatial distributions of rainfall, significantly contributing to improved water resource management and infrastructure planning.
The findings reveal that certain regions in Egypt are particularly vulnerable to these changes. Coastal areas, such as the northern coast, and mountainous regions, like Saint Katherine, are experiencing statistically significant increases in short-duration rainfall intensity and variability. These regions, along with arid zones like the Red Sea coast, face heightened risks of flash floods and severe water runoff events, threatening critical infrastructure such as urban drainage systems, roads, bridges, and flood protection measures. Ungauged locations lacking sufficient monitoring infrastructure are particularly vulnerable, as they rely heavily on accurate rainfall estimates for effective planning and design.
The proposed empirical formula, based on recent and extensive rainfall data, is more accurate than previously used reduction ratios. This improvement in accuracy is attributed to the incorporation of updated records from 54 stations across Egypt, capturing a broader range of climatic variability and recent trends influenced by climate change. The formula facilitates precise runoff and discharge estimations, which are essential for designing hydraulic structures and supporting flood forecasting, particularly in ungauged locations. The alignment between the calculated GWRRI ratios and the WRRI ratios highlights the reliability of the new formula. For instance, at durations exceeding 120 minutes, the GWRRI formula provides more conservative and realistic estimates than the WRRI ratios, reducing overestimation or underestimation of rainfall depths. These refinements ensure that the new formula better reflects current climatic conditions and variability across Egypt. The formula was also tested against observed rainfall data from independent stations, confirming its reliability and robustness. This quantitative validation underscores its superiority over older methods, making it a practical tool for hydrological analysis and infrastructure design. These results facilitate precise runoff and discharge estimations, which are essential for designing hydraulic structures. They also provide critical meteorological support insights for flood forecasting, especially in ungauged areas. Furthermore, this research serves as a valuable resource for decision-makers, designers, engineers, and planners involved in water resource management and infrastructure development, offering actionable insights to address evolving climatic challenges.
The key contributions of the study include:
Development of a validated empirical formula for estimating short-duration rainfall depths, offering a practical tool for hydrological analysis.
Creation of isopluvial maps for critical durations and return periods, supporting infrastructure design and planning.
Identification of climate-driven changes in rainfall patterns, including a statistically significant increase in short-duration rainfall intensity and variability, particularly in coastal and mountainous regions.
Despite these advancements, certain limitations must be acknowledged. The dataset is constrained by the availability and quality of rainfall records, particularly in remote and ungauged areas. Moreover, the empirical formula and isopluvial maps are based on historical data and may not fully capture future changes in rainfall patterns due to climate change. Uncertainties in interpolation methods, such as IDW, and the assumption of stationarity in frequency analysis also introduce potential biases.
Based on these findings, it is recommended that decision-makers prioritize the updating of design storm standards for urban drainage and small-scale hydraulic structures, particularly in coastal and mountainous areas identified as high-risk. Engineers should use the developed empirical formula for more accurate short-duration rainfall estimation in ungauged basins. Furthermore, investment in expanding the ground based monitoring network and integrating satellite rainfall data is crucial for improving real-time monitoring and future climate change impact assessments.

