1. Introduction
Heatwaves (HWs) are widely recognized as one of the most hazardous extreme climate phenomena globally. The World Meteorological Organization (WMO 2016) defines a HW as a period of abnormally high temperatures persisting for at least two or more consecutive days (Chambers 2020). Additional researchers have broadened this criterion to encompass three or more consecutive days of anomalously elevated temperatures, frequently linked to significant social, environmental, and economic repercussions (Perkins-Kirkpatrick, Lewis 2020; Raei et al. 2018). Heatwaves generally arise when daily maximum temperatures exceed the long-term average by 5-10°C, occasionally accompanied by elevated humidity, and are strongly associated with negative health effects, agricultural losses, infrastructure impairment, and wildfires (Russo et al. 2017; Chen et al. 2019).
Worldwide, HWs have already inflicted catastrophic consequences. The HWs in Chicago during 1980 and 1995 were among the most lethal natural catastrophes in the United States in recent decades, resulting in hundreds of deaths, especially among the elderly (Carlson 2008). The 2003 European heatwave resulted in more than 70,000 fatalities, predominantly among individuals over 75 years of age in France (Carlson 2008). These instances illustrate that HWs disproportionately affect vulnerable populations while also producing enduring consequences for agriculture and food security.
In Central Asia, especially Uzbekistan, HWs have increased in frequency and intensity over recent decades (USAID 2018b; World Bank 2021). The nation's arid and semi-arid continental climate, coupled with delicate ecosystems and limited water resources, heightens its susceptibility to excessive heat. Bukhara, Khorezm, and the Aral Sea basin are recognized as some of the most heat-affected areas, where HWs pose risks to public health, diminish agricultural productivity, and jeopardize sustainable development (UNFCCC 2016; World Bank 2020). Forecasts suggest that HWs in Uzbekistan might extend by 3-9 days and potentially by as much as 43 days by 2085 under high-emission scenarios (USAID 2018b). Such alarming projections highlight the urgent need for comprehensive scientific assessment and adaptation planning. This research examines the period from 1980 to 2020 and seeks to deliver a thorough evaluation of HWs in Uzbekistan. The primary objectives are (1) to ascertain heatwave thresholds and corresponding meteorological conditions; (2) to assess their effects on human health, agricultural output, and food security; (3) to investigate the correlation between HWs and climate change, including prospective scenarios based on CMIP6 projections; and (4) to delineate potential strategies and policies for mitigation and adaptation. A long-term view is crucial for identifying patterns and trends, as well as enhancing decision-making through superior forecasting and readiness.
This work addresses the information gap about HWs in Uzbekistan by merging observational datasets, reanalysis outputs, and climate model simulations. The findings are anticipated to offer significant insights for policymakers, health officials, and agricultural strategists in mitigating risks and bolstering resilience to excessive heat under a changing climate.
2. Data and methodology
2.1. Study area
Uzbekistan is a landlocked country in Central Asia, located between latitudes 37°N and 46°N and longitudes 56°E and 73°E. The area is approximately 447,000 km2, bordered by Kazakhstan to the north, Kyrgyzstan and Tajikistan to the east, Afghanistan to the south, and Turkmenistan to the southwest. The country's geography is varied, comprising vast deserts (particularly the Kyzylkum Desert), rich river basins, and mountainous areas in the east. The climate is primarily arid to semi-arid continental, marked by cold winters and extensive, hot, dry summers (USAID 2018b; World Bank 2021). Average summer temperatures in Uzbekistan frequently surpass 30°C, with daily maxima attaining 45-49°C in arid areas (World Bank 2021).
July is the warmest month, characterized by a heightened likelihood of HWs. The regions of Bukhara, Khorezm, and the vicinity of the Aral Sea are especially susceptible to high heat owing to their geographical positioning and dominant meteorological conditions. These regions also host significant agricultural activities, including cotton and wheat cultivation, which are particularly vulnerable to extended periods of elevated temperatures and water shortages.
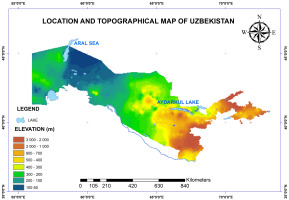
Uzbekistan's population is approximately 35 million (UZSTAT 2023), with prominent metropolitan centers including Tashkent, Samarkand, Bukhara, and Khorezm. Accelerated urbanization and inadequate adaptive infrastructure heighten the population's susceptibility to extreme heat. Furthermore, the ecological catastrophe in the Aral Sea region has intensified local climate extremes, making the northwest of the country a focal point for environmental stressors, including frequent HWs. Because of its geographic and meteorological attributes, Uzbekistan is a vital region for examining historical trends and future forecasts of HWs, along with their effects on human health, agricultural output, and food security (UNDP 2007; UNFCCC 2016). Uzbekistan's geographic position and the primary heat-prone areas are depicted in Figure 1.
2.2. Data
2.2.1. Reanalysis data
Two global reanalysis products were used to examine historical temperature variability and to identify HW occurrences across Uzbekistan. The ERA5 dataset from the European Centre for Medium-Range Weather Forecasts (ECMWF) provides high-resolution climate fields (0.25° × 0.25°) for the period 1980-2020, which were applied to analyze both spatial and temporal patterns of surface temperature and to create synoptic-scale sea-level pressure maps. The NCEP/NCAR Reanalysis produced by NOAA, with a coarser spatial resolution of 2.5° × 2.5° (Muñoz-Sabater et al. 2021), was also used for 1980-2020 to estimate HW thresholds and perform model comparison and validation (Copernicus Data Store). Heatwaves were identified when daily mean temperature anomalies exceeded 5°C above the long-term July average, following the criteria of Barbier et al. (2018). Given the limited and discontinuous nature of ground-based observations in Uzbekistan, these reanalysis datasets were preferred for their consistent spatial coverage and temporal continuity, making them suitable for long-term climate analysis.
2.2.2. Climate projection data
Projected changes in temperature were analyzed using data from the Coupled Model Intercomparison Project Phase 6 (CMIP6), retrieved from the Canadian Climate Data Portal (https://climate-scenarios.canada.ca). The simulations span 1961-2067 and were interpolated to a 1° × 1° grid for consistency. The data were divided into four climatic intervals to represent historical and future conditions:
Three Shared Socioeconomic Pathways (SSPs) – SSP1–2.6, SSP2–4.5, and SSP5–8.5 – were applied to project warming trends and spatial variability (Miao et al. 2014; Araya-Osses et al. 2020; Navarro-Racines et al. 2020). Special emphasis was placed on Bukhara and Khorezm, identified as the regions most vulnerable to extreme heat events.
2.2.3. Socioeconomic data
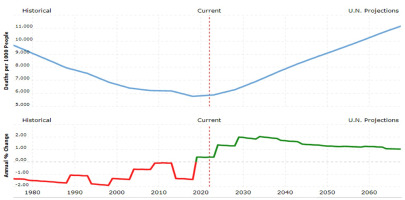
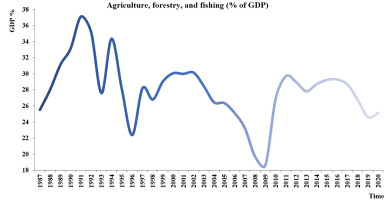
Global socioeconomic datasets were incorporated to assess the potential human and agricultural consequences of rising temperatures. The United Nations World Population Prospects (1976-2100) dataset was used to analyze mortality rates (per 1,000 population) for Uzbekistan, excluding deaths attributed to COVID-19. Additionally, the World Bank Agriculture, Forestry, and Fishing dataset (1987-2020) was employed to investigate agricultural output and the economy’s dependence on climate-sensitive sectors such as farming and irrigation.
2.2.4. Model validation data
Model performance was assessed using NCEP/NCAR reanalysis data as the observational baseline (Willmott et al. 2012; Duveiller et al. 2016). Three statistical indicators were computed to quantify the agreement between observed and simulated temperature fields:
Correlation coefficient (R): measures the strength of linear association.
Root Mean Square Error (RMSE): evaluates the magnitude of prediction errors.
Index of Agreement (d): expresses the overall model consistency with observations.
These statistical metrics (R, RMSE, and d) were applied to assess the performance of CMIP6 simulations over Bukhara and Khorezm (Akoglu 2018). The characteristics of all datasets used in this study are summarized in Table 1.
Table 1.
Data sources used in the study.
The combined datasets form a comprehensive foundation for analyzing both historical (1980-2020) and projected (1961-2067) temperature variability, as well as evaluating the socioeconomic implications of future HWs across Uzbekistan.
2.3. Methodology
The methodology employed in this study integrates statistical, synoptic, and climate projection techniques to analyze both historical and projected temperature variations and heatwave characteristics across Uzbekistan, with a particular focus on the Bukhara and Khorezm regions.
2.3.1. Spatial and temporal long-term mean of temperature (1980-2020)
To establish the baseline climatology and assess spatial-temporal variability of surface air temperature, the ERA5 reanalysis dataset provided by the ECMWF was utilized for the period 1980-2020. The ERA5 dataset offers high spatial and temporal resolution and has been widely validated for climatological studies (Muñoz-Sabater et al. 2021). Daily mean temperature data were processed and aggregated into monthly and seasonal means using MATLAB and Climate Data Operator (CDO) tools.
The long-term mean temperature for each grid cell was computed using Eq. (1):
where (Ti) is the monthly mean temperature for month i, and N represents the total number of months (480 for the 1980-2020 period).
Seasonal averages were calculated for the JJAS (June–July–August–September) period, which corresponds to the hottest part of the year in Central Asia. Spatial interpolation was performed using the Inverse Distance Weighting (IDW) method to visualize regional temperature gradients across Uzbekistan.
This climatological analysis provided the foundation for identifying the heat-prone regions and the warmest months, which served as a basis for subsequent heatwave detection and classification.
2.3.2. Heatwave identification and classification
Heatwave (HW) events were identified following the threshold-based approach of Barbier et al. (2018), where a 5°C temperature anomaly above the long-term July mean indicated a heatwave event. Similar definitions have been applied in previous global studies (Russo et al. 2017; Perkins-Kirkpatrick, Lewis 2020). Daily temperature data from ERA5 and NCEP/NCAR reanalysis (Kalnay et al. 2018) were used to calculate anomalies and to detect both heatwave (HW) and severe heatwave (SHW) occurrences during 1980-2020.
Each HW event was classified by its intensity and duration, as follows:
Sea-level pressure (SLP) and temperature fields from ERA5 were further analyzed to identify dominant synoptic patterns during HW periods. The 14-16 July 1986 HW over Khorezm was selected as a representative event to demonstrate the link between atmospheric circulation and surface temperature extremes.
2.3.3. Climate projection and future warming analysis
Future climate projections were derived from the Coupled Model Intercomparison Project Phase 6 (CMIP6) under three Shared Socioeconomic Pathway (SSP) scenarios – SSP1–2.6, SSP2–4.5, and SSP5–8.5 – representing low, moderate, and high greenhouse gas emission trajectories, respectively (Eyring et al. 2016).
Temperature outputs were interpolated to a 1° × 1° grid and divided into four climatic periods:
Temporal and spatial analyses were conducted to assess projected changes in heatwave frequency, intensity, and distribution across Uzbekistan.
To evaluate model performance, NCEP/NCAR reanalysis data were used as the observational benchmark (Kalnay et al. 2018), and three standard statistical indicators were computed:
Correlation coefficient (R) – linear agreement between observed and modeled data.
Root Mean Square Error (RMSE) – magnitude of average model error.
Index of Agreement (d) – measure of overall model-observation consistency (Willmott, Matsuura 2005).
Three statistical indicators – correlation coefficient (R), root mean square error (RMSE), and index of agreement (d) – were computed using Eqs. (2) – (4):
where (xi) and (yi) are observed (NCEP/NCAR) and modeled (CMIP6) temperatures, respectively; (x̅) and (y̅) denote their means; and n is the number of samples. As shown in Eqs. (2) – (4), these indicators collectively evaluate the linear relationship, model error magnitude, and overall agreement between observed and simulated temperatures. Validation was performed for Bukhara and Khorezm, identified as the regions most prone to extreme heat events.
2.3.4. Socioeconomic and agricultural impact assessment
To investigate the potential societal impacts of projected warming, the study integrated human mortality and agricultural datasets. Mortality rates (1976-2100) were obtained from the United Nations World Population Prospects; agricultural productivity indicators (1987-2020) were taken from the World Bank.
These datasets have been widely used in regional climate impact assessments (USAID 2018a; Liu et al. 2020).
This methodological framework integrates reanalysis-based statistical detection of HWs with CMIP6-driven future projections, providing a comprehensive foundation for understanding both historical and future HW behavior in Uzbekistan.
3. Results
3.1. Spatial and temporal variability of temperature (1980-2020)
ERA5 reanalysis data (1980-2020) reveal clear spatial and temporal variations in Uzbekistan’s temperature pattern. The annual cycle (Fig. 2) shows July as the hottest month, with mean temperatures above 30°C in Bukhara and Khorezm, and occasional peaks exceeding 40°C in some years.
Fig. 2.
Annual mean temperature (°C) for Uzbekistan’s hottest cities: (a) Khorezm and (b) Bukhara (1980-2020).
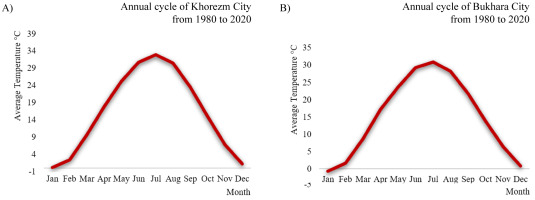
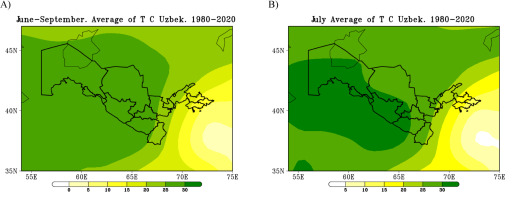
Figure 3 illustrates the spatial distribution of temperature, where (a) shows the June–July–August–September (JJAS) seasonal mean and (b) represents the July long-term mean. The highest temperatures occur in the southwestern and central regions (Bukhara, Khorezm, Navoi), while the eastern highlands remain cooler. This baseline climatology supports the identification of heat-prone areas and defines the long-term July mean used for heatwave analysis.
3.2. Heatwave occurrence and classification (1980-2020)
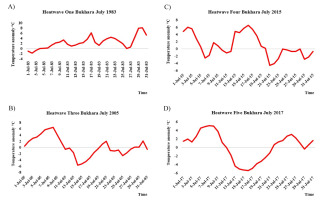
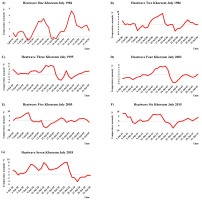
These thresholds were taken as temperature anomalies from the July mean, as shown in Tables 1 and 2. The tables below present the detected HW and severe heatwave (SHW) events in Bukhara and Khorezm during 1980-2020. If the temperature anomaly equals +5°C, it is classified as a HW, whereas anomalies greater than +5°C indicate severe HWs. A total of five HWs were recorded in Bukhara and seven HWs in Khorezm (Tables 2-3). The most intense events reached anomalies of 8°C above the long-term mean.
Table 2.
Heatwave statistics for Bukhara.
Table 3.
Heatwave statistics for Khorezm.
Heatwave events were detected using the 5°C anomaly threshold above the July mean. In Bukhara, five events were identified when daily temperature exceeded the mean by at least 5°C (Fig. 4). In Khorezm, seven events occurred under the same criterion (Fig. 5). Severe anomalies reached up to 8°C above the mean.
3.3. Synoptic patterns and heatwave case study (July 1986)
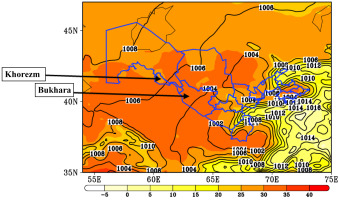
The mean sea-level pressure and temperature distribution (Fig. 6) show that low-pressure systems dominate Uzbekistan during July, especially over Bukhara and Khorezm. These synoptic conditions are strongly associated with high surface temperatures and stagnant air masses, which favor HW development.
Fig. 6.
July’s long-term mean (1992-2020) shows sea-level pressure in hPa and temperature in degrees Celsius over Uzbekistan.
A representative severe heatwave event was observed from 14 to 16 July 1986 in Khorezm. During this period, mean daily temperature anomalies exceeded +5°C (Table 4), confirming a strong and persistent heatwave episode. The synoptic charts (Fig. 7) show a stationary low-pressure center and calm conditions, which reinforced surface heating across the region.
3.4. Model validation
Model performance was assessed using NCEP/NCAR reanalysis data as reference. Statistical indicators were used to evaluate CMIP6 temperature projections over Bukhara and Khorezm. Results indicate that the model performed better in Bukhara (R = 0.28, RMSE = 0.76, d = 0.66) than in Khorezm (R = 0.04, RMSE = 0.97, d = 0.34), showing moderate reliability, as shown in Table 5.
3.5. Future temperature projections (1961-2067)
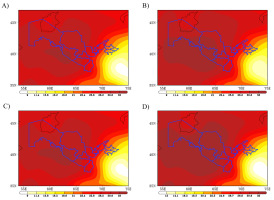
The CMIP6 model outputs under three SSP scenarios (SSP1–2.6, SSP2–4.5, SSP5–8.5) indicate a clear warming trend throughout Uzbekistan. Four meteorological intervals were analysed using CMIP6 multi-model ensembles: 1961-1992, 1993-2005, 2006-2036, and 2037-2067. During the historical period from 1961 to 2005, July average temperatures rarely exceeded 30°C, except at Khorezm (Fig. 8a-b). In the SSP1-2.6 scenario (2036-2067), July averages in Bukhara and Khorezm are projected to increase by 2–3°C (Fig. 8c–d). Projections with SSP2–4.5 and SSP5–8.5 suggest considerable warming, with average July temperatures above 33°C across vast areas of Uzbekistan by 2067 (Fig. 9a-d).
Fig. 8.
Spatial distribution of mean air temperature (°C) during the historical periods, where (a) represents 1961-1992 and (b) represents 1993-2005. For the SSP2–4.5 scenario, (c) corresponds to 2006-2036, and (d) corresponds to 2037-2067.
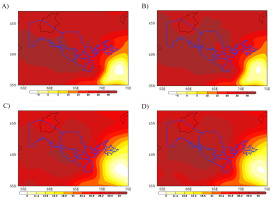
Fig. 9.
Spatial distribution of projected mean air temperature (°C) under SSP2–4.5 and SSP5–8.5 scenarios. Panels (a) and (b) represent SSP2–4.5 for 2006-2036 and 2037-2067, respectively, while panels (c) and (d) represent SSP5–8.5 for the same periods.
Figures 10 and 11 present temperature projection time series for Bukhara and Khorezm, including the historical baseline (1976-2005) and future periods (2006-2067). City-level projections suggest that July temperatures in Khorezm may rise by more than 1.5°C (Fig. 12) and more than 3°C in Bukhara (Fig. 13).
Fig. 10.
Time series of projected temperature over Bukhara, covering the historical period (1976-2005) and future projections (2006-2067) under CMIP6 SSP scenarios.
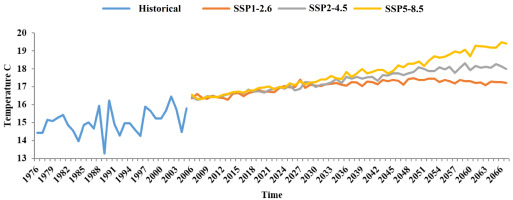
Fig. 11.
Time series of projected temperature over Khorezm, showing the historical (1976-2005) and future (2006-2067) temperature projections under CMIP6 SSP scenarios.

3.6. Projected mortality and agricultural trends (1976-2100)
Projected mortality data from the United Nations World Population Prospects (UN WPP) show that mortality rates are expected to increase steadily until 2067, coinciding with the projected temperature rise (Fig. 15). The World Bank agricultural dataset (1987-2020) shows that years with higher temperatures are generally associated with reduced crop productivity and greater water stress, underlining the vulnerability of Uzbekistan’s agricultural economy to climate extremes.
4. Discussion
The results indicate a clear warming pattern across Uzbekistan over the past four decades, consistent with regional trends in Central Asia (Liu et al. 2020). Similar findings have been reported in other regions of the world. For instance, Yaméogo (2024) found increasing extreme temperatures before, during, and after the rainy season in Burkina Faso, while Abatan et al. (2016) documented a rise in hot extremes and a decline in cold events across Nigeria. These African studies, like our results in Uzbekistan, confirm a persistent warming tendency in semi-arid and arid environments strongly influenced by large-scale atmospheric circulation.
Analysis of ERA5 data confirmed that July is the hottest month, with mean temperatures above 30°C in Bukhara and Khorezm, occasionally exceeding 40 °C. The June–September season is the main warm period, especially across the southwest and central plains, where low elevation and desert surfaces enhance heat accumulation. Comparable seasonal dynamics have also been reported in West Africa (Ankrah et al. 2023), where maximum and minimum temperatures have increased significantly under future climate scenarios, particularly during warm months.
Heatwave analysis (1980-2020) revealed five events in Bukhara and seven in Khorezm, mostly classified as severe (> +5°C anomaly). Though infrequent, HWs are intense due to stagnant atmospheric circulation and weak winds (Barbier et al. 2018; Chen et al. 2019). In the July 1986 case, a stationary cyclone caused calm winds and surface heat buildup, a pattern typical of Central Asian extremes (Kang et al. 2019). Similar patterns of prolonged summer heat and weak circulation were also observed in Serbia (Tošić et al. 2023), where warm days and tropical nights have increased notably during the past seven decades.
Model validation against NCEP/NCAR reanalysis showed moderate accuracy: good agreement for the index of agreement (d), but weak correlation (R). Despite local bias, CMIP6 models reliably captured the regional warming trend (Eyring et al. 2016; Chen et al. 2019). Future projections under SSP1–2.6, SSP2–4.5, SSP5–8.5 reveal a pronounced warming of 3.0 to 3.5°C by 2067 in Uzbekistan. The 30°C isotherm expands northward, indicating longer and stronger HWs (Kang et al. 2019). The eastern highlands remain cooler under persistent high-pressure influence. Projections of similar warming tendencies were also made for Europe; Tomczyk et al. (2022) reported continuous increases in maximum air temperature and the number of hot days across Poland throughout the twenty-first century.
Socioeconomic data highlight rising mortality and reduced agricultural productivity, consistent with higher temperatures and water scarcity (Sutton et al. 2013). Such impacts mirror regional trends of drought, evapotranspiration, and food insecurity (USAID 2018a; Liu et al. 2020).
Overall, Uzbekistan’s climate is warming rapidly; HWs, though rare, are intensifying. Without adaptation, CMIP6 projections suggest increasing risks to human health, agriculture, and water resources. Integrated adaptation measures and regional cooperation are urgently needed to build long-term climate resilience.
5. Conclusion
The 40-year temperature analysis (1980-2020) confirmed that July is the hottest month in Uzbekistan, with Bukhara and Khorezm identified as the main regions prone to HWs. Using the NCEP/NCAR reanalysis dataset, a 5°C anomaly above the July mean was determined as the heatwave threshold. Based on this criterion, five events were detected in Bukhara and seven in Khorezm. Synoptic assessment revealed that stationary cyclonic systems dominated during extreme events, causing calm winds and intense surface heating, typical precursors of severe heat episodes in Central Asia.
Future climate projections from CMIP6 models (SSP1–2.6, SSP2–4.5, SSP5–8.5) indicate a persistent warming trend, with mean temperatures expected to rise by 3 to 3.5°C by 2067, especially in the southwestern lowlands. This warming will likely increase heatwave frequency and intensity, aggravate water scarcity, and reduce agricultural productivity.
Socioeconomic analyses show that mortality rates may rise because of intensified thermal stress, while agricultural yields decline in hotter years, highlighting the vulnerability of Uzbekistan’s irrigation-dependent economy. Model validation demonstrated moderate but acceptable accuracy, particularly for Bukhara, supporting the use of CMIP6 outputs for regional assessments.
Overall, Uzbekistan’s climate is warming rapidly, and severe but infrequent HWs represent growing threats to human health, agriculture, and water resources. To enhance resilience, it is essential to strengthen early-warning systems, promote climate-smart agricultural practices, and implement integrated national adaptation strategies across Uzbekistan and Central Asia.

