1. Introduction
According to the World Economic Forum’s Global Risk Report of 2020 (WEF 2020), climate change is one of the most significant global challenges, both in terms of probability and impact. It profoundly disrupts the hydrological cycle, altering runoff patterns and influencing the frequency and intensity of extreme weather events (Esit, Yuce 2022; Tayara-Zobaida 2023). The acceleration of global warming exacerbates these effects, increasing risks globally. The average global temperature has risen by approximately 1.0°C compared to pre-industrial levels, with the period from 2015 to 2019 being the hottest years on record. This rise in temperature has significantly altered the frequency, duration, magnitude, and spatial distribution of extreme weather events. Moreover, a report by the World Meteorological Organization in 2021 (WMO 2021) revealed that, due to climate change, at least 3.6 billion people worldwide faced water scarcity each month in 2018. This number is expected to rise to 5 billion by 2050, highlighting the intensifying impact of climate change on global water resources. As a result, climate change presents significant challenges to sustainable water resource management worldwide. In Central Asia, including Kazakhstan, Uzbekistan, Kyrgyzstan, Turkmenistan, and Tajikistan, more than 93% of the land is arid. Since the 1970s, nearly half of the large lakes in this region have shrunk, and rivers are rapidly drying up, attributable to both climate change and human activities (Yue et al. 2021). In the Mediterranean region, global warming is occurring at a faster rate than in other parts of the world, resulting in significant changes in temperature, precipitation, and other climatic variables (Lionello, Scarascia 2018). Australia, too, has experienced a 1.0°C increase in temperature and a 16% decrease in rainfall since the 1970s (Silberstein et al. 2012), leading to more intense heatwaves, severe bushfire weather, reduced rainfall, and prolonged droughts (Aryal et al. 2020).
Vietnam, in Southeast Asia’s tropical monsoon zone, is highly exposed to the impacts of climate change (Schmidt-Thomé et al. 2014). Between 1958 and 2018, the annual temperature in the country rose 0.89°C (approximately 0.15°C per decade) (MONRE 2021). Rainfall patterns have become more variable, with northern Vietnam experiencing a decrease in rainfall (5-10% over 61 years), while southern Vietnam has seen an increase (5-15% over the same period) (MONRE 2021). Additionally, the fluctuations between high and low water volumes during different seasons create challenges for water usage and integrated water resources management in Vietnam’s river basins. The impacts of climate change on water resources vary greatly across regions (Guo et al. 2014; Lobodzinskyi et al. 2023), making it essential to conduct location-specific assessments, especially in tropical regions, which are undergoing significant changes. The Ba River basin, one of the largest river basins in the Central Highlands and south-central coast of Vietnam, plays a vital role in regional agriculture, hydropower generation, and domestic water supply. However, this basin has been increasingly subjected to hydrometeorological extremes such as droughts and floods, which are expected to intensify under future climate scenarios.
Despite the growing number of studies on climate change impacts on water resources in Vietnam, significant research gaps remain, particularly for the Ba River basin. First, most previous studies have focused on major river systems such as the Red River (Duong 2016; Duong et al. 2016; Ha, Bastiaanssen 2023; Nguyen, Tran 2024) and Mekong River basins (Khoi, Thang 2017; Le et al. 2024; Sam, Khoi 2022), leaving medium-sized basins like the Ba River relatively understudied. Second, existing assessments often rely on historical data or outdated climate scenarios (e.g., RCPs), with limited application of updated CMIP6-based shared socioeconomic pathways (SSPs) for long-term projections. The CMIP6 (Eyring et al. 2016) project’s global climate models (GCMs) are better at predicting the global energy balance (Wild 2020). Third, spatially explicit analyses of runoff changes within sub-basins or critical water-demand zones are scarce, limiting the understanding of local vulnerabilities. Additionally, little attention has been given to seasonal water shortages, especially during the dry season when competition for water use among agriculture, domestic supply, and hydropower becomes most intense. Uncertainty analysis , an essential component for validating climate-impact assessments, is often lacking or insufficiently addressed. Furthermore, there is a lack of integration between hydrological modeling outcomes and practical water management or adaptation strategies tailored to local contexts.
This study aims to address these gaps by developing a scientific framework for evaluating the impacts of climate change on runoff in the Ba River basin. Several previous studies have considered the development of a framework for assessing the impact of climate change on water resources (Hrour et al. 2023). Hydrological models are the main tools in this realm (Phan et al. 2010; Bekele et al. 2019; Kohnová et al. 2019; Khoi et al. 2021; Tariku et al. 2021; Gurung et al. 2022; Takele et al. 2022; Yang et al. 2022). However, the scarcity of monitoring stations within a basin poses a significant challenge for water resources research, an issue commonly encountered in basins worldwide. Using a combination of observed data (1981-2020), projected data under four SSP scenarios (SSP1-2.6, SSP2-4.5, SSP3-7.0, and SSP5-8.5) for the periods 2021-2040, 2041-2060, 2061-2080, and 2081-2100, and an integrated modeling approach, this research analyzes both historical trends and future changes in runoff. The Mann-Kendall test is applied to detect trends in temperature, rainfall, and runoff data; the Soil and Water Assessment Tool (SWAT) is used to simulate runoff responses to climate variations. The outcomes of this study are expected to provide valuable insights for water resource planning and adaptation strategies in tropical river basins under changing climate conditions.
2. Methods and materials
2.1. Study area
The Ba River basin (Fig. 1), covering an area of 13,848 km2, was selected as the study area, with its upper part in the Central Highlands and its lower part in the south-central coastal region of Vietnam. The Ba River basin plays a vital role in the socio-economic development of the Central region, spanning three provinces: Gia Lai, Dak Lak, and Phu Yen, supporting a population of approximately two million people. The terrain ranges from 0 m above sea level (asl) in the eastern coastal plain to a maximum elevation of 1,983 m asl in the northern mountainous area, with an average basin elevation of 469 m asl. The Ba River originates from Ngoc Ro Peak (1,549 m asl) in the Truong Son Mountain range; the mainstem length is 374 kilometers. The river network density is approximately 0.22 km per km2.
Fig. 1.
Distribution of monthly temperature (T), rainfall (R) and discharge (Q) in the Ba River basin.
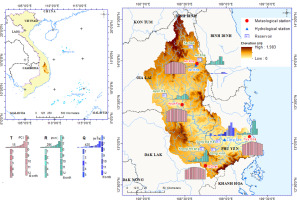
The Ba River basin, located in the tropical climate zone, is monitored by four meteorological stations , An Khe, AyunPa, MDrak, and Tuy Hoa, and by two hydrological stations, An Khe and Cung Son, which collected data from 1981 to 2020. The characteristics of these stations are summarized in Table 1. The meteorological stations provide daily data on rainfall, temperature, humidity, wind speed, and solar radiation, while the hydrological stations record discharge and water levels within the basin.
Table 1.
Network of gauging stations in the Ba River basin.
The variability of climatic factors in tropical river basins is very complex, and the Ba River basin is a clear example. Descriptive statistics for 30 data series at 4 meteorological stations and 2 hydrological stations in the Ba River basin are presented in Table 2. The temperature in the Ba River basin varies widely across the basin. Normally, the temperature in the high mountainous area is lower than on the plains. During the period 1981-2020, the average annual temperatures at the An Khe, AyunPa, MDrak, and Tuy Hoa meteorological stations were 23.7°C, 25.5°C, 24.0°C, and 26.8°C, respectively. The difference between the maximum and minimum monthly temperatures in the basin ranges between 6 and 7°C. The maximum temperature in the basin is 41.3°C at the AyunPa station; the minimum is 9°C at the An Khe station.
Table 2.
Statistical results for observed data series at stations. TA = average annual temperature, TX = maximum temperature, TN = minimum temperature, RA = annual rainfall, RX = maximum 1-day rainfall, Qy = average annual discharge, Qf = discharge in flood season, Qd = discharge in low-flow season, Qx = maximum discharge, Qn = minimum discharge.
Annual rainfall in the Ba River basin is also highly variable and complex in both spatial and temporal distribution, depending significantly on topography and atmospheric circulation. The average annual rainfall in the Ba River basin is spatially variable: 1638 mm at the An Khe station, 1249 mm at the AyunPa station, 2103 mm at the MDrak station, and 2052 mm at the Tuy Hoa station during the period 1981-2020. The rainy season accounts for approximately 90% of total annual rainfall (from May to December) in mountainous areas and 75-85% (from September to December) in coastal plains. Heavy rainfall events occur especially in October and November. During the dry season, rainfall accounts for only 10-25% of the annual total.
The average annual discharge was 28 m3/s at the An Khe station and 273.4 m3/s at the Cung Son station during the period 1981-2020. In the upstream area, the flood season lasts four months (from September to December) due to the influence of the southeastern monsoon. In the downstream area located on the eastern slope of the Truong Son Range, the flood season lasts three months (from October to December), influenced by the northeastern monsoon circulation and associated weather disturbances. The flood season in the Ba River basin is typically short, but it contributes approximately 70% of the annual water volume. The highest flows occur in October in the upstream area and in December in the downstream area. The low-flow modulus of the Ba River basin is 9.2 l/s/km2. The low-flow season discharge of the Ba River basin is among the lowest in Vietnam. The month with the lowest discharge is typically April, during which discharge accounts for less than 2% of the total annual flow.
Since 2001, six major hydroelectric reservoirs have operated within the Ba River basin (Fig. 1), with a total storage capacity of 1455 × 106 m3, approximately 17% of the average annual water volume recorded at the Cung Son station. Located upstream from this station, the reservoirs have a substantial influence on the flow regime. The average annual discharge at Cung Son declined from 300 m3/s in 1981-2000 to 247 m3/s in 2001-2020. These changes indicate that both climate change and hydropower activities have contributed to alterations in the flow regime of the basin. This study adopts the 1981-2000 period as the baseline to evaluate the impacts of climate change on runoff in the Ba River basin.
2.2. Homogeneity test of data series
Ensuring the homogeneity of temperature, rainfall, and discharge data series is a crucial step in hydrometeorological analysis. Tests such as Pettitt’s, the standard normal homogeneity test (SNHT), Buishand range test, and the von Neumann test are widely applied to detect inhomogeneities or change-points in observed data series. Pettitt’s test, a non-parametric method, can detect abrupt changes at any point in the series without assuming a normal distribution. The SNHT is particularly effective in identifying shifts in the mean that occur near the center of the series, which may result from changes in station location or instrumentation. The Buishand Range test evaluates changes in the mean by analyzing cumulative deviations from the overall mean, making it suitable for detecting step changes. The von Neumann test is used to assess randomness in the data, helping to identify inhomogeneities caused by irregular changes between consecutive observations. Applying these tests to rainfall or streamflow data enables researchers to verify and cross-check results, thereby increasing the reliability of homogeneity assessments. Early detection of inhomogeneities allows for correction or adjustment of the data, minimizing systematic errors. As a result, trend analysis, simulation, and projections based on the data become more accurate. These procedures are particularly important for evaluating the impacts of climate change on water resources. This research used the XLSAT tool in Excel to calculate Pettitt’s test, SNHT, the Buishand range test, and the von Neumann test. To test the homogeneity of the observation data series, Pettitt’s test, SNHT, the Buishand range test, and the von Neumann test at 5% significance level. were calculated by XLSTAT. The homogeneity test results for 30 datasets are shown in Table 3. The results were classified into three categories, namely “useful,” “doubtful,” and “suspect,” based on four homogeneity tests to select the homogeneous observed data series. The results of the Pettitt test, SNHT, Buishand test, and Von Neumann ratio test showed that 10, 11, 11, and 7 out of the 30 data sets, respectively, were identified as inhomogeneous.
Table 3.
Homogeneity test results for observed data series at meteorological stations using different methods at 95% significance level. TA = average annual temperature, TX = maximum temperature, TN = minimum temperature, RA = annual rainfall, RX = maximum 1-day rainfall, Qy = average annual discharge, Qf = discharge in flood season, Qd = discharge in low-flow season, Qx = maximum discharge, Qn = minimum discharge.
The annual average temperature (TA) data showed inhomogeneity at AyunPa, MDrak, and Tuy Hoa stations. The maximum temperature (TX) data indicated inhomogeneity at MDrak station, while the minimum temperature (TN) data revealed inhomogeneity at An Khe and AyunPa stations. The annual rainfall (RA) data were homogeneous across all monitoring stations; however, the data on the maximum 1-day rainfall (RX) indicated inhomogeneity at AyunPa. The breakpoints detected by all tests tended to occur at various points throughout the study period.
The data on average annual discharge, flood season flow, dry season flow, and maximum discharge are all homogeneous. Meanwhile, the minimum discharge data show inhomogeneity at both An Khe and Cung Son stations. It can be seen that many hydrometeorological data series lack homogeneity, which creates difficulties in calculations and assessments. Several studies aimed at checking the homogeneity of hydrometeorological data series have yielded comparable results. For instance, a study of annual rainfall data in Turkey (Bickici Arikan, Kahya 2019) from 1974 to 2014 identified 44 out of 160 stations as having non-homogeneous data. Likewise, research on rainfall, temperature, and humidity in Nineveh Governorate (Iraq) (Elzeiny et al. 2019) during the 1990-2020 period also revealed non-homogeneity in some data series across the 8 monitoring stations analyzed.
2.3. Trend analysis using the Mann-Kendall test
The Mann-Kendall non-parametric statistical test (Kendall 1970), further developed by the U.S. Geological Survey (Helsel et al. 2006), has been widely used in climate and hydrological sciences to detect trends in time series data. In this study, the Mann-Kendall test was applied to identify trends in climatic and hydrological variables in the Ba River basin. Observed data from the period 1981 to 2020 were used in the analysis.
The data values are evaluated as an ordered time series where each data value is compared to all subsequent data values. a1, a2, … an represent n data points where aj represents the data point at time j and aj and ak are sequential data in series. The Mann-Kendall test statistic (S) is identified using the following equation:
Where:
The variance of S, VAR(S) is calculated by the following equation:
Where n is the number of data points, g is the number of tied groups, and tp is the number of data points in the pth group.
The normalized Z statistics value is used to test the trend, in which a negative value Z statistic indicates a decreasing trend, while a positive value Z statistic indicates an increasing trend. The following formula is used to calculate a normalized test statistic Z:
2.4. Bias correction using CMHyd
Cropland accounts for 45-50% of the Ba River basin (CCI 2017), which is why this study uses predicted data from the ACCESS-ESM1.5 model. ACCESS-ESM1.5 is Australia’s version of a global climate model and one of 23 models participating in Phase 6 of the Coupled Model Intercomparison Project (CMIP6) collected from WorldClim2. It can be used for various climate application (ns, including estimating the individual and combined impacts of different factors on past, present, and future climate change (Ziehn et al. 2020). Moreover, ACCESS-ESM1.5’s distinctiveness lies in its status as (to this researcher’s knowledge) the only CMIP6 model with terrestrial phosphorus limitation (Ziehn et al. 2020). Studies have shown that climate model outputs often contain biases; therefore, it is strongly recommended to apply bias correction to GCMs and regional climate model (RCM) outputs before using them in hydrological models (Willkofer et al. 2018; Hrour et al. 2023). Climate model data for hydrologic modeling (CMhyd) is a Python-based tool that facilitates the use of global and regional climate data in hydrological simulations by applying both spatial and temporal bias correction techniques. In this study, monthly rainfall, as well as maximum and minimum temperature data, were extracted at a spatial resolution of 30 arc-seconds for the four meteorological stations. The data included both historical (1992-2001) observations and future climate projections under the SSP1-2.6, SSP2-4.5, SSP3-7.0, and SSP5-8.5 scenarios from the ACCESS-ESM1.5 model, using ArcGIS 10.5. These datasets were then bias corrected using the CMhyd tool. The CMhyd model was applied to correct biases in maximum and minimum temperature, as well as average monthly rainfall data. Previous studies have compared various bias correction techniques to determine the most suitable method (Hrour et al. 2023). In this study, both the linear and delta methods were tested. The delta method performed poorly for rainfall data at the Tuy Hoa station; therefore, the linear method was selected for bias correction in this analysis.
2.5. Hydrological model
The SWAT model was used to evaluate the impact of climate change on the runoff in the study basin. The version used in this study was ArcSWAT 2012.10-5.24. The SWAT model requires data for meteorological (daily rainfall, humidity, temperature, wind speed, and solar radiation) and spatial (digital elevation model, land use, and soil maps) variables. It is common that a lack of meteorological and hydrological measurement networks, or only very recent measurements, has led to limited or absent data in many river basins, including in Vietnam. In this study, we use meteorological data from the four observation stations in the Ba River basin.
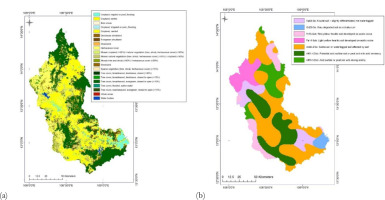
Spatial data were collected from various sources and configured to meet the requirements of the SWAT model. A digital elevation model (DEM) with a resolution of 30 m was collected from the ASTER Global Digital Elevation Map data source, which can be downloaded at no cost from http://asterweb.jpl.nasa.gov/gdem.asp, and extracted into the study basin (Fig. 1). The study also used a land-cover map with a resolution of 300 m from the Climate Change Initiative Land Cover team at the Université Catholique de Louvain (CCI 2017). The maps employ a legend based on the FAO/UNEP Land Cover Classification System to be compatible with previous products (Fig. 2a). This legend is converted to types of land-cover classes, which are similar to SWAT’s classification. A soil map with scale 1:5,000,000, produced by the United Nations Food and Agriculture Organization (Fig. 2b), was used in this study (FAO 2003). The database used for this soil map in SWAT was taken from MWSWAT2012. To our knowledge, this is the first time that the ASTER-CCI-FAO spatial input dataset has been configured for a tropical basin in the SWAT model.
Direct measurement of evapotranspiration (ETo) is often difficult, time-consuming, and costly. Consequently, ETo is commonly estimated using climatic variables such as humidity, temperature, wind speed, and solar radiation. In the SWAT model, various methods are employed for this estimation: The Hargreaves (HG) method, which is temperature-based; the Priestley-Taylor (P-T) method, which is radiation-based; and the Penman-Monteith (P-M) method, which combines various factors. In this study, we used meteorological data from the four stations An Khe, AyunPa, MDrak, and Tuy Hoa (Fig. 1) to estimate ETo using the Penman-Monteith method.
Because hydropower plants in the basin proliferated rapidly after 2001, to simulate the change in natural discharge, the study used monitoring data at the Cung Son station from 1992-2001. River discharge data from the period 1992-1996 were used to calibrate the model, data from 1997-2001 to validate it. Because the reservoir system began operating in the Ba River basin in 2002, this study did not use data after 2002 for calibrating and validating the model.
2.6. Evaluation of the hydrological model performance
This study applied the SWAT-Calibration and Uncertainty Programs (SWAT-CUP) program with the SUFI2 (Sequential Uncertainty Fitting algorithm) uncertainty analysis procedure (Abbaspour 2015) for sensitivity/calibration analysis. The calculated indices were as follows:
Coefficient of determination (R2):
Where n is the number of observations,
The Nash-Sutcliffe efficiency (NSE), a normalized statistic, establishes how much residual variation there is in relation to the variance of the measured data (Nash, Sutcliffe 1970). An ideal match between the simulated and the observed data is indicated by NSE = 1. In contrast, NSE ≤ 0 indicates that the model’s simulation is less accurate than the observed mean.
The PBIAS coefficient is expressed by Equation 3:
PBIAS = 0 indicates a correct simulation of the model. PBIAS > 0 indicates that the simulated value is lower than the actual value, whereas PBIAS < 0 indicates that the simulated value is higher than the actual value (Gupta et al. 1999).
3. Results and discussion
3.1. Trend of temperature and rainfall in the tropical basin
Prior to trend determination, a Durbin-Watson test (Order = 1) was performed to assess the presence of autocorrelation. The results indicated that all 20 temperature and precipitation data series yielded p-values < 0.0001, confirming that the subsequent trend analysis would not be influenced by autocorrelation. To consider climate change in the basin, the study applied the Mann-Kendall test to calculate trends in temperature and rainfall parameters. The p-values of average annual and minimum temperature at An Khe station, average annual temperature at the AyunPa station, average annual and maximum temperature at the MDrak stations, and average annual temperature at the Tuy Hoa station were < 0.05 (Tab. 4)m indicating significant trends. The Tau, S, and Z values of the average annual, maximum, and minimum temperature at the four stations were > 0 (Tab. 4). During 1981-2020, temperature either demonstrated a statistically significant increasing trend or showed no discernible trend. The annual average temperature showed an increasing trend at all four monitoring stations, with relatively small differences in the rate of increase. Specifically, the rates of increase in annual average temperature at An Khe, AyunPa, MDrak, and Tuy Hoa were 0.25°C, 0.35°C, 0.28°C, and 0.29°C per decade, respectively.
The calculated results of Tau, S and Z of the annual rainfall total and maximum 1-day rainfall at two stations, An Khe and MDrak, were > 0 while those at the AyunPa and Tuy Hoa stations were < 0. However, all parameters also had a p-value > 0.05. The average annual and maximum 1-day rainfall in the Ba River basin did not have a significant trend. The results of the Mann-Kendall trend test and the homogeneity test identified a unique trend of increasing average annual temperature at An Khe station. The analysis of annual data showed that climate change in tropical river basins is very complex, and it is difficult to identify trends. A study on the lower Mekong River (Dang et al. 2020) also showed that during the period 1989-2017, rainfall exhibited complex fluctuations, and the impact of southern oscillation (ENSO) processes on rainfall was very strong. Analysis of precipitation records indicates a pronounced influence of large-scale climatic oscillations on rainfall distribution within the basin. During El Niño years, exemplified by 1997, annual precipitation was markedly below the multi-year climatological mean.
Specifically, in 1997, the mean annual rainfall at the An Khe, AyunPa, MDrak, and Tuy Hoa meteorological stations was 1100, 1271, 1270, and 1769 mm, respectively. In contrast, La Niña years, such as 1999, were associated with substantially above-average precipitation. In that year, total annual rainfall reached 1889.1 mm at An Khe, 1720.5 mm at AyunPa, 3259.8 mm at MDrak, and 2771.1 mm at Tuy Hoa, reflecting the strong positive phase of the El Niño-ENSO impact on regional hydrometeorological conditions. Therefore, based on the characteristics of water use in the Ba River basin, the study selected the period 1981-2000 as the baseline for comparative calculations.
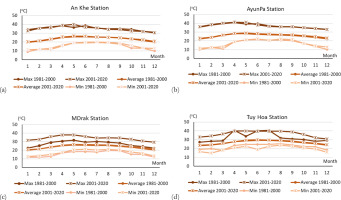
The average monthly air temperatures at all meteorological stations during the period 2001-2020 were higher than those in the 1981-2000 baseline period (Fig. 3). The average annual temperatures during the baseline period were 23.5°C at the An Khe station, 25.6°C at the AyunPa station, 23.7°C at the MDrak station, and 26.6°C at the Tuy Hoa station. In comparison, during the period 2001-2020, these values increased to 23.9°C, 26.3°C, 24.4°C, and 27.1°C, respectively.
Fig. 3.
Monthly average, maximum, and minimum air temperatures for the periods 1981-2000 and 2001-2020 at (a) the An Khe, (b) AyunPa, (c) MDrak and (d) Tuy Hoa stations.
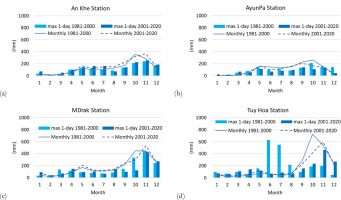
Rainfall also differed between the two periods, 1981-2000 and 2001-2020, across the meteorological stations. Monthly rainfall for both periods at the four stations is illustrated in Figure 4. During the baseline period 1981-2000, the average annual rainfall was 1509 mm at the An Khe station, 1349 mm at the AyunPa station, 2057 mm at the MDrak station, and 2149 mm at the Tuy Hoa station. For the period 2001-2020, these values were 1767, 1148, 2150, and 1955 mm, respectively. Comparing the two periods before and after 2000, rainfall tended to increase at stations situated in high-altitude areas (above 400 m asl), such as An Khe and MDrak, whereas it tended to decrease at stations located in lower-altitude areas (below 160 m asl), such as AyunPa and Tuy Hoa. The duration of the rainy season varies across the basin. In the upper basin, it typically extends from May to December, contributing more than 90% of the annual rainfall. In contrast, the rainy season in the downstream areas lasts from September to December, accounting for less than 80% of the annual total. The concentration of high rainfall in just four months in the downstream region presents challenges for freshwater availability in tropical river basins in general, and particularly in the Ba River basin.
3.2. Trend of runoff in the tropical basin
Before assessing discharge trends, a Durbin-Watson test (order = 1) was applied to detect potential autocorrelation. All 10 discharge time series produced p-values < 0.0001, thereby confirming that autocorrelation would not influence the subsequent trend analysis. To identify the runoff trend in the basin, the study applied the Mann-Kendall test to estimate trends in runoff parameters (Tab. 5). Values of Tau, S, and Z of almost all parameters (except minimum discharge) at the An Khe station were < 0 (Tab. 5). However, only the p-value of minimum discharge at the Cung Son station was <0.05. Other parameters of runoff in the Ba River basin did not have significant trends. Based on the Mann-Kendall trend test and the homogeneity test, no trend was identified at any station in the Ba River basin. Similar to climatic factors, runoff data calculations show that runoff in tropical river basins is very complex, making it difficult to determine trends. In 1997, streamflow at hydrological stations within the Ba River basin reached exceptionally low levels, with values of 19.65 m3/s at the An Khe station and 201.3 m3/s at the Cung Son station. In contrast, in 1999, streamflow was considerably higher, measuring 46.0 m3/s at An Khe and 459.5 m3/s at Cung Son.
Monthly, maximum, and minimum discharge values for 1981-2000 and 2001-2020 at two stations in the Ba River basin are illustrated in Figure 5. In contrast to the complex fluctuations in rainfall, runoff showed a decreasing trend between the two periods. Specifically, the observed discharge at the An Khe station declined by 13.8%, while that at the Cung Son station decreased by 17.6%.
Fig. 5.
Monthly average, maximum, and minimum discharges for 1981-2000 and 2001-2020 at (a) the An Khe and (b) Cung Son stations.

Between the two periods, 1981-2000 and 2001-2020, flood season water volume decreased by 20.7% at the An Khe station and 19.8% at the Cung Son station. In contrast, the water volume during the low-flow season increased by 2% at the An Khe station but decreased by 11.6% at the Cung Son station. At the An Khe station, the maximum discharge during 1981-2000 and 2001-2020 was 2440 m3/s and 3060 m3/s, respectively, while the minimum discharge was 0.295 m3/s and 0.1 m3/s. At the Cung Son station, the maximum discharge during 1981-2000 and 2001-2020 was 20,700 m3/s and 13,500 m3/s, respectively, while the minimum discharge was 7.73 m3/s and 1.41 m3/s. The distribution of water resources between the flood and low-flow seasons is greatly imbalanced in tropical river basins – a characteristic feature of these regions that also complicates water resource management. Therefore, it is essential to consider seasonal flow variations when planning and regulating water use in tropical river basins.
3.3. Climate change scenarios
Future climate data were extracted from the ACCESS-ESM1.5 model under four scenarios: SSP1-2.6 (sustainability), SSP2-4.5 (middle of the road), SSP3-7.0 (regional rivalry), and SSP5-8.5 (fossil-fueled development), corresponding to the time periods 2021-2040, 2041-2060, 2061-2080, and 2081-2100. The data were extracted at a high spatial resolution of 30 arc-seconds for the four meteorological stations in the Ba River basin using ArcGIS 10.5 software.
The extracted datasets included maximum and minimum temperatures as well as average monthly rainfall for each scenario and time period. For bias correction by CMHyd, historical climate data from the period 1992-2001 were also extracted and used as the reference baseline at the four meteorological stations.
The results after bias correction, illustrated in Figures 6 and 7, were used as input data for the SWAT model to simulate discharge in the Ba River basin. Changes in maximum and minimum temperatures and annual average rainfall during the periods 2021-2040, 2041-2060, 2061-2080, and 2081-2100 under the SSP1-2.6, SSP2-4.5, SSP3-7.0, and SSP5-8.5 scenarios, in comparison with the baseline period 1981-2000, are presented in Table 6.
Table 4.
Results of the Mann-Kendall test for trends. TA = average annual temperature, TX = maximum temperature, TN = minimum temperature, RA = annual rainfall, RX = maximum 1-day rainfall, Tau = Kendall’s Tau, S = Mann-Kendall test statistic, Z = the normalized test statistic, p = probability.
Table 5.
Calculated results by the Mann-Kendall test. Qy = average annual discharge, Qf = discharge in flood season, Qd = discharge in low-flow season, Qx = maximum discharge, Qn = minimum discharge, Tau = Kendall’s Tau, S = Mann-Kendall test statistic, Z = the normalized test statistic, and p = probability.
Table 6.
Changes in maximum and minimum temperature (°C) and annual average rainfall (%) compared to the period 1981-2000 with bias correction.
Fig. 6.
Projected maximum and minimum temperatures for the periods 2021-2040, 2041-2060, 2061-2080 and 2081-2100 under the four scenarios of SSP1-2.6, 2-4.5, 3-7.0, and 5-8.5 at (a) the An Khe, (b) AyunPa, (c) MDrak, and (d) Tuy Hoa stations with bias correction.
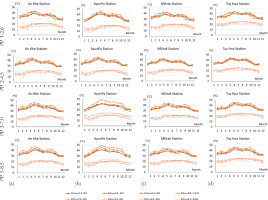
Fig. 7.
Projected monthly rainfall for the periods 2021-2040, 2041-2060, 2061-2080, and 2081-2100 under the four scenarios of SSP1-2.6, 2-4.5, 3-7.0, and 5-8.5 at (a) the An Khe, (b) AyunPa, (c) MDrak, and (d) Tuy Hoa stations with bias correction.
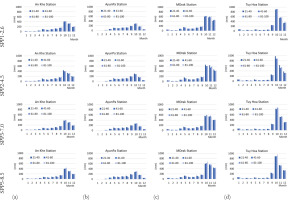
Rainfall and temperature data were bias corrected to match the observed data during the reference period. The range of maximum temperature variation was from –6.5°C to +6.0°C without bias correction, and from –1.8°C to +12.7°C with bias correction. For minimum temperature, the range was from –4.3°C to +14°C without correction, and from –3.5°C to +7.3°C with correction. For rainfall, the range was from – 43% to +7.9% without correction, and from –20.6% to +25.2% with correction. Linear scaling was applied for the bias correction. The results after bias correction show that the maximum temperature increased at all stations, except for the period 2021-2040 under the SSP2-4.5 scenario at the AyunPa station, and for the period 2041-2060 under the SSP1-2.6 and SSP5-8.5 scenarios at the Tuy Hoa station (Tab. 6). The minimum temperature in the four periods under the four climate change scenarios showed periods of both increase and decrease compared to the baseline period. Typically, high-emission scenarios (SSP3-7.0 and SSP5-8.5) exhibit higher maximum and minimum temperatures than low-emission scenarios (SSP1-2.6 and SSP2-4.5). The annual average rainfall increased at two stations in the upper basin and decreased at two stations in the lower basin during all four periods under the four climate change scenarios. The high-emission scenario (SSP5-8.5) tended to show a smaller increase in rainfall compared to the low-emission scenario (SSP1-2.6).
3.4. Impact of climate change on runoff
Based on the results extracted from the ACCESS-ESM1.5 model, this study applied the SWAT model to simulate the monthly water discharge. The calibration results for the period 1992-1996 at the Cung Son station showed R2, NSE and PBIAS indices of 0.90, 0.90, and –0.8%, respectively. The validation results for the period 1997-2001 at the Cung Son station showed R2, NSE and PBIAS indices of 0.89, 0.88, and 2.6%, respectively. To assess the sensitivities of the parameters, the SUFI-2 method from SWAT-CUP was applied, resulting in the identification of the seven most sensitive parameters. A total of 1000 simulations was performed to optimize the model outputs. A list of the sensitive parameters is provided in Table 7. The uncertainty in the simulation results may stem from the sparse distribution of meteorological stations within the basin, with only four stations covering an area of 13,848 km2.
Table 7.
List of sensitive parameters used for model calibration.
Moreover, these stations are positioned at locations that do not adequately represent the geographical characteristics of the basin. The average elevation of the basin is 469 m asl (ranging from 0 to 1983 m asl). The stations were located lower than the average basin elevation. However, the calibration and validation results indicated that the SWAT model could effectively simulate flow in the Ba River basin. The SWAT model has been used successfully for hydrological assessments of water resource management, even in cases of data scarcity, such as in the Brahmaputra River basin (Dutta, Sarma 2021).
These findings further underscore the potential of the SWAT model in tropical basin contexts, despite data limitations. Since the model does not include water exploitation in the basin, the simulated discharge represents natural flow. This study is the first to use a spatial dataset for the SWAT model, comprising DEM data from the ASTER’s web, land cover data from the CCI program, and a soil map from the FAO. The calibration and validation results indicate that these data inputs are suitable for use in SWAT models for tropical river basins. Therefore, this spatial dataset can support investigations for integrated water resource management in river basins that lack sufficient data for calculating water resource allocation. To assess the effects of climate change on runoff in the basin, this study considered the existing hydropower stations in the basin during the period 2001-2020. The predicted monthly discharge values for the periods 2021-2040, 2041-2060, 2061-2080, and 2081-2100 under the four scenarios (SSP1-2.6, SSP2-4.5, SSP3-7.0, and SSP5-8.5) are shown in Figure 8. The changes in annual, low-flow season, and flood-season discharges for these periods, compared to the baseline period of 1981-2000, are shown in Table 8. Using the baseline period of 1981-2000, this study calculated and compared surface runoff changes at hydrological stations under climate change scenarios. The predicted annual discharge at the An Khe station decreased by 30.2% to 39.0%, the low-flow season discharge decreased by 68.0% to 85.2%, and the flood-season discharge decreased by 6.1% to 17.3% compared to the baseline period. At the Cung Son station, the predicted annual discharge varied between –4.0% and +15.6% from baseline, with a tendency for flood-season discharge to increase by 32.0% to 57.9%, and low-flow season discharge to decrease by 86.7% to 98.6% compared to the baseline period.
Table 8.
Changes in annual, flood-season, and low-flow season discharges (%) compared to the period 1981-2000.
Fig. 8.
Projected monthly discharge for the periods 2021-2040, 2041-2060, 2061-2080, and 2081-2100 under the four scenarios of SSP1-2.6, 2-4.5, 3-7.0, and 5-8.5 at (a) the An Khe and (b) the Cung Son stations.
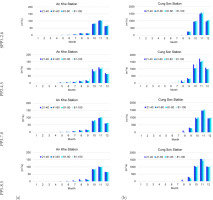
The predicted discharge in the lower basin exhibited more complex variation than the upper basin. This study found that both annual and seasonal discharge trends tended to decrease in the upper area, while in the lower basin, the flood season showed an increasing trend, and the low-flow season showed a decreasing trend compared to the baseline period. By the end of the 21st century (2081-2100), discharge in both the upper and lower areas is predicted to decrease during the low-flow season, indicating that tropical river basins, like the Ba River basin, may face significant risks of water shortages during the low-flow season by the century’s end. The impacts of climate change will significantly affect future water resource allocation in such regions.
Several studies have examined the impacts of climate change on river flow in various watersheds globally; however, research on the effects of climate change specifically during low-flow seasons remains limited. In the Meuse Basin in Northwest Europe, for instance, climate change is projected to reduce discharge during the low-flow season (de Wit et al. 2007). As discussed earlier, the low-flow season in tropical river basins typically lasts twice as long as the flood season, yet the water volume during this period accounts for less than half of the flood season’s discharge. If the water volume during the low-flow season continues to decrease, it will present numerous challenges for water use within the basin. Under high-emission scenarios, by the end of the 21st century, the volume of water in the low-flow season is expected to decrease even further. This suggests that meteorological and hydrological factors are not only highly variable seasonally but also fluctuate significantly over time. The irregular distribution of rainfall and runoff presents considerable challenges for water resource management in tropical river basins. The results from this study provided a scientific basis for developing water use plans in order of priority for tropical river basins.
4. Conclusions
The research results indicate that climatic factors, such as temperature and rainfall, along with runoff in tropical river basins, exhibit complex variations. Ten out of 30 hydrometeorological data series for the period 1981-2020 were found to be heterogeneous. An increasing trend was identified only in the annual average temperature data series for all four meteorological stations. Projected variations in maximum and minimum temperatures were found to be complex, with predicted annual rainfall decreasing in the upper basin and increasing in the lower basin toward the end of the century under SSP climate change scenarios.
The spatial dataset, including DEM (ASTER30), land cover (CCI), soil (FAO), and data from four meteorological stations, was constructed for the SWAT model. The calibration and validation results confirmed that the SWAT model and the input dataset construction methods are suitable for tropical river basins. The study also successfully integrated the land cover map (CCI) and the soil map (FAO) into the SWAT model using appropriate conversion methods. The results indicate a projected decrease in discharge during the low-flow season, signaling a worsening of water shortages in the Ba River Basin. These findings are particularly significant, as the observed trends suggest a future decline in surface water resources during the dry season in an area already experiencing water stress, underscoring the urgent need for a robust adaptation strategy supported by reliable drought monitoring and forecasting systems . This study has developed a framework for evaluating climate change impacts on water resources in tropical basins with sparse observational data. Although the results are valuable, the accuracy of the simulations could be improved with a denser observational network. The study relied on projections from a single GCM; future research should explore multi-model ensembles to enhance the robustness of climate change impact assessments in tropical river basins.

