1. Introduction
Fluctuations in temperature and precipitation are widely recognized as relevant indicators of global climate change and variability (IPCC 2021). Anthropogenic activities that increase greenhouse gases cause temperature increases and regional changes in mean climate, resulting in climate extremes in various parts of the world (IPCC 2023). In West Africa, several studies, including in Nigeria (Gbode et al. 2019), Mauritania, Guinea, Côte d'Ivoire, Senegal, Mali, and Niger (Barry et al. 2018), have observed these changes. Sylla et al. (2015) add that the increase in the intensity of very wet events, particularly in the pre- and early monsoonal periods, will be more marked over the Sahel and under Representative Concentration Pathway (RCP) 8.5 than in the Gulf of Guinea under RCP 4.5. Urban areas will also be affected by climate extremes in West Africa (Herslund et al. 2015), which is a major concern.
African cities are experiencing an unprecedented increase in the rate of urbanization. Between 1990 and 2022, 500 million people are expected to move to urban centers in Africa (OECD 2022). By 2050, Africa's urban population is expected to reach 1.06 billion (Ezeh et al. 2020). This demographic growth will increase the impact of climate extremes on urban populations. Extreme precipitation caused flooding in Dar es Salaam on 22 December 2011, resulting in 20 deaths, extensive damage, and loss of livelihoods (Giugni et al. 2015). The same happened in Lagos, Nigeria (Doan et al. 2023) and Dakar, Senegal (Diémé et al. 2025). In Burkina Faso, the situation is no better than in other West African countries. The country is experiencing an increase in precipitation and extreme temperature indices in the north, Boucle du Mouhoun, and southwest regions (Rouamba et al. 2023; Yaméogo, Rouamba 2023a; Yanogo, Yaméogo 2023; Yaméogo 2024; Yaméogo, Sawadogo 2024; Yaméogo 2025), with dramatic consequences for the population (Yaméogo, Rouamba 2023b). In this context, (Gimeno et al. 2022) note that the increase in urban populations associated with climate change makes societies increasingly vulnerable to extreme precipitation.
A few studies have examined extreme precipitation trends and projections. For example, the work of Rouamba et al. (2023) in the municipality of Boromo, in the south of Burkina Faso (Sougué et al. 2023), and in ten cities in Burkina Faso addressed the issue of trends and forecasts of climatic extremes in recent years. Several statistical methods, especially approaches based on the classical theory of extremes (peak-on-threshold) and linear regression models, have been used by various authors to understand the spatiotemporal trends in climate extremes (Béwentaoré, Barro 2022; Rouamba et al. 2023). Parametric regression models have also been used to predict future extreme events using CMIP6 data (Koala et al. 2023). These studies do not account for trends and seasonality of the time series of climate extremes, which can bias trends and forecasts of precipitation extremes.
Several other advanced forecasting methods are reported in the literature, including the Holt-Winters smoothing method, which accounts for trend and seasonality (Nurhamidah et al. 2020). This method has advantages, such as reducing the weight of historical data, and simplicity. Therefore, it has been used in several studies in the field of climatology (Gundalia, Dholakia 2012; Gowri et al. 2022; Bhagat, Ramaswamy 2023). This prediction method can make valuable contributions to understanding future trends and impacts of climate change (Pala, Şevgin 2024). The method thus forms the basis of statistical modeling for climate prediction in the region. The general objective of this study is to analyze the evolution of extreme precipitation indices and their projection from 2020 to 2030 using non-parametric smoothing and Holt-Winters methods in three cities in Burkina Faso. The secondary objectives of this study are to:
2. Materials and methods
2.1. Study area
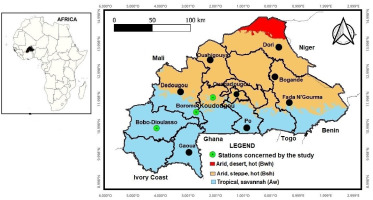
The study areas are in Burkina Faso, West Africa (Fig. 1). Three cities are considered in the study: Bobo-Dioulasso, in the urban commune of the Houet province in the Hauts Bassins region. These cities vary in physical characteristics. The soils of Koudougou, Burkina Faso, are varied. They include leached tropical ferruginous soils, often poor in organic matter and nutrients, and lithosols on cuirass, better suited to grazing. Hydromorphic soils are also found along watercourses, which are favorable to certain crops. The area is affected by soil degradation, with a widening of the Sahel and a decline in vegetation. The soils in Boromo, Burkina Faso, are diverse and include cuirass, hydromorphic, and tropical ferruginous soils. These soils have various properties influenced by their origin and environment. Some are suitable for agriculture, while others are susceptible to erosion. The soils of Bobo-Dioulasso, Burkina Faso, are mainly characterized by ferralitic soils, tropical ferruginous soils, and eutrophic brown soils. These soils result from weathering of Birrimian rocks and vary according to relief and topography. In human terms, the study towns have different populations. Bobo-Dioulasso is the second-largest city in Burkina Faso, covering an area of 1,805 km2. Its population is >900,000. Koudougou is a medium-sized town, Burkina Faso's third-largest city. Its population has been particularly dynamic in recent decades. Its urban population has more than quadrupled over the past few decades, from 36,838 in 1975 to 88,184 in 2006 and 160,239 in 2019 (Sirven 1987; INSD 2011). Boromo is one of the country's smaller towns. Its urban population is estimated at 20,193 (INSD 2011). Unlike other towns, Boromo is facing an influx of people fleeing terrorism in the north of the country. This situation makes the small town of Boromo vulnerable and exacerbates social problems (Yaméogo et al. 2022).
These three towns were selected based on three criteria: the availability of rainfall data over a given period, the degree of missing data over a given period, and the size of the population potentially affected by extreme rainfall. The populations of these towns have increased considerably as a result of the security crisis in the northern, eastern, and Boucle du Mouhoun areas.
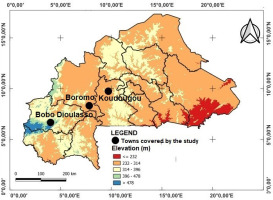
The topography varies throughout the region. The towns studied have altitudes ranging from 232 to 314 to >478 m (Fig. 2).
2.2. Data and methods
Daily precipitation data were obtained from the National Meteorological Agency of Burkina Faso for 1991-2020 (Table 1). One station was selected for each of the three towns. The Saria station represents the town of Koudougou, the Boromo station the city of Boromo, and the Bobo-Dioulasso station the city of Bobo-Dioulasso.
Table 1.
Characteristics of the selected stations
Daily precipitation data were fed into Rclimdex, which produced extreme precipitation indices for the period 1991-2020, representing precipitation intensity, precipitation frequency, and precipitation duration. RClimDex provides a user-friendly graphical interface for calculating the 27 basic indices recommended by the CCl/CLIVAR Expert Team on Climate Change Detection, Monitoring and Indices (ETCCDMI) (Karl et al. 1999; Zhang, Yang 2004). In the present study, 10 indices were selected (Table 2).
Table 2.
Extreme precipitation indices used in the study. Source: Lourdes et al. (2021).
The data projections for the 10-year period (2020-2030) were based on the extreme precipitation indices extracted from the daily data using Rclimdex. The temporal data for the extreme precipitation indices were processed in XLSTAT 2019 using the Holt-Winters method.
2.2.1. Mann-Kendall Test
It is a non-parametric test and there is no requirement that the data must be normally distributed (Oufrigh et al. 2023). In this test, H0 is the null hypothesis, which states that the data come from a population whose observations are independent of each other and are uniformly distributed , and the alternative to H1, which states that the data have a monotone tendency (Aditya et al. 2021). These test values (Xj – Xk) where j > k and the test statistic S is calculated by applying the formula (Shah, Kiran 2021):
With, Xj and Xk are the annual values for years j and k, j > k, respectively.
The sgn function is calculated as follows:
The test statistic, τ, can be calculated as follows:
In order to statistically quantify the significance of the trend, it is necessary to calculate the probability associated with S and the sample size n. The formula to calculate the variance S is as follows:
Where q is defined as the number of linked groups and tp is defined as the number of data items in the pth group. The values of S and Var(S) are used for the calculation of the test statistic Z, which is:
The null hypothesis h0 (no trend) is rejected if the significance level or p-value is >5%.
2.2.2. Innovative trend analysis method (ITAM)
This technique, introduced by Şen (2017), or referred to as new trend analysis (Sezen, Partal 2020), is non-parametric and its use does not require a normal distribution of observations (Şen et al. 2019; Mallick et al. 2021). It is a very useful tool for detecting trends in precipitation time series data (Pastagia, Mehta 2022; Patel, Mehta 2023). In addition, the ITAM is more sensitive in determining the trend than the Mann-Kendall (MK) test (Mohorji et al. 2017; Sanusi, Abdy 2021; Kessabi et al. 2024). In ITAM, the data series is divided into two equal parts such that (Dabanlı et al. 2016; Mohorji et al. 2017; Şen et al. 2019; Marak et al. 2020; Kougbeagbede 2024; Muthiah et al. 2024).
Mathematically, the procedure of the method is translated as follows (Güçlü 2020): • Any data consisting of n data, a1, a2, ..., an is separated into two equal series {b1, n/2} and {b2, n/2}, such as:
{b1, n/2} = {a1, a2, ..., an/2} (6)
and
{b2, n/2} = {an/2+1 + an/2+2, ..., an} (7)
• Each series with the same number of elements is then listed in ascending order. The series is named as follows: {S1}, et {S2}, with:
{S1} = {min(b1, n/2), …, bj, …, max(b1, n/2)} (1≺i≺n/2) (8)
and
{S2} = {min(b2, n/2), …, bj, …, max(b2, n/2)} (1≺i≺n/2) (9)
The {S1} data on the horizontal axis are plotted against the values of the following series: 1, 2, 3, ..., (n/2) -1, n/2.
The data for {S2} are on the vertical axis according to the values: 1, 2, 3, ..., (n/2) -1, n/2.
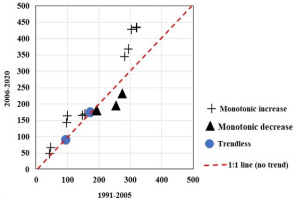
According to Mandal et al. (2021), each series is then sorted independently in ascending order. The first half of the series (Xi) is plotted on the X axis and the second half of the series (Yi) is plotted on the Y axis. The presence of a trend is indicated by a 1:1 (45°) line in the scatterplot. The presence of a trend is indicated by a 1:1 (45°) line in the scatterplot. Coordinates on the 45° line indicate no trend, below it a negative trend, and above it an upward trend (Dabanli et al. 2016; Almazroui et al. 2019; Chowdari et al. 2023; Yaméogo 2025). A detailed interpretation of the ITAM is given in Figure 3 below, based on data from the present study at the Bobo-Dioulasso station.
2.2.3. Slope (S) of ITAM
The slope trend S is calculated using the following expression (Şen 2017):
Where,
2.2.3. The Percentage Bias Method (PBM)
The percentage bias method was used to estimate the percentage change in precipitation in the second half of the time series compared with the first half (Mandal et al. 2021):
Where PBM is the percentage bias, n is the total extent of the sub-series separately, Xi and Yi are the values of the observation data in the first and second sub-series, respectively. Positive and negative PBM values indicate increasing and decreasing trends, respectively, for the first sub-series.
2.2.4. Holt-Winters exponential smoothing model
The Holt-Winters method, which allows the seasonal model to adapt over time, is one of the best-known forecasting techniques (Lawton 1998). It involves estimating three smoothing parameters associated with level, trend, and seasonal variables (Atoyebi et al. 2023). Designed for trend and seasonal time series, the Holt-Winters method is a commonly used tool for forecasting trade data containing seasonality, changing trends, and seasonal correlation (Gelper et al. 2010). Several studies (Irwan et al. 2023) have also used this method to forecast hydro-climatological data series. The Holt-Winters approaches are modeled in one of two ways: additive or multiplicative (Koehler et al. 2001; Thomasson 2017; Natayu et al. 2022).
2.2.5. Holt-Winters seasonal additive model
The Holt-Winters additive method, which has a linear trend and constant seasonal variation (additive), has a prediction composed of the level (Lt), trend (bt), and seasonal variation (st) (Puah et al. 2016). The additive model incorporates seasonality but with the addition of a trend as follows (Pertiwi 2020; Wiguna et al. 2023):
• Level:
Lt = α(Yt − st−c) + (1 − α)(Lt−1 − bt−1) (12)
• Trend:
bt = β(Lt − Lt−1) + (1 − β)bt−1 (13)
• Seasonal:
st = γ(Yt − Lt) + (1 − γ)st−c (14)
The prediction for period Ft+m is:
Ft+m = Lt + btm + st−s+m (15)
The smoothing parameters, α, β, and γ have values that vary between 0 and 1. In this study, the parameters are fixed at 0.2. This means that the prediction is flexible, i.e. strongly influenced by the most recent observations.
2.2.6. Multiplicative Holt-Winters method (MHW)
The multiplicative model is used if the data show variable seasonal fluctuations, and the different equations are as follows (Pleños 2022; Irwan et al. 2023; Wiguna et al. 2023):
• Level:
• Trend:
bt=β(Lt−Lt−1)+ (1−β)bt−1 (17)
• Seasonal:
The prediction period t is :
St = Ft+m = (Lt + btm)St−s+m (19)
The smoothing parameters, α, β, and γ have values that vary between 0 and 1. In this study, the parameters are fixed at 0.2. This means that the prediction is flexible.
Where, Yt – level in the 2nd period t; Lt-α – level in the 2nd period t-1; bt – trend in the 2nd period t; bt-1 – trend in the 2nd period t-1; St – seasonality in the 2nd factors; Yt – data in the 2nd period t; s – seasonal period; t – seasonal period; m – predictive time period.
2.2.7. Analysis of the Holt-Winters model performance
Goodness of fit is a critical criterion for assessing the accuracy of a predicted model relative to the true value (Atoyebi et al. 2023). Mean error (ME), MSE (mean squared error), RMSE (root mean squared error) and MAPE (mean absolute percentage error), mean absolute deviation (MAD), and mean squared deviation (MSD) have typically been used to examine model performance (Pinel 2020; Atoyebi et al. 2023). Other valuation parameters are also considered, such as the mean square error (MSE), the root mean square error (RMSE), and the mean absolute error (MAE). However, the use of MAD and MSD as indicators of prediction accuracy can be problematic in that they do not facilitate comparisons between different time series or time intervals, and the absolute measures MAD and MSD are affected by the size of the time series data (Atoyebi et al. 2023). The statistics MAD and MSE, provide no guidance on whether the model is good or not. This makes it impossible to use both measures (Gundalia, Dholakia 2012). Therefore, MAPE is used in studies as a valid indicator of model performance (Gundalia, Dholakia 2012; Puah et al. 2016). MAPE is also used in this study. MAPE consists of dividing the absolute error of each period by the true value of that period and calculating an average percentage of absolute errors (Wiguna et al. 2023). The mathematical formula used to calculate MAPE is as follows (Wiguna et al. 2023):
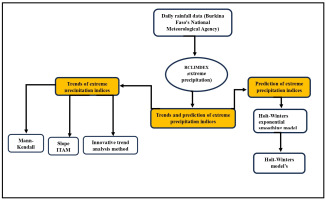
With, At – actual data; Yt – forecasting data; n – number of periods. Prediction performance is interpreted using a prediction rating scale (Table 3). A summary of the methods used in the study is presented in Figure 4.
Table 3.
Prediction model performance assessment scale (Gowri et al. 2022; Pinel 2020).
3. Results
3.1. Descriptive statistics and test of extreme precipitation indices between 1991 and 2020
Table 4 shows that the extreme precipitation indices are highly variable for the Bobo-Dioulasso and Boromo stations and moderately variable for the Saria station over the period 1991-2020. The variability is particularly high for indices such as: r99ptot, r95ptot, cwd, R20mm, and Rx1day. Furthermore, the descriptive statistics show that the maxima and minima are relatively higher at the Bobo-Dioulasso station than at the other stations (Boromo and Koudougou). This difference could be explained by the climatic range of the stations. The Bobo-Dioulasso station is in the Sudanese zone (with precipitation of more than 900 mm per year). On the other hand, the other stations have low annual precipitation, which varies between 600 mm and 900 mm.
Table 4.
Descriptive statistics for extreme precipitation indices from 1991 to 2020.
3.2. Trends in the indices of extreme precipitation between 1991 and 2020: an analysis using the Mann-Kendall test
The Mann-Kendall test shows that there was no trend in the extreme precipitation indices in the three cities of Burkina Faso over the period 1991-2020 (Table 5). The fact remains that a trend was observed for the frequency index (r99ptot) in the Bobo-Dioulasso station.
Table 5.
Trend in extreme precipitation indices using the Mann-Kendall test.
3.3. Trends in the indices of extreme precipitation between 1991 and 2020: an analysis using the innovative trend method
The innovative template trends method shows clear trends in the precipitation extremes indices according to the study stations.
3.3.1. Trends in the indices of extreme precipitation in the city of Bobo-Dioulasso
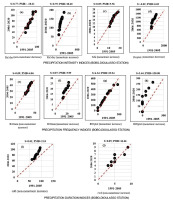
At this station, especially in the city of Bobo-Dioulasso, the precipitation intensity indices are increasing for prptot, rx5day, and sdii; rx1day decreased non-monotonically. For the extreme precipitation frequency indices, the trends are non-monotonic for r20mm, r10mm, and monotonic for r95ptot and r99ptot.
Conversely, the duration indices (cdd and cwd) are non-monotonic. Figure 5 summarises the trends of the extreme precipitation indices for the city of Bobo-Dioulasso over the period 1991-2020.
Figures 5b, 5c, and 5d, which group together precipitation intensity indices, show increases, in contrast to Figure 5a. The same applies to precipitation frequency indices. Figures 5f, 5g, and 5h, (but not 5e), are also increasing over the period 1991-2020. For the precipitation duration index, Figure 5i shows an increasing trend, while Figure 5j shows a non-monotonic increasing trend. The trends in extreme precipitation are increasing overall, and this situation could be explained by the climatic range in which the Bobo-Dioulasso station is located. The station is in the Sudanian zone, with annual precipitation in excess of 900 mm.
3.3.2. Trends in the indices of extreme precipitation in the city of Boromo
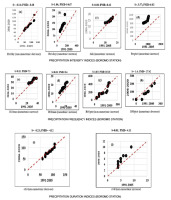
Figure 6 shows the graphical trends at the Boromo station in the town of Boromo. The precipitation intensity indices (Fig. 6b, 6c, 6d) increase monotonically. The precipitation frequency indices (Fig. 6e, 6f, 6h) are also increasing, with the exception of Figure 6g, which shows a non-monotonically increasing trend. In addition, the trends are non-monotonically decreasing in Figure 6i and non-monotonically increasing in Figure 6j.
3.3.3. Trends in the indices of extreme precipitation in the city of City of Koudougou
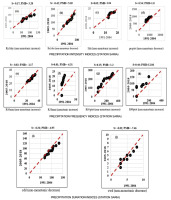
The graphical trends of the extreme precipitation indices for the Saria station are more non-monotonic (Fig. 7). Extreme precipitation at the Saria station (city of Koudougou) shows unclear, even decreasing trends for precipitation duration indices, unlike the other two stations studied. This situation could be explained by the station's location in the Sudano-Sahelian region, where precipitation varies between 600 mm and 900 mm per year.
3.4. Future projections of extreme precipitation indices for cities in Burkina Faso from 2020 to 2030
It is necessary to assess the performance of the Holt-Winters model to analyze the predicted precipitation indices for the three cities. Two models, additive and multiplicative, were used to assess the accuracy of the models proposed for each station. The prediction period is 10 years, specifically 2020-2030.
3.4.1. The case of the city of Bobo-Dioulasso (Bobo-Dioulasso station)
Table 6 shows that the additive Holt-Winters model is more accurate than the multiplicative Holt-Winters model based on the MAPE results. Nevertheless, the additive model does not fit R95ptot and R99ptot very well, with values of 86.05 and 73.7, respectively, indicating poor predictive ability of the model for these two indices. However, this model is more appropriate for the other extreme precipitation indices. This disparity leads to the use of the Holt-Winters additive model to analyze the future evolution of the extreme indices.
Table 6.
Results of the evaluation of the Holt-Winters additive and multiplicative models for the Bobo-Dioulasso station.
3.4.2. The case of the city of Boromo (Boromo station)
The performance of the additive and multiplicative models, according to MAPE, shows better accuracy for the additive model compared to the multiplicative model (Table 7). However, as at the Bobo-Dioulasso station, the additive model does not correctly adjust indices such as r95ptot and r99ptot.
Table 7.
Results of the evaluation of the Holt-Winters additive and multiplicative models for the Boromo station.
3.4.3. The case of the city of Koudougou (Saria station)
As with the two stations above, the extreme precipitation index data applied to the additive and multiplicative models shows that the additive model provides a better fit for the extreme precipitation indices at the Saria station (Table 8).
Table 8.
Results of the evaluation of the Holt-Winters additive and multiplicative models for the Boromo station.
3.5. Projection trajectories between 2020 and 2030 for extreme precipitation indices
Because the additive model is a better fit to the extreme precipitation index data from the study stations, this model is adopted for future predictions for the period 2020-2030. In addition, the fit of the model varies between the study stations. Therefore, the analyses are based on the study stations.
3.5.1. The case of the city of Bobo-Dioulasso (Bobo-Dioulasso station)
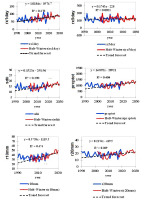
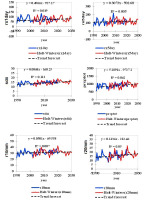
The results of the predictions for the 2030 period show that the precipitation intensity indices (rx1day, r5day, sdii, and prcptot) and the precipitation frequency indices (r10mm, r20mm, r95ptot, r99ptot) will increase between 2020 and 2030. The situation is different for the precipitation duration indices, with CDD steadily increasing until 2030 and CWD decreasing over the same period (Fig. 8). In the figure, blue indicates observed precipitation extremes, and red lines indicate the Holt-Winters prediction of precipitation extremes. The dotted green line indicates the trend. The figure shows that the indices rx5day and cwd display downward trends until 2030. On the other hand, the other indices (rx1day, sdii, prcpot, r10mm, r20mm, r95pot, r99pot) show increasing trends until 2030. Given this situation, flooding and water-borne diseases are likely to be a problem in the city in the coming years.
3.5.2. The case of the city of Boromo (Boromo station )
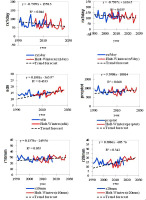
At this station, precipitation intensity and duration indices are increasing (Fig. 9). However, the precipitation frequency indices show different trends. R10mm and r99ptot decrease, while r20mm and r95ptot increase from 2020 to 2030.
3.5.3. The case of the city of Koudougou (Saria station)
The precipitation intensity indices show different trends. In fact, rx1day and rx5day are decreasing, while sdii and prcptot increase continuously from 2020 to 2030. The same is true for the precipitation frequency indices, which show a decreasing trend for r10mm, r95ptot, and r99ptot. The only frequency index that increases is r20mm. In addition, the precipitation duration indices increase from 2020 to 2030. The city of Koudougou should suffer less from climatic disasters than the other two cities, in the sense that intensity and frequency are low over the period 2020-2030. However, the increase in precipitation duration will be detrimental to farmers on the outskirts of the city and urban market gardeners. Figure 10 shows the changes in extreme precipitation indices from 2020 to 2030. The figure shows that two forecast trends are also noticeable at the Saria station. In contrast to the other stations, the forecast trends are more negative than positive. The downward trends are represented by Figure 10 (rx1day), (rx5day). Conversely, Figure 10 (sdii), (prcptot), (r20mm), and (cdd) shows upward trends. Thus, the city of Koudougou may be less affected by extreme precipitation than the other two cities of Bobo-Dioulasso and Boromo.
4. Discussion
4.1. Analysis of inter-annual variability and trends in extreme precipitation indices in West Africa
Time series are records of processes that change over time (Ihaka 2005). This study has shown strong variability in extreme precipitation indices at the three study stations. In addition, the extreme precipitation indices showed a continuous increase from 1991 to 2020. The results confirm the work of other authors in Burkina Faso and West Africa (Bigi et al. 2018). Indeed, extreme precipitation indices such as rx1day, rx5day, prcptot, and sdii increased and r95ptot decreased from 1991 to 2021 in the Boucle du Mouhoun region of Burkina Faso (Rouamba et al. 2023). Yanogo and Yaméogo (2023) also note that indices such as prcptot and r95ptot are increasing for the Ouahigouya station in Burkina Faso. These results are confirmed by the study of Tazen et al. (2019) in Burkina Faso, which showed an upward trend in indices such as Rx1day, Rx5day, and r99ptot from 1961 to 2015. This trend has also been observed in other West African countries by various authors. In Niamey, Niger, the same indices (rx1day, rx5day, prcptot) also increased between 1990 and 2020 (Bassirou et al. 2023). Bigi et al. (2018) add that a similar trend was observed in Niamey city (Niger) between 1980 and 2009. This confirms the studies by Konate et al. (2023) in Côte d'Ivoire during 1961-2015. Indeed, the authors note that indices such as prcptot, sdii, rx1day, rx5day, r20mm, r95ptot, and r99ptot increased in Ivorian cities (Gagnoa, Daloa, Yamoussoukro), while cdd and cwd decreased between 1961 and 2015. In other cities (Korhogo, Odienné, Bondoukou, Man, Abidjan, Adiaké, San-Pedro, Tabou, Sassandra), indices such as prcptot, sdii, CDD, CWD, R10mm, and R20mm show significantly negative trends (Konate et al. 2023). The exception is San-Pedro, which shows significantly positive trends for the prcptot, sdii, CDD, and R10mm indices. This situation shows that when the zones are located in the Ivory Coast's Sudanese-type climate, the trends of the indices are negative. On the other hand, when the zones are located in the Baulean-type climate zones, the extreme precipitation indices tend to show positive trends overall. Furthermore, in the Attean climate, the precipitation indices are positive overall. It is therefore clear that the trends vary according to the climatic zone, a situation that is also revealed by the results of the zones studied using the innovative method.
4.2. Analysis of the predictions of the extreme precipitation index
Forecasting precipitation is important for two reasons: it is a major scientific challenge, but it is also crucial for planning and developing agricultural strategies (Graham, Mishra 2017). In the study cities, precipitation intensity and frequency indices are expected to increase between 2020 and 2030 in the large city of Bobo-Dioulasso, the medium-sized city of Koudougou, and the small city of Boromo. However, the city of Koudougou should be less affected than the other two cities, as many extreme indices such as cdd, r95ptot, r99ptot, r10mm, rx1day and rx5day will decrease continuously until 2030. These results are consistent with those for Africa (Abiodun et al. 2017). Indeed, the authors note that coastal cities will experience an increase in extreme precipitation indices, with cities such as Maputo, Logos, and Port Said expected to experience an increase in the intensity and frequency of extreme precipitation between 2081 and 2100. Other authors, such as Biasutti (2013) and Trepekli et al. (2019), note that precipitation is expected to be concentrated in more intense extreme precipitation events, interspersed with long periods of low precipitation over the West African Sahel. Another study conducted in Africa by Habiyakare et al. (2024) confirms the findings of the previous authors. In fact, according to these authors, West Africa, East Africa, and the eastern part of South Africa show an increasing trend in extreme precipitation, and changes in extreme precipitation indices show a general increase in the occurrence and frequency of extreme precipitation indices in all scenarios by the end of the 21st century.
4.3. The sources of uncertainty and limitations of the methods
Precipitation in Burkina Faso tends to be erratic from month to month and season to season. This makes it difficult to make accurate forecasts. The Holt-Winters exponential smoothing method is therefore used in this study. This method has clear advantages because it accounts for trends and seasonality (Pongdatu, Putra 2018), which corresponds to the characteristics of precipitation in the tropics. This situation has led other authors (Pertiwi 2020) to use this method in the tropics. However, this method has shortcomings that need to be considered. The method is deterministic because for each point in the future, the forecast provides a single value that approximates the future outcome. It does not allow other possibilities to be considered. In addition, exponential smoothing forecasting techniques only consider historical data, which means that they ignore any information that may be generated at the same time (Pardoux, Goldfarb 2013). Pinel (2020) adds that the Holt-Winters method has three major shortcomings: first, there is no guarantee that the method is optimal for a given data series; exponential smoothing methods are sometimes far from optimal. In addition, forecasts are more accurate in the short term (a few years). On the other hand, they cannot provide forecast intervals, i.e. an interval containing the forecast with a given probability. This is because a probabilistic framework has not yet been defined. Thus, the results of the forecasting study are limited. Indeed, if the period considered is intermediate (2020-2030), the forecasts of the Holt-Winters method become less accurate as the time considered is extended. In this study, therefore, the forecast for the first five years (2020-2025) is more accurate than that for the remaining five years (2025-2030). In addition, the data analysis is done with software that only allows models of deterministic precision as mean square error, and the choice of parametric models is limited to 0.2 α, β, and γ. These constraints do not allow for any flexibility in the accuracy of the forecasts. Nevertheless, our results provide decision-makers with an indication of the evolution of extreme precipitation indices over the period 2020-2030, with greater accuracy between 2020 and 2025, given the short-term option of the forecasting method.
5. Conclusions
The study analyzed the trends and projected trajectories of extreme precipitation indices in the cities of Burkina Faso. The precipitation intensity and frequency indices are variable, with an upward trend for the cities of Bobo-Dioulasso, Boromo, and Koudougou. Template trends also show a steady increase in precipitation intensity and frequency indices for the cities of Bobo-Dioulasso and Boromo. For the city of Koudougou, a non-monotonic increasing trend is observed for the precipitation intensity and frequency indices. The rain duration indices show a non-monotonic decreasing trend. The Holt-Winters method can be used to make short-term predictions. This method was used to predict extreme precipitation indices between 2020 and 2030, which are increasing for the intensity and frequency indices in the cities of Bobo-Dioulasso and Boromo. However, the indices have relatively high variability, accompanied by an upward trend over the period 2020-2030. Under these conditions, the authorities in the affected towns should give absolute priority to widening the gutters to allow rainwater to drain away. In addition, the town of Boromo is in a special situation compared to the others, since its population has increased in response to internal migration caused by terrorism in the country. The migrants have settled in flood-prone areas, and the local authorities should encourage them to move away from easily flooded areas.

