1. Introduction
Solar radiation is characterized by high availability, stability, and thus is the least risky renewable energy source (RES) from an economic perspective (Mierzwiak et al. 2022; Liu et al. 2023; Kapica et al. 2024). Variability and uncertainty are the most difficult parameters to account for when evaluating the solar radiation potential. Variability is determined by processes associated with changes in the state of the atmosphere and the radiation balance of the Earth's surface. Uncertainty indicates the difficulty of forecasting when using various models of behavior of the object under study. There is a limit to the maximum production of electricity (heat), which changes over time and is difficult to predict (uncertainty). As power generation from RES penetrates further into the global energy system, it is necessary to provide accurate forecasts of solar energy potential to avoid the consequences of changing the parameters of the energy system and to ensure appropriate control.
Rational volume-planning, plasticity, and color scheme of facades make it possible to make maximum use of solar radiation to increase the comfort of the indoor environment. Sun protection of insulated facades prevents temperature deformation of the surface structure and stabilizes the temperature regime of the premises (Ujma 2014; Sadooghi, Kherani 2019). Climatological characteristics are used when performing energy calculations and drawing up energy passports and audits, as well as when designing heating and ventilation systems.
The climate of Ukraine has changed significantly in recent years (Lipinskyi et al. 2003; Murtazinova 2009; Voloshina, Kuryshina 2010; Rybchenko, Savchuk 2015; Lopushanska, Iwanow 2022). Existing standards (DSTU-NBV.1.1.-27:2010) need clarification for the development of engineering and architectural solutions for the energy efficiency of buildings. The DSTU-NBV.1.1.-27:2010 introduced climatic zoning of the territory of Ukraine. But the climate has changed in the past ten years, requiring that climate data in the standard documents be clarified.
In recent years in Ukraine, the duration of sunlight, as well as direct, scattered, and total solar radiation, have changed. However, a significant increase in the duration of sunlight and direct solar radiation in combination with a simultaneous decrease in diffuse radiation did not contribute to the growth of total radiation (Rybchenko, Savchuk 2013).
When designing installations that use solar energy, it is necessary to account for the spatio-temporal change in the distribution of solar radiation, which depends on astronomical and meteorological factors , i.e., the geographical latitude and the height of the sun, as well as the transparency of the atmosphere. Weather conditions in Ukraine depend on the large-scale circulation of the atmosphere over the northern hemisphere and regional features. The eastern regions of Ukraine are located on the axis of the extratropical maximum (Zubkovich 2013). This axis passes through Ukraine from the southwest to the northeast. One of the signs of modern climatic changes is a noticeable weakening of wind speed over Ukraine, which causes changes in synoptic characteristics. A predominance of significant baric gradients was observed over eastern Ukraine. A comparative analysis of the variability of average daily air temperature and daily precipitation in the winter season in Kyiv, in relation to the change in global temperature in the 20th century, is provided in Murtazinova (2009). That study analyzed data for 1910-2002, showing an increase in the variability of the average daily temperature in December and a sharp decrease in the inter-day variability in January and February.
Solar radiation varies depending not only on geographical latitude, but also on regional climatic conditions. Thus, in Precarpathia and the Ukrainian Carpathians, the solar energy potential (SEP) is 1400-1500 MJ/m2. In the summer, in the north of Ukraine, SEP is 1550-1800 MJ/m2, and in the eastern and central regions SEP is 1850-950 MJ/m2, increasing in the southern regions to 2000-2150 MJ/m2 (Dmytrenko, Barandich 2007). When designing solar power plants, comprehensive indicators of the potential of solar energy are required (Dmytrenko, Barandich 2007; Rybchenko, Savchuk 2015), which are not measured widely enough in Ukraine. Therefore, it is necessary to develop methods for designing engineering systems and developing architectural solutions.
Analytical expressions for calculating specific solar heat fluxes for clear sky conditions depending on geographic latitude, inclination, time angle, and angle of inclination of the solar collector plane are given in Ozarkiv et al. (2007). The values of hourly direct and scattered radiation for the conditions of the city of Lviv (50° north latitude) are given. In Halchak et al. (2019), the results of modeling the parameters of the direct flow of solar radiation under a clear sky, accounting for the transparency of the atmosphere, are indicated. Average monthly values of the hourly change in the intensity of direct solar flux are used in the calculations.
Rybchenko and Savchuk (2015) and Dmytrenko and Barandich (2007) show the results of zoning based on a set of indicators of solar energy potential, duration of sunshine, and cloudiness. Average monthly values of solar radiation are determined using the NASA SSF database obtained from satellites. At the same time, data for the past five-year period are necessary to estimate the potential of solar energy (Madesh, Sandhu 2015). The NASA SSF database contains data for the period of 1983-2005. Measurements are made at more than 1,000 weather stations in various places around the world. Calculations are performed for a grid of 2.5 × 2.5 degrees of the earth's surface, thus the results are less accurate than those measured at weather stations. Methods of computer modeling and calculation of solar inflows were developed by Sergeychuk (2011) for non-standard solutions of enclosed structures using a point calculation device. The formation of the regime of solar heat gain from both direct solar rays and diffuse radiation in a building of complex geometry is also considered.
A large number of relevant computer programs have been created. The Atmospheric Radiation model was used to develop the DSTU-NBV.1.1.-27:2010. To use these computer packages, builders and designers must be highly qualified. Therefore, calculation engineering methods are being developed for practical application.
Statistical characteristics give an idea of the time structure of the series. The temporal structure of solar radiation ranges for Ukrainian cities has been little studied. Statistical characteristics of solar radiation are given in Pivovarova (1988). Interannual variability has been studied more than temporal and diurnal variability. In Kuznietsov and Lysenko (2017), it is shown that power change as a random process can be considered nearly stationary. The mathematical expectation of the magnitude of the jumps (change in power) is close to zero, and their distribution has signs of symmetry. The models use ratios recommended by the European Solar Radiation Catalog (ESRA). The numerical results are compared with the actinometric data of the Boryspil and Kovel stations. Noticeable differences are due to local daily and seasonal features of the state of the real atmosphere. Methods by which the energy exposure of the surface is estimated according to the parameters of solar flux, the intensity of which is calculated relative to the solar constant using approximate empirical estimates of the atmospheric transparency coefficient, are given in Mysak et al. (2014).
The purpose of this study is to analyze the patterns of multi-year distribution of actual solar radiation flows from 2011 to 2020, as well as to compare them with data from earlier periods and normative data.
2. Materials and methods
2.1. Study area
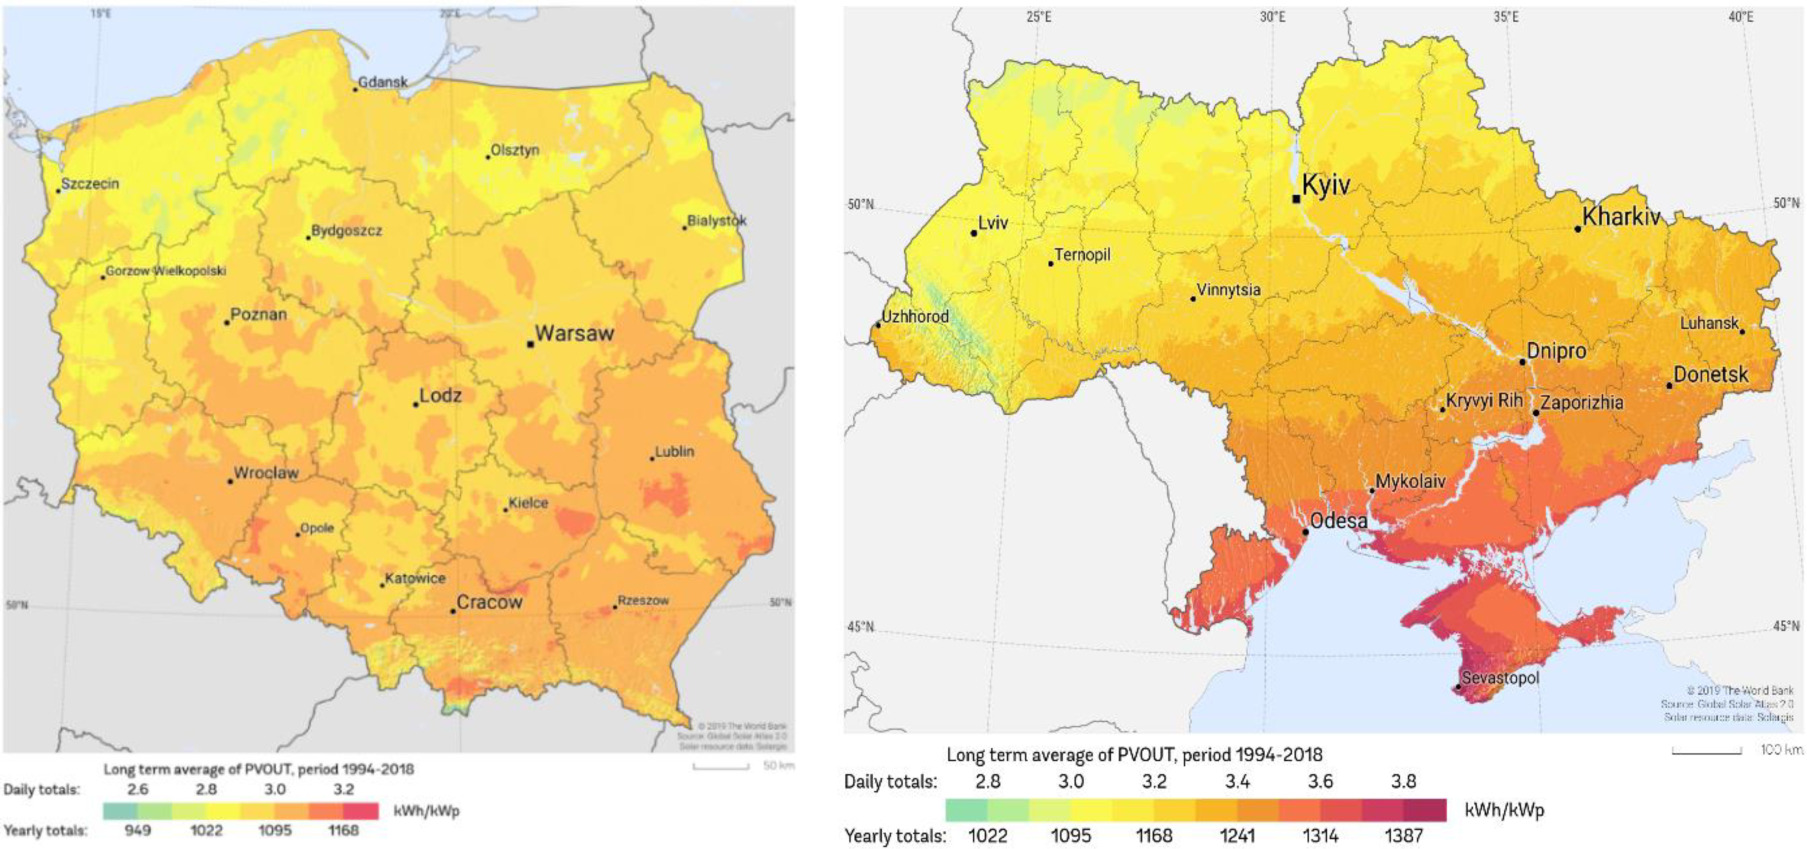
The solar radiation fields of Poland and Ukraine, as illustrated in Figure 1, are the subject of analysis. The geographical coordinates of Ukraine span from the westernmost point at 48°25'09''N, 22°08'14''E to the easternmost at 49°15'38''N, 40°13'41''E, the northernmost point at 52°22'45''N, 33°11'21''E, and the southernmost at 44°23'14''N, 33°44'17''E. The territory of Poland extends approximately from 49°00'N to 54°50'N and from 14°07'E to 24°08'E. The analysis focuses on solar radiation data over the period 2011-2020.
Temporal changes in solar radiation for two Ukrainian cities – Kyiv (50°27' N, 30°31' E) and Odesa (46°29' N, 30°43' E). According to DSTU-NBV.1.1.-27:2010, the territory of Ukraine is divided into three regions for architectural and construction purposes: Polyssia and Forest Steppe (northwest), Steppe (southeast), and the Ukrainian Carpathians. The climatic characteristics of these regions differ significantly. The methodology for calculating the average monthly sums of direct and scattered solar radiation for different latitudes (44-50°N) and tabular data under conditions of clear sky and medium cloudiness are given. When calculating hourly energy illuminance from direct and scattered radiation, tabular data are for clear sky conditions. At cloudiness values of 10 points, tabular data are given for January and July; at other cloudiness values, data interpolation is required.
2.2. Data description
The study is based on observational data of monthly and annual averages of direct, diffuse, reflected, and global solar radiation on both horizontal and perpendicular surfaces under clear sky and average cloudiness conditions for the period 2011-2020 (a total of 120 months). The dataset contained gaps (April, June, and July 2020), which were filled using arithmetic mean values from the corresponding time series. Additionally, data on sunshine duration (monthly and annual averages) and the potential annual number of clear days were used. The primary data source was the Borys Sreznevskyi Central Geophysical Observatory (Kyiv, Ukraine). Measurement data are presented for two meteorological stations (Table 1).
Table 1.
Details of the meteorological stations.
| Station name | Latitude | Longitude | Average annual temperature | Altitude |
|---|---|---|---|---|
| Kyiv (Boryspil, airport) | 50°27'16.9''N | 30°31'25.7''E | +9°C | 184 m |
| Odesa (airport) | 46°28'39''N | 30°43'57.4''E | +11.3°C | 57 m |
To forecast the time series, its statistical characteristics were determined and compared with the normative values provided in the DSTU-NBV.1.1.-27:2010. Observation data from the Boryspil (Kyiv) meteorological station were compared with data from other cities (Katowice and Częstochowa, Poland) located at latitudes close to that of Kyiv (approximately 50°N). The main method used to identify trend and cyclical components in the time series was statistical, implemented using the STATISTICA software package (https://www.statistica.com/en/software/tibco-data-science-/-tibco-statistica).
2.3. Model performance
Statistical calculations were performed using the following equations:
• mathematical expectation:
• 1st quartile Q1, 2nd quartile (median) Q2, 3rd quartile Q3:
• 2nd central moment (dispersion):
• mode:
• coefficient asymmetry:
• kurtosis coefficient:
The calculations were made using the R 4.03 software for statistical data analysis (https://www.rproject.org/), free software with wide capability for various methods of data processing (Dalgaard 2008).
The monthly data were used to calculate hourly values of solar radiation according to the following methodology:
Incoming total solar radiation during the day is determined by the relation (Kalogirou 2014):
where: Gsc is the solar constant; Gsc = 1330 W/m2; N is the day of the year; L is the geographical latitude; δ is the declination of the sun; hss is the height of the sun; hs is the length of the solar day.
The temporal arrivals of solar radiation are determined by the relation (Collares-Perera, Rabl 1979):
where: α = 0.409 + 0.5016sin(hss – 60); β = 0.6609 – 0.4767sin(hss – 60).
3. Main results and their discussion
Figure 2 shows the long-term change in total solar radiation for the conditions of Kyiv (Boryspil station) (Fig. 2a) and Odesa (Fig. 2b).
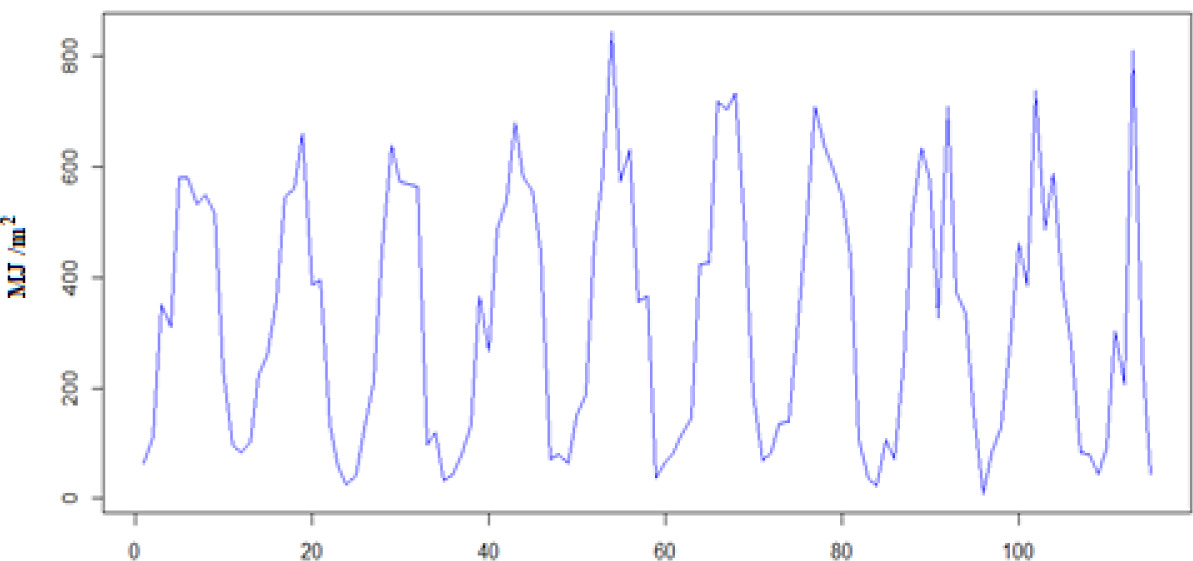
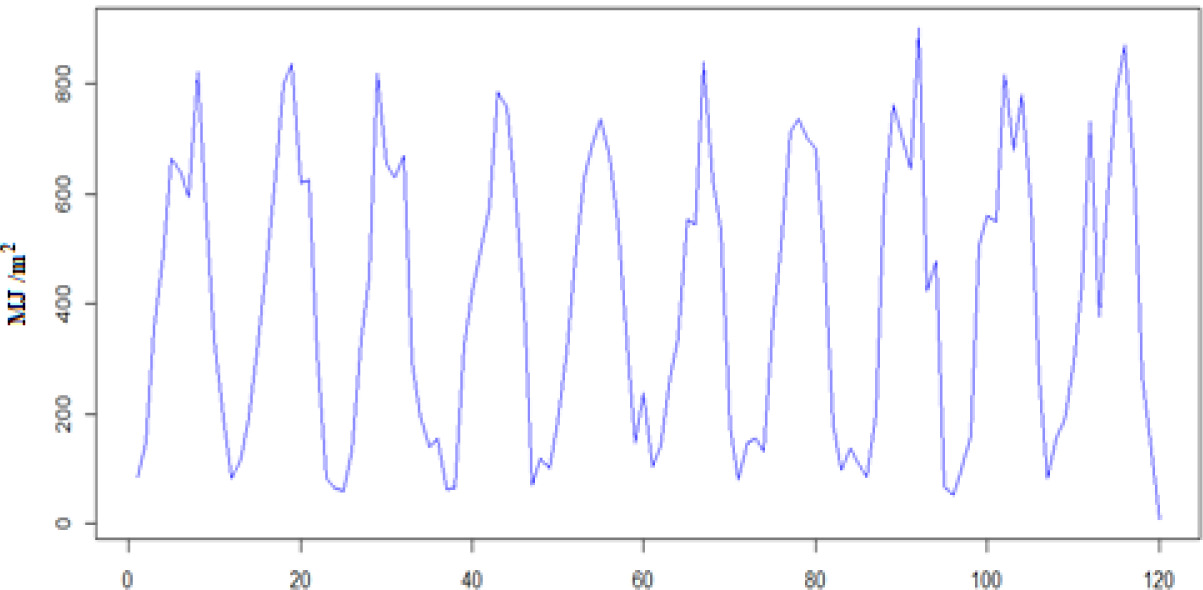
Table 2 shows data from the State Standard of Ukraine 2010 for Kyiv, compared with data from other weather stations located near 50°N.
Table 2.
Total solar radiation according to data from weather stations close to 50°N by month (horizontal surface, average cloudiness).
[i] Note: Δ1, Δ2, Δ3 are deviations from DSTU-NBV.1.1.-27:2010.
The data of Standard 2010 differ by 21-23% from the data measured from 2011 to 2020. When the longitude changes from 19° to 36°E, the values of solar radiation differ slightly (Table 3), while under the influence of regional conditions (e.g., in Katowice, under the influence of mountain conditions, or in Kharkiv, influenced by steppe conditions), they can differ significantly. Temporal differences in measurements were observed over the period of 1961 to 2020. Thus, in the last decade, in the summer months, there was an increase in the values of total solar radiation up to 700-900 MJ/m2.
Table 3.
Statistical characteristics of average monthly amounts of total solar radiation for the period of 2011-2022.
Using the values of actinometric measurements from 2011 to 2020, the average monthly values were calculated, along with standard deviation, coefficient of variation, asymmetry coefficient, kurtosis coefficient, and amplitude (Table 3).
Figure 3 shows the annual course of the standard deviation for the conditions of the meteorological stations in Kyiv and Odesa. There is a seasonal change in the amount of total solar radiation. At the same time, in the northern regions of Ukraine, the changes are 100-180 MJ/m2. The variability of solar radiation is shown in Figure 4.
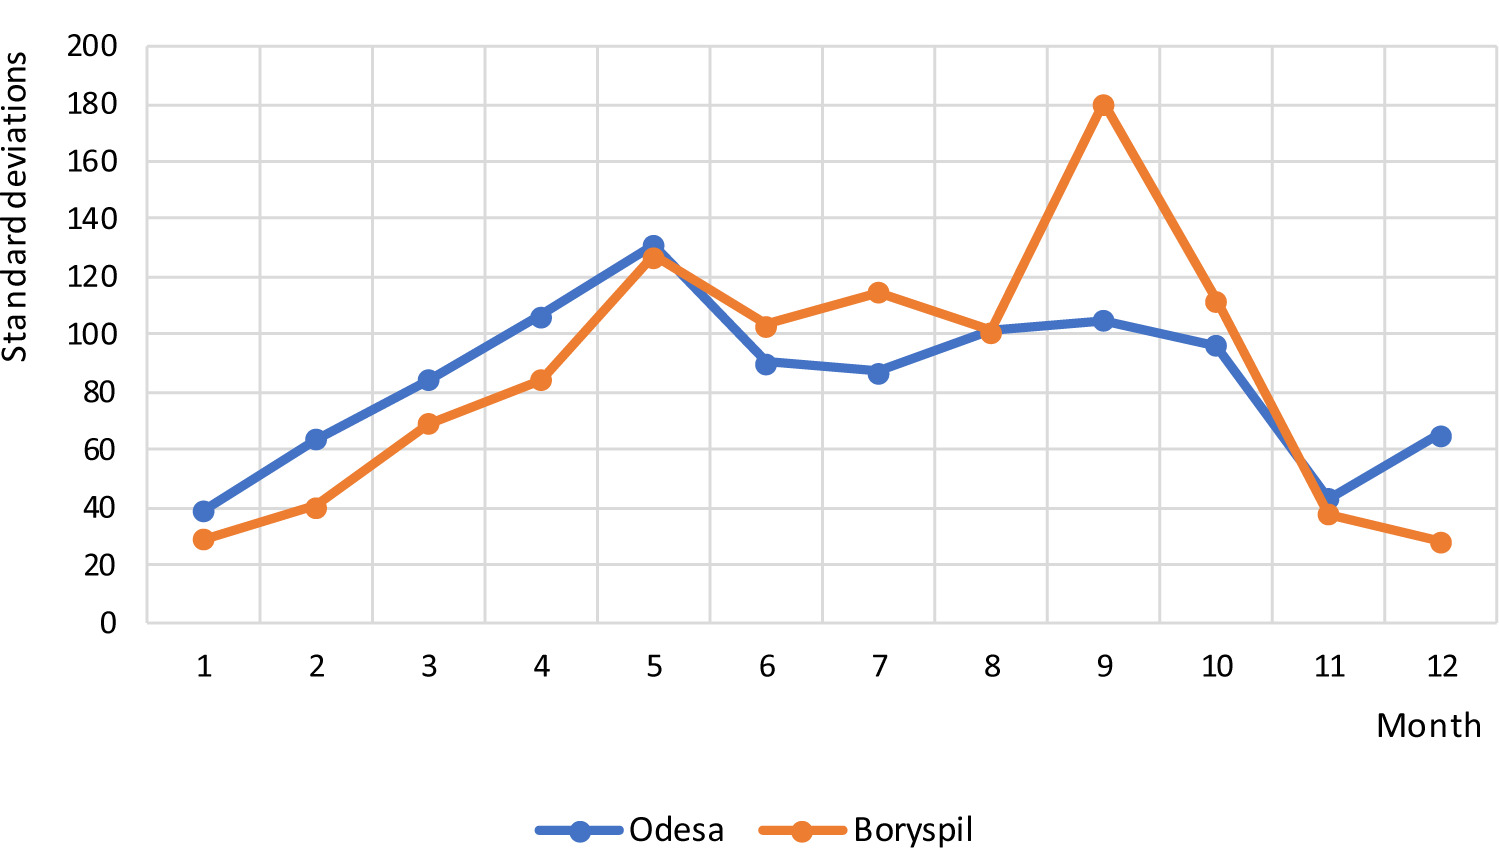
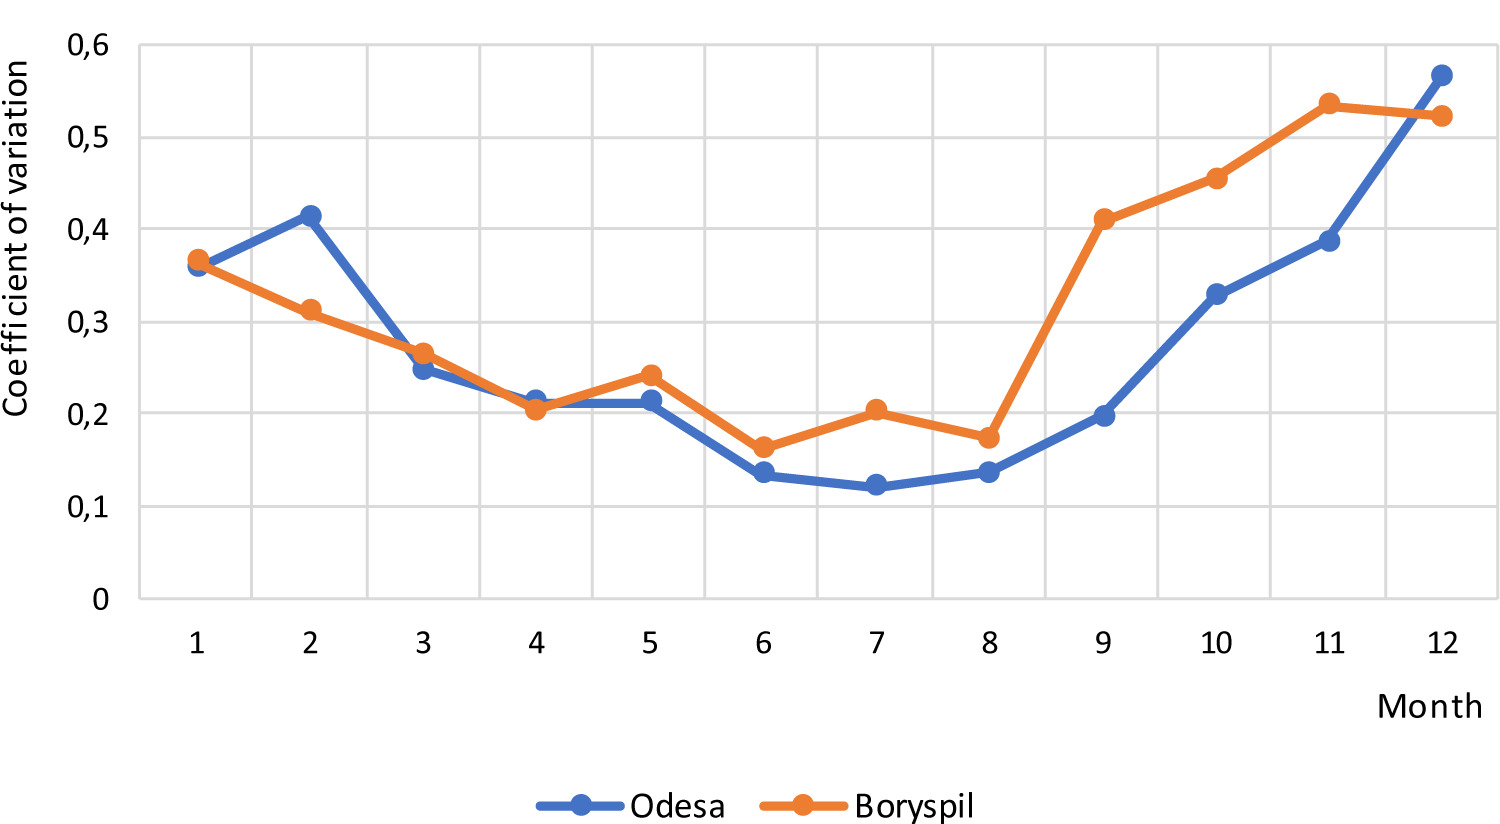
The change in the relative standard deviation is more significant in the autumn-winter months, reaching 30-34%. This ratio is typical for both northern and southern regions of the country. For Kyiv, the coefficient of variation is 20-34% and the amplitude is 919/514 MJ/m2. For Odesa, they are 12-30% and 789/640 MJ/m2, respectively.
The change in the asymmetry coefficient is shown in Figure 5.
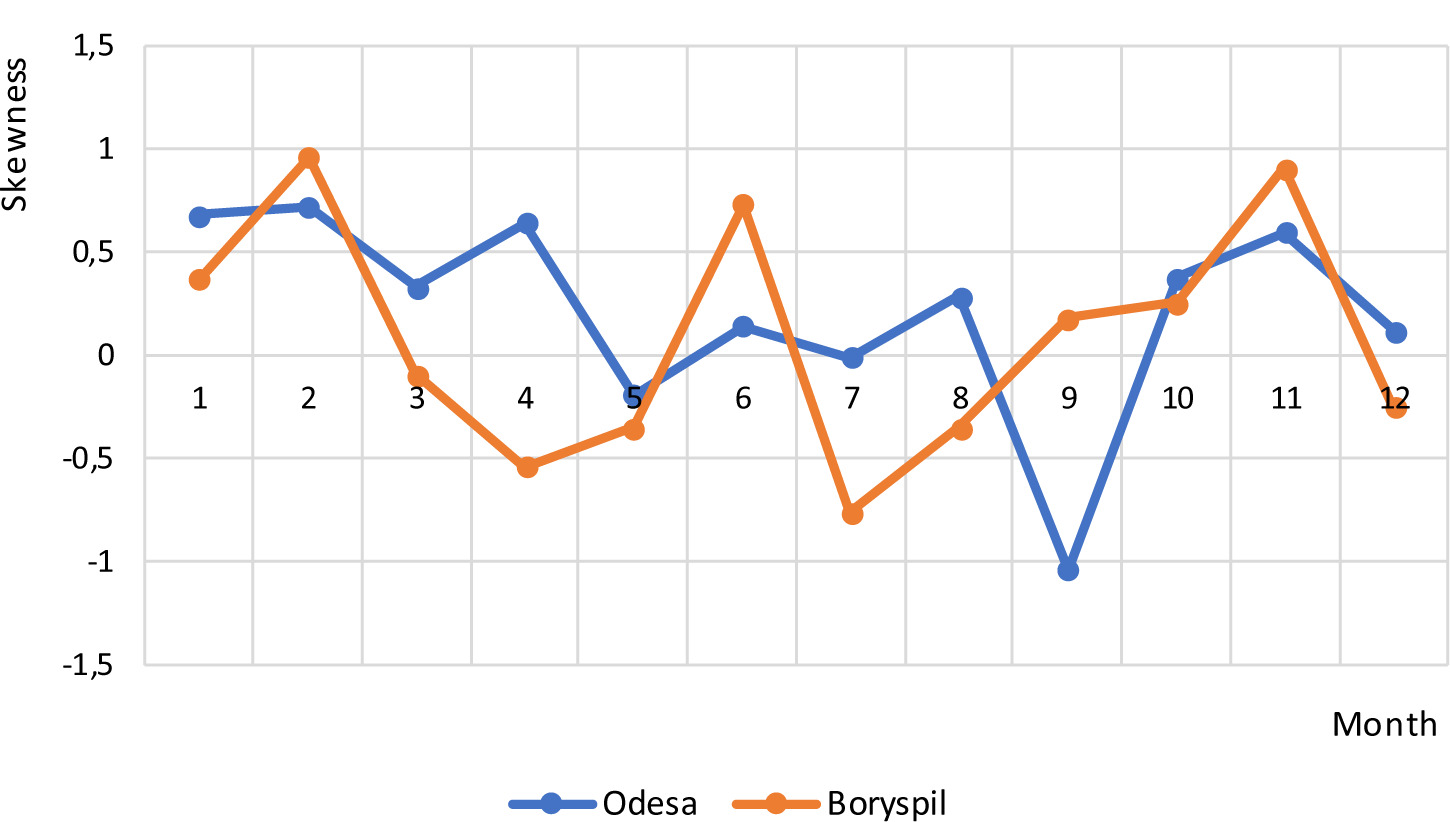
For Odesa, values fluctuate from –1.1 to 0.75. For the northern territories, a period with negative asymmetry is observed from March to May. From August to December, the asymmetry is positive and reaches maximum values of (–1), 1.
Figure 6 shows the values of the kurtosis coefficient.
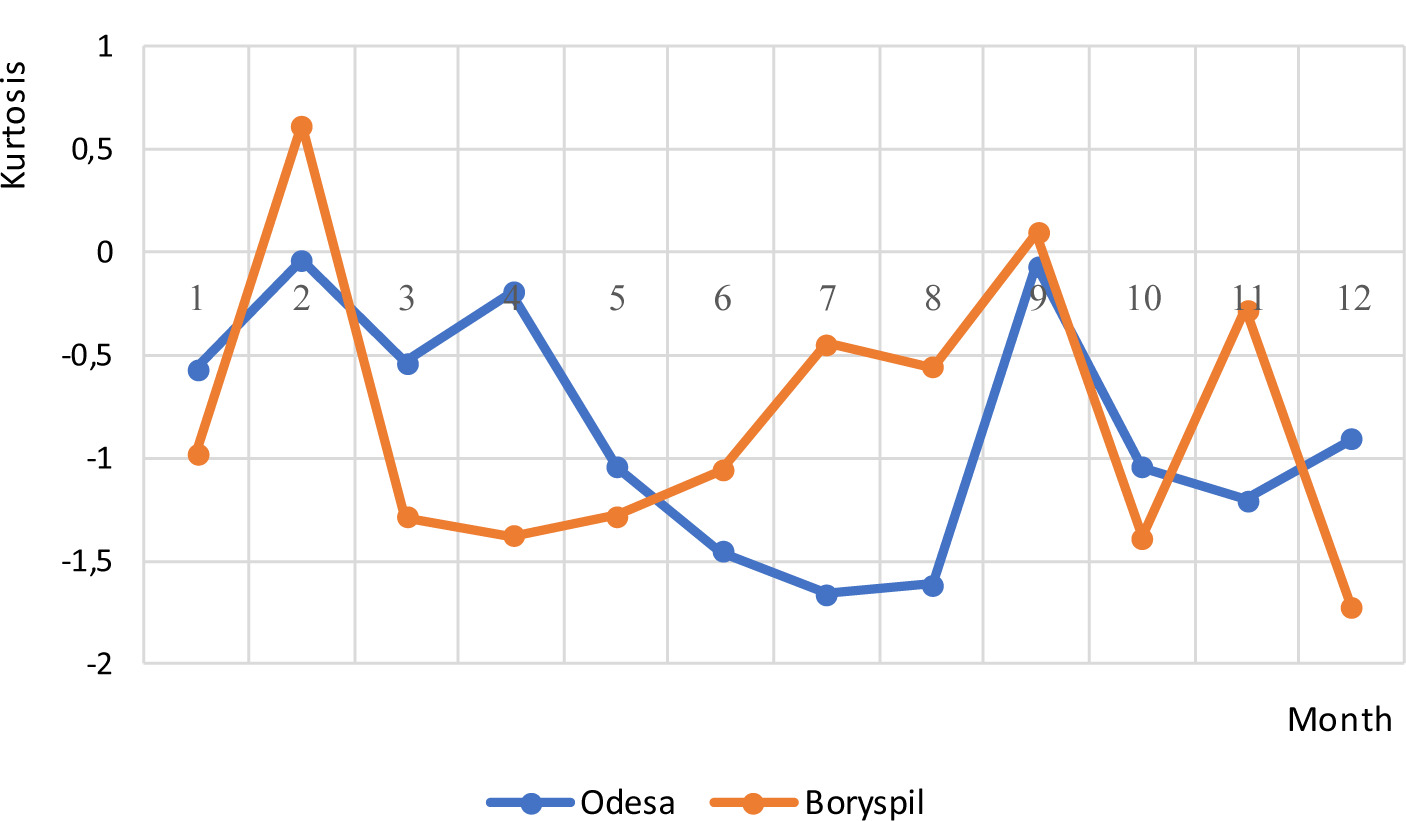
In the distribution of total solar radiation, there is a negative kurtosis (E) during the year for the southern regions of Ukraine, with a maximum E of – 1.75. For Kyiv, from March to November, kurtosis is negative with maximum values of 1.4-1.75. In February, kurtosis is positive (E = 0.6), indicating sharp peaks in the distribution curves.
Figure 7 shows a comparison of average monthly and average daily values for the Central Geophysical Observatory and the State Standard of Ukraine. An increase in radiation has been observed during the last decade.
Fig. 7.
Average monthly and average daily values of solar radiation. ─o─ State standard of Ukraine; ─x─ Central Geophysical Observatory; ─Δ─ day.
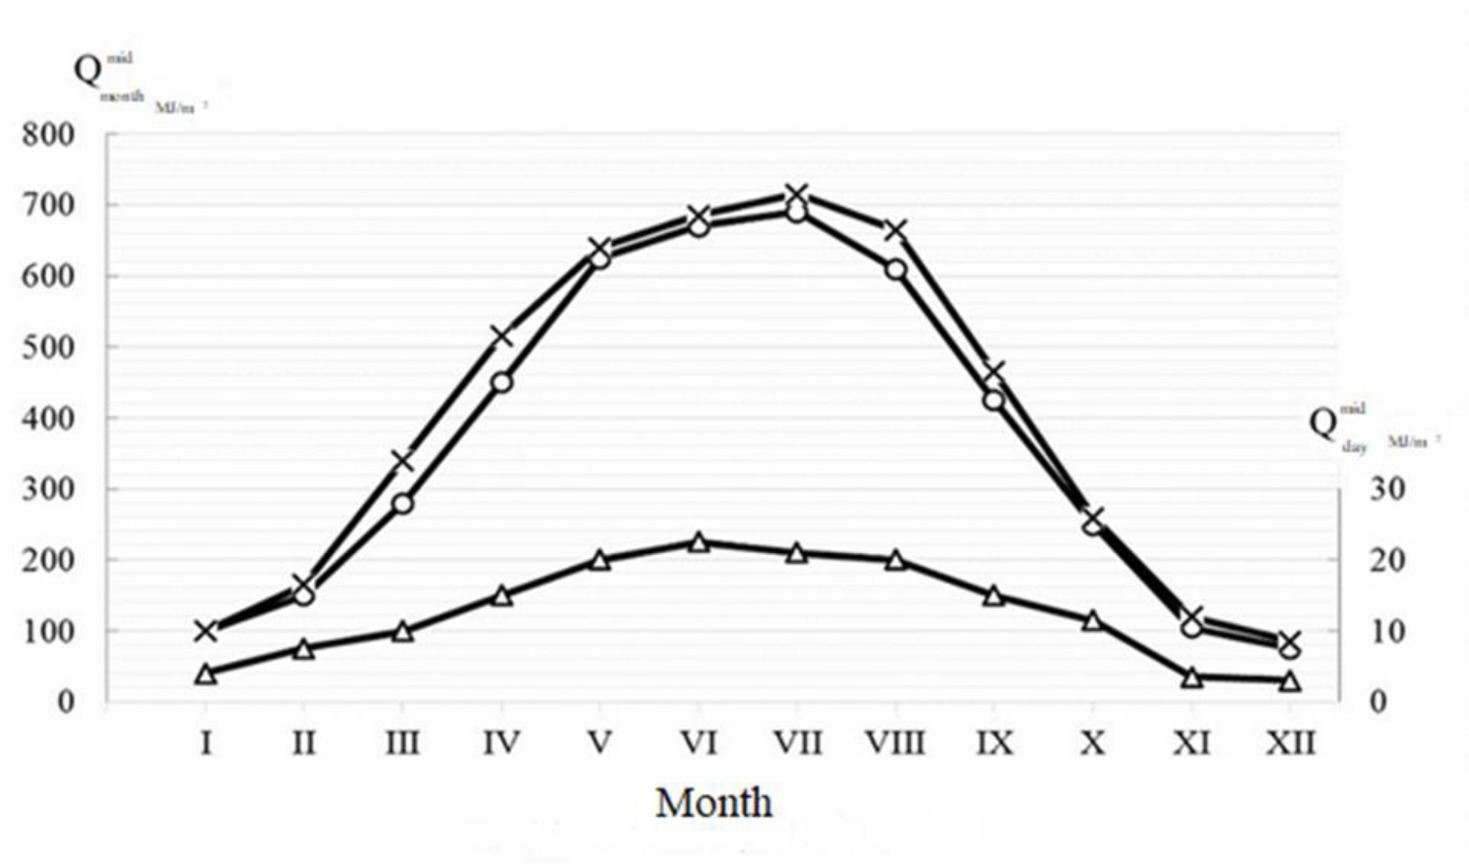
Table 4 compares data from the State Standard of Ukraine with climatic data from different periods. The data of the State Standard of Ukraine (8-11%) coincides with the data from the early periods.
Table 4.
Comparison of total solar radiation according to DSTU-NBV.1.1.-27:2010 with climatic data of different periods (for Odesa conditions with medium cloudiness).
An increase in average monthly values has been observed in recent years. Average daily values in every month of the year are shown in Figure 7. Using calculation dependencies, average daily values for any day of the year can be determined. Using these daily averages, hourly values can be determined.
Knowing the radiation input data, the average monthly and hourly values can be determined: Collares-Perera and Rabl (1979), Page et al. (2001), Zekai (2008), Duffie and Beckman (2013), Walker (2013), Kalogirou (2014), Mysak et al. (2014).
For Kyiv at noon on July 15, we determine:
The incidence of total solar radiation at noon on July 15 for Kyiv is:
i = r ∙ H0 = 0.112 ∙ 7078 = W/m2 W/m2 according to the Standard of Ukraine (862 W/m2).
For example, for Kyiv (L = 50 L), the daily incidence of radiation on July 15 is:
According to the Standard 2010 data, the total daily solar radiation on June 15 for Kyiv under a clear sky is Q = 7544 W•h/(m2•day) (Δ = 6%).
An important characteristic of solar energy resources is the duration of sunshine. According to data from Dmytrenko and Barandich (2007), effective use of solar energy is ensured when the duration of sunshine (average monthly values) is >200 h. According to the data from the Boris Sreznevskyi Central Geophysical Observatory, the actual annual duration of sunshine for 2011-2020 at Kyiv (Boryspil) varies from 2222 hours (2011) to 2184 hours (2020). The possible annual duration of sunshine varies from 4452 hours (2011) to 4481 hours (2020), respectively. The average monthly value of the actual duration of sunshine varies from 203 hours (March 2011) to 135 hours (November 2011). The maximum values are 302 hours in May and 305 hours in June. In 2020, the actual monthly average values vary from 180 hours in March to 120 hours in November. Maximum values are observed in June (331 hours) and August (334 hours). In the southern regions of Ukraine, the actual annual duration of sunshine for 2011-2020 at Odesa varies from 2387 hours (2011) to 2709 hours (2020). The possible duration of sunshine varies from 4717 hours (2011) to 4242 hours (2020), respectively. Average monthly values of the actual duration of sunshine vary from 180 hours (March 2011) to 169 hours (November 2011). The maximum values are observed in July (333 hours in 2011) and August (371 hours in 2011). In 2020, the actual monthly average values ranged from 217 hours (March 2020) to 168 hours (November 2020), respectively. The maximum values were observed in July (379 hours in 2020) and August (380 hours in 2020).
The criterion for the expediency of using solar energy is that the annual number of clear and semi-clear days is >200 (with >244 days, the potential is assessed as high). The State Standard of Ukraine does not specify the number of clear days.
4. Conclusions
The results of analyzing the multi-year series of solar radiation for 2011-2020 indicate an increase in the average monthly and annual solar radiation in both the southern and northern regions of the country in the last years of the decade. Comparing data from the DSTU-NBV.1.1.-27:2010 with actual measurement data, the data from the state standard of Ukraine differ from the data of the last decade by 18-23% and require clarification. To determine daily and hourly solar radiation, empirical dependences are presented that are simple and convenient for use in engineering calculations and assessments of solar energy resources.