1. Introduction
Ongoing shifts in global climate patterns have intensified the occurrence and severity of extreme weather phenomena, notably intense storms and flash floods. Such events pose escalating risks to populations, infrastructure, and economies, especially in regions characterized by complex terrain and limited hydrological infrastructure. In Kosovo and the broader Balkan Peninsula, the frequency and intensity of convective storms during the warmer months have increased, often triggering extreme precipitation and s ubsequent flash flood events. The rapid development of these hydrometeorological hazards necessitates advancements in accurate forecasting models, robust early warning systems (EWS), and comprehensive flood risk management frameworks (Archer et al. 2006; Borga et al. 2007).
Numerical weather prediction (NWP) tools, including the Weather Research and Forecasting (WRF) model, have become pivotal in simulating convective processes and forecasting heavy rainfall episodes. However, flash flood prediction remains challenging due to the complex coupling between atmospheric dynamics and hydrological responses. The accuracy of WRF-based forecasts is strongly influenced by model setup parameters such as initial and boundary conditions, spatial resolution, and microphysical parameterizations, particularly for local convection (Lee, Hong 2006; Skamarock et al. 2008; Spiridonov et al. 2020, 2023). To improve flood forecasting methodology, it is essential to integrate meteorological forecasts with hydrological models that convert precipitation into surface runoff and streamflow. Coupled meteorological-hydrological-hydraulic modeling frameworks have shown promise in generating timely and skillful flash flood predictions (Varlas et al. 2023). Furthermore, efforts to optimize microphysics schemes within WRF enhance rainfall estimations in basins lacking dense observational networks .
Effective flash flood early warning systems rely on continuous monitoring through ground stations, remote sensing platforms, and hydrological networks. Unfortunately, in Kosovo and similar regions, real-time observational data are often sparse or incomplete, hindering accurate flood detection and early warnings (Cluckie, Han 2000; Thielen et al. 2009; Hapuarachchi et al. 2011). Integration of satellite precipitation products, such as GPM-IMERG, with radar and hydrological data has improved early warning system capabilities (Giannaros et al. 2022). Large-scale forecasting and early warning systems such as the Global Flood Awareness System (GLOFAS) (Alfieri et al. 2013), the European Flood Awareness System (EFAS) (Thielen et al. 2009), and reanalysis datasets like ERA5 (Hersbach et al. 2020) provide valuable inputs for flood risk assessment and decision-making. In addition to hydrometeorological forecasting, geospatial techniques play a crucial role in flood hazard mapping and vulnerability assessment. Advances in Geographic Information Systems (GIS) and machine learning methods have enhanced spatial flood risk analyses, supporting improved urban planning and land-use policies. The increasing vulnerability to flooding due to climate change is exacerbated by anthropogenic activities such as uncontrolled urban growth, deforestation, and modifications of natural waterways, which reduce landscape permeability and increase flood exposure (Kane, Shogren 2000; Dobler et al. 2012; Didovets et al. 2019; Moragoda, Cohen 2020). Previous research by Osmanaj et al. (2025) focused on evaluating the performance of the WRF non-hydrostatic model in simulating the severe flash flood event that occurred on June 24, 2023, at Peja in northeastern Kosovo, during which more than 54 mm of rainfall was recorded within two hours.
This study analyzes a winter flash flood event that struck the small catchment of Skenderaj on January 19, 2023 (see Agaj et al. 2024; Osmanaj et al. 2025). The main objective is to develop a flash flood early warning system by integrating high-resolution atmospheric modeling using the WRF model, hydrological simulations, and hydrometeorological hazard assessments. This integrated approach aims to enhance the accuracy of flash flood forecasting methodologies and improve operational early warning capabilities in data-scarce regions. By combining meteorological modeling, hydrological analysis, and geospatial risk assessment, this research aims to contribute to the development of more accurate flash flood forecasting methodologies and improved early warning capabilities.
The structure of this paper is as follows: Section 2 presents the observational analysis of the event, Section 3 details the numerical modeling approach, Section 4 discusses the simulation results with validation against observations, and Section 5 concludes with recommendations for enhancing flood risk management strategies.
2. Motivation
Flooding has become an increasingly frequent and devastating phenomenon across Kosovo and the broader Balkan region, particularly during spring and summer. In 2023 alone, Kosovo experienced two major flood events, in January and June, causing extensive damage to cities such as Skenderaj, Mitrovica, Peja, and Podujeva. These floods resulted in significant economic losses, infrastructure damage, and human casualties, underscoring the urgent need for improved flood management and mitigation strategies.
The increasing frequency and severity of floods are linked to climate change, which has disrupted hydrological patterns and intensified extreme weather events. Rising global temperatures contribute to unpredictable rainfall distributions, leading to both prolonged droughts and extreme precipitation. The 2019-2021 Climate Change Strategy Action Plan for Kosovo acknowledges these risks, yet flood management remains hindered by inadequate infrastructure, incomplete flood risk mapping, and insufficient early warning systems.
Additionally, human factors such as poor urban planning, riverbed degradation, and inadequate stormwater infrastructure have exacerbated flood risks. Unregulated construction, deforestation, and the concretization of river channels have reduced the land’s natural ability to absorb excess water, increasing the likelihood of urban and riverine flooding.
Given these challenges, there is a pressing need for comprehensive flood risk assessment, improved early warning systems, and climate adaptation strategies. Strengthening institutional coordination, investing in resilient infrastructure, and integrating hydrometeorological data into urban planning are critical steps toward mitigating future flood impacts and enhancing community resilience. Recent extreme rainfall events have demonstrated the inadequacy of current flood forecasting and warning systems in Kos ovo. The flood event on January 19, 2023, led to river overflows, while the June 24, 2023, urban flood in Peja highlighted the vulnerability of city infrastructure. The need for an integrated, real-time flash flood early warning system is crucial for mitigating future risks.
3. Methods
The main objectives of this research are:
To evaluate the most suitable model configuration for accurately simulating the atmospheric behavior and physical processes associated with torrential rainfall over Kosovo.
To develop an algorithm for an integrated hydrometeorological hazard module for early flash-flooding warning
To address these objectives, a series of high-resolution simulations was performed using the Weather Research and Forecasting (WRF) model. The procedure included sensitivity testing of physical schemes and resolutions, using both ARW and NMM dynamic cores (Janjic 2003; Kain et al. 2006; Lee, Hong 2006; Han, Hong 2018). Hourly warnings and rainfall outputs were compared with historical observations and flash-flood guidance thresholds (Spiridonov et al. 2021; Liu et al. 2018).
3.1. Meteorological model framework
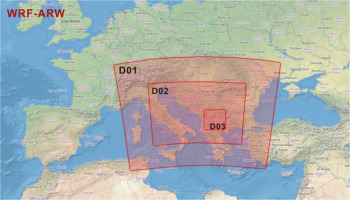
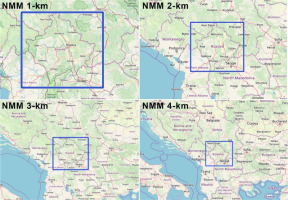
The WRF model was selected for its robust treatment of atmospheric processes and flexibility in spatial and physical configurations. It supports both single- and nested-domain simulations and includes a wide range of physics options, such as the Thompson microphysics scheme (Thompson et al. 2008; Thompson, Eidhammer 2014), Yonsei University PBL (Hong 2010), Monin-Obukhov surface layer physics (Janjic 1996), RRTM longwave radiation (Mlawer et al. 1997), and Dudhia shortwave radiation (Dudhia 1989). The ARW core (Skamarock et al. 2008) was applied in a triple-nested configuration (18×6×2 km) optimized for resolving convective-scale dynamics over Kosovo. The NMM core (Janjic 2003) was tested in single-domain setups with horizontal resolutions of 1 km, 2 km, 3 km, and 4 km (Fig. 1), echoing strategies used in regional storm-scale studies (Xue, Martin 2006; Schwartz et al. 2015).
Fig. 1.
Domain configuration of the WRF-NMM (Non-hydrostatic Mesoscale Model) single-model setup over southeastern Europe, illustrating nested grid spacings of 4 km, 3 km, 2 km, and 1 km. The central blue rectangle highlights the location of Kosovo within the model domain.
The ARW nested run shown in Figure 2 was configured with time steps of 30, 10, and 3.3 seconds across the three domains, while NMM runs used shorter steps (down to 2 seconds) to maintain numerical stability. The experiments explored variations in microphysics (e.g., WSM6, Ferrier), cumulus schemes (e.g., Shin, Hong 2015), and vertical levels (32 layers), consistent with prior optimization studies (Misenis, Zhang 2010; Chawla et al. 2018; Chinta et al. 2021). All simulations were initialized with GDAS/FNL 0.25° global datasets, updated every 6 hours (Bernadet et al. 2000; Elmore et al. 2002; Kain et al. 2006). A spin-up period of 18 hours preceded each run to allow model stabilization before the targeted flood event onset (Jankov et al. 2007; Liu et al. 2021). Table 1 summarizes the domain configurations, model cores, physical parameterizations, and initialization data used in each of the eight experimental setups.
Table 1.
Model setup and key parameters used in numerical experiments.
| Parameter | Exp | 1 | 2 | 3 | 4 | 5 | 6 | 7 | 8 |
|---|---|---|---|---|---|---|---|---|---|
| Type of experiment | Simulation Triple-nested run | Simulation Single domain | Simulation Single domain | Simulation Single domain | Simulation Single domain | Simulation Single domain | Simulation Single domain | Simulation Single domain | |
| Model dynamics | ARW Skamarock et al. (2008) | NMM Janjic (2003) | NMM | NMM | NMM | NMM | NMM | NMM | |
| Model microphysics | 28 Thompson, Eidhammer (2014) | 8 Thompson et al. (2008) | 8 | 3 Ferrier (1994) | 8 Thompson et al. (2008) | 8 | 6 WSM6 Hong, Lim (2006) | 8 | |
| PBL-scheme | 1 Yonsei Univ. YSU Hong (2010) | 1 | 1 | 1 | 2 Mellor-Yamada Janjic (2001) | 1 | 1 | 1 | |
| Surface physics-schemes | 1 Monin-Obukhov Janjic (1996) | 1 | 1 | 1 | 2 Monin-Obukhov (Janjic Eta) Janjic (1996) | 2 | 1 | 1 | |
| Cumulus parameterization | 14Shin, Hong (2015); Han et al. (2016) 14,14,0 | 0 | 0 Explicit treatment of convection | 0 | 0 | 0 | 0 | 0 | |
| Long-wave radiation | 1 RRTM Scheme Mlawer et al. (1997) | 1 | 1 | 1 | 1 | 1 | 1 | 1 | |
| Short-wave radiation | 1 Dudhia (1989) | 1 | 1 | 1 | 1 | 1 | 1 | 1 | |
| Hor. Grid res. | 18×6×2km | 4-km | 4 km (larger domain) | 3 km | 2-km | 2-km (larger domain) | 1 km | 1 km (larger domain) | |
| Ver. Grid. Res. | 32 | 32 | 32 | 32 | 32 | 32 | 32 | 32 | |
| Time step (dt) | 30×10×3.3 s | 8 s | 8 s | 6 s | 4 s | 4 s | 2 s | 2 s | |
| Sim. Lead time | 60 h | 60 h | 60 h | 60 h | 60 h | 60 h | 60 h | 60 h | |
| Total grid pointse_we e_sn e_vert | 113,190,15181, 124, 136 44,44,44 | 100 150 44 | 250 300 44 | 100 150 44 | 100 150 44 | 200 250 44 | 100 150 44 | 200 250 44 | |
| Initial data and LBC | GDAS FNL | GDAS FNL | GDAS FNL | GDAS FNL | GDAS FNL | GDAS FNL | GDAS FNL | GDAS FNL | |
3.2. Design of an integrated hydrometeorological module for a flash-flood warning system
A robust river flood forecasting methodology has been developed by integrating meteorological, hydrological, and topographic parameters, enabling accurate prediction of flood risk during extreme weather events in Kosovo. This approach incorporates accumulated rainfall (mm/24 h), storm surface runoff (kg/m2), river discharge (m3/s), soil moisture (kg/m2), snowmelt equivalent (kg/m2), and terrain slope-surface roughness (m), each weighted according to expert judgment and regional statistical analysis. These parameters are normalized and combined into a composite flood risk index using a weighted scoring function that reflects their individual contributions to flood generation.
An integrated approach is applied by combining ECMWF high-resolution forecast river discharge or ERA5 reanalysis discharge data with WRF-ARW model outputs to enhance the accuracy of flood risk predictions for Kosovo. This approach avoids the use of separate rainfall-runoff models, relying instead on discharge data from ECMWF and meteorological fields from WRF to predict flood risk levels. ERA5 provides river discharge data at a 0.25° resolution, while ECMWF high-resolution forecasts offer more detailed discharge estimates at finer spatial resolution (e.g., 0.1°). These datasets are essential for assessing river flow conditions across the Kosovo domain. To ensure consistency, ERA5 discharge data (typically provided at 24-hour intervals) is resampled to match the 3-km spatial resolution and forecast intervals (e.g., hourly or every 3 hours) of WRF-ARW model outputs. This is accomplished through interpolation techniques such as bilinear or cubic spline interpolation to ensure spatial and temporal alignment.
WRF-ARW outputs include key meteorological fields necessary for flood risk estimation. The integrated system combines these fields with river discharge observations to calculate a multivariate cumulative distribution function (CDF), used for classifying flood risk based on historical reference values and critical thresholds. Among the variables, river discharge is especially important for identifying areas where flow is likely to exceed channel capacity, signaling heightened flood risk and triggering alerts within the flash flood early warning system.
3.2.1. Multivariate CDF for flood risk assessment
The multivariate cumulative distribution function (CDF) is used to compute the composite flood risk score. Let X =(AR, RO, Q, SME, SL) represent the vector of the key hydrometeorological parameters, and (TAR, TRO, TQ, TSM, TSME, TSL) represent their corresponding thresholds. The cumulative distribution function FFloodRisk for the flood risk, considering the parameters and their thresholds, is expressed as:
To capture the influence of the thresholds and the weighted contributions of each parameter, the CDF can be expanded by incorporating the normalized values of the parameters and their weights. The weight for each parameter is calculated as:
where: ωi represents the normalized weight for parameter iii; fi(xi, Ti) is the probability density function (PDF) or cumulative distribution of parameter iii based on its threshold Ti; max(fi(xi,Ti)) normalizes the weight to ensure it sums up appropriately.
The final multivariate CDF for the flood risk is:
where: the product is taken over all five parameters (AR, RO, Q, SM, SME, SL); fi(xi, Ti) is the distribution function corresponding to the parameter ii; ωi is the weight applied to each parameter.
The Composite Flood Risk Score (CRI) is then derived from the CDF, which quantifies the overall flood risk. It is calculated using:
Here: CRI is the Composite Risk Index, representing the total flood risk; ωi is the weight assigned to each parameter; fi(xi, Ti) is the cumulative distribution function for each parameter.
The CRI is then categorized into three risk levels that correspond to different flood severity levels:
Low Risk: CRI ≤ 0.3 – Minimal risk of flooding.
Medium Risk: 0.3 < CRI ≤ 0.6 – Potential for localized to significant flooding.
High Risk: CRI > 0.6 – Severe to catastrophic flooding expected.
The CRI is continuously updated using real-time data from the WRF model and local hydrological observations, allowing for timely flood alerts when the CRI exceeds thresholds for higher-risk categories. These alerts are disseminated to relevant authorities and the public via the integrated geo-hazard alert system, providing a comprehensive flood forecasting tool.
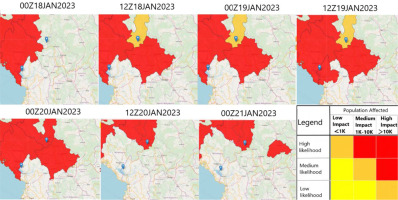
Model outputs, including 24-hour accumulated precipitation, surface runoff, river discharge, soil moisture, and snowmelt (snow water equivalent), are processed to generate flood hazard maps at 12-hour intervals. These maps categorize flood risk into three zones: low (yellow), moderate (orange), and high (red). Additionally, population impact is assessed, ranging from low (<1K) to high (>10K). For instance, Skenderaj was identified as a high-risk area on both January 18 and 19, 2023, with a moderate population impact (1K – 10K affected individuals).
Geographic Information System (GIS)-based analysis was used to overlay model outputs with terrain characteristics, soil types, and land use. This integrative approach identified areas prone to flash floods, landslides, and severe soil erosion. The performance of the hydrological model was validated by comparing simulated flood extents and discharge rates with historical flood records and field observations, ensuring its reliability in predicting extreme events.
4. Results
4.1. Simulation of rainfall patterns
The interpretation of results begins with analyzing total precipitation amounts over 24, 48, and 60 hours, obtained from the ARW triple-nested run (Fig. 3).
Fig. 3.
ARW forecast of total accumulated precipitation (mm) over 24, 48, and 60 hours, with the 2-km run shown in the upper panels and the 6-km run in the lower panels.
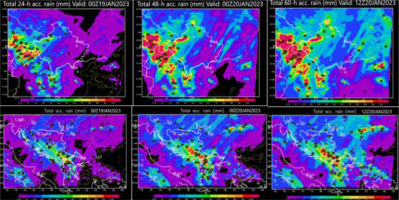
The simulation with the 2-km nested run provides a more realistic depiction of accumulated precipitation over Kosovo. Based on rainfall patterns, the highest precipitation amounts occurred between January 19 at 00 UTC and January 20 at 00 UTC, primarily in the northwestern regions of Kosovo. The total 60-hour accumulation in Istog, the westernmost location, exceeded 130 mm, while in Skenderaj, where flooding was recorded, the total reached 44.1 mm.
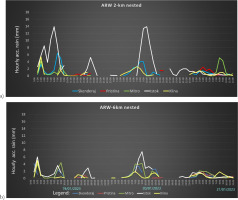
The 6-km run captured the spatial distribution of precipitation reasonably well, but underestimated the accumulated amounts, with 55.4 mm for Istog and 33.6 mm for Skenderaj. The relative rainfall intensities for both nested runs can be assessed using the time series of hourly rainfall (mm) (Fig. 4a-b). The ARW 2-km nested run (Fig. 4a) indicates two peaks of intense hourly precipitation: one on January 18 from 05-06 UTC in Istog (white curve) and another during the intense rainfall period on January 19 from 10-11 UTC. For Skenderaj, two smaller peaks are observed on January 18, from 07-08 UTC, with intensities of 6.4 mm/h and 5 mm/h, and another from 08-09 UTC, both with relative intensities of 4 mm/h. The 6-km run shown in Figure 4b, covering a larger area, captured the timing of the peaks in Istog and Skenderaj but underestimated the hourly precipitation amounts.
Fig. 4.
Time series of relative rainfall intensities during the simulation period using (a) the ARW 2-km (upper chart) and (b) the ARW 6-km (lower chart) run.
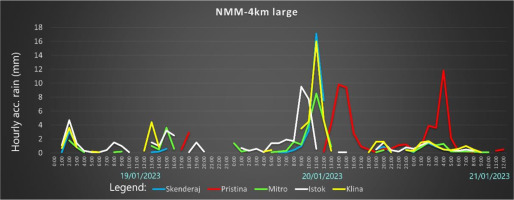
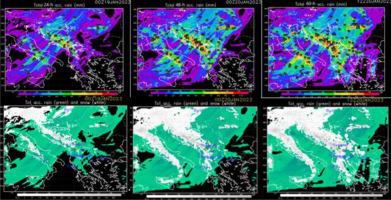
In the NMM model simulations, in addition to total precipitation, snowfall amounts are also included. Among all numerical experiments, starting with the 1-km, 2-km, and 4-km grid resolutions for smaller and larger areas, and the 3-km resolution for a uniform area, the experiment with the 4-km resolution provided the most realistic results. The integration domain covers a larger area of Southeast Europe, including various geographical regions such as the Adriatic, Ionian, and Aegean Seas, parts of the Alps, the Dinarides, and the mountainous complexes of western Macedonia, as well as the complex topography and landscapes of the area. For this reason, the model maps of accumulated precipitation and relative intensities are presented in Appendix A, allowing readers to become more familiar with the rainfall patterns and time series. Here, we focus on interpreting the results for the NMM 4-km integration, with a time step of 8 seconds and explicit treatment of convective processes. The simulation over a larger area with a 4 km horizontal resolution shows widespread rainfall over the central Balkans and the southern part of the Apennine Peninsula. It is evident that in some areas of Herzegovina and Montenegro, the total precipitation amounts exceed 100 mm over the 60 hours, while the model shows around 200 mm in northern Albania. Based on the model results, no significant precipitation amounts were observed in Kosovo during the first 24 hours of the simulation, except for the extreme western mountainous region. However, in the next 24-48 hours, the total precipitation amount increases significantly. The largest simulated 60-hour total is in Pristina (around 59.2 mm), while in Skenderaj, it is 42.2 mm, which is very similar to the ARW 2-km run. It is important to note that the NMM 4-km model calculated maximum hourly precipitation for Skenderaj as 17.1 mm, during the period when the flood occurred. In contrast, the ARW 2-km nested run underestimated the maximum hourly precipitation about 2-fold. The difference is that the two peaks correspond to the location of Istog. Additionally, the total 60-hour accumulated precipitation was 2.5 times higher than that obtained using the NMM 4-km model. The ARW model uses the Thompson, Eidhammer (2014) microphysics scheme, the Yonsei Univ. (YSU) PBL scheme for parameterization of the atmospheric boundary layer (Hong 2010), and a scale- and aerosol-aware convective parameterization scheme (Shin, Hong 2015; Han et al. 2016) for the 18 and 6-km grid. The 2-km run was performed with explicit treatment of convection, avoiding parameterization. On the other hand, the NMM 4-km run utilizes the Thompson microphysics scheme without convection parameterization. It is evident that the ARW model better reproduced the spatial distribution of total precipitation amounts, while the NMM model more accurately detected the relative precipitation intensities. As for the snowfall shown over the accumulated 24, 48, and 60 hours, it is evident that during the first 24 hours, snowfall occurs over the Alps, central parts of the Apennine Peninsula, and the Dinarides. In the next 24 hours, snow accumulates over the northwestern parts of Kosovo, western Macedonia, and toward Greece. With the passage of the cold front, a larger portion of the central Balkans experienced increased snow accumulation.
4.2. Prototype evaluation of a multi-source hydrometeorological flood early warning system
To demonstrate the capabilities of the newly developed early warning methodology, a prototype hydrometeorological flood alert system was applied to a significant precipitation event that affected Kosovo on January 18-19, 2023. This system integrates high-resolution numerical weather prediction outputs with key hydrological and geomorphological parameters to assess flood potential with improved spatial and temporal accuracy.
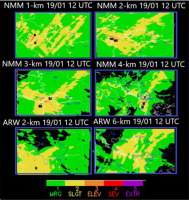
The geo-hazard mapping framework was designed to evaluate flood susceptibility based on cumulative impacts from both prolonged stratiform and short-duration convective rainfall. The Novel Thunderstorm Alert System (NOTHAS) (Spiridonov et al. 2021, 2022, 2023) was used to forecast convective activity and issue corresponding alerts. Numerical experiments revealed that NOTHAS, running at a 4 km spatial resolution with a 36-hour lead time, effectively identified zones of significant instability. As shown in Figure 7, a Level 3 flood alert was issued across much of Kosovo during the peak rainfall period on January 19, capturing the critical timing and spatial extent of the event. In parallel, alternative model configurations also detected areas of potential localized flooding, although some underestimations were noted – particularly in simulations using the NMM model with smaller domain coverage. These results emphasize the importance of domain configuration and model selection in operational forecasting. To enhance the precision of flood risk evaluation, additional analysis was conducted using a flood risk potential mapping (FRPM) algorithm. This tool integrates WRF-ARW model outputs with geospatial data including terrain slope, digital elevation models (DEMs), drainage density, river proximity, land use characteristics, soil types, and dynamic hydrological indicators such as river discharge, runoff, and snow water equivalent. By combining these multiple data sources, the FRPM algorithm generates spatially resolved flood risk maps, as illustrated in Figure 8, offering a robust foundation for early warning and impact assessment. Together, these prototype results illustrate the utility of a coupled meteorological and hydrological alert system, supporting real-time flood preparedness and mitigation planning.
Fig. 5.
NMM forecast of total accumulated rain (upper) and snow (lower) in mm for southeastern Europe, with 24, 48, and 60 hours lead time. The model was initialized on January 18, 2023, at 00 UTC.
4.3. Comparative analysis and verification
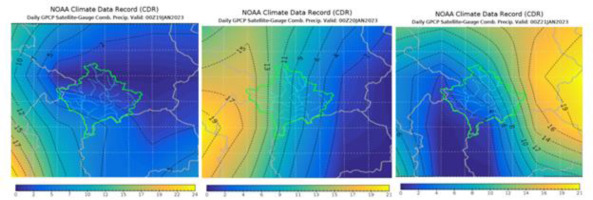
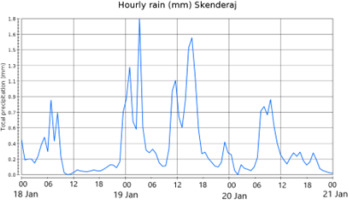
To assess the reliability of the flood forecasting system, a comparative analysis was performed between the numerical simulations and the European Flood Awareness System (EFAS) platform outputs. The results showed strong agreement with the observed precipitation fields (Fig. 9a), providing a solid foundation for integrating additional parameters influencing flood dynamics. The ARW nested run at 2 km resolution produced more detailed rainfall patterns, capturing areas of maximum precipitation. Although the EFAS flood alert system primarily represents 24-hour observed precipitation, the spatial distribution of rainfall was accurately depicted in other simulations, despite some underestimation of total precipitation, particularly in the NMM 4-km run. Combined daily GPCP satellite-gauge data for Kosovo and ERA5 hourly time-series data were used for verification of simulated precipitation and temporal intensities (Fig. 9b). The EFAS system, particularly for January 19 and 20, 2023 (Fig. 9b), highlighted Skenderaj as a high-risk area between downstream regions along the White Drin and Ibar Rivers. This zone was identified as having a high probability of exceeding the 5-year maximum precipitation threshold, providing valuable insights into flood formation and propagation.
Fig. 8.
Flood potential risk mapping and impact assessment of Kosovo, based on the WRF-ARW model. Valid: 00Z18JAN2023 00:00 UTC at 12-hour intervals.
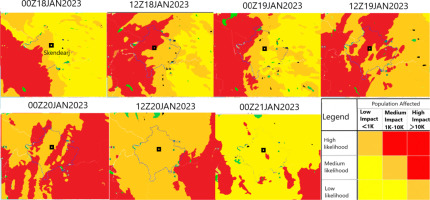
Fig. 9a.
Observed precipitation (mm). European Flood Awareness System (EFAS). Valid: 19-21 Jan 2023, 00:00 UTC.

Fig. 9b.
Daily GPCP Satellite-Gauge Comb. Precipitation from NOAA. European Flood Awareness System (EFAS). Valid: 19-21 Jan 2023, 00:00 UTC.
A comparison of the newly developed flood risk system with the EFAS impact assessment revealed a strong correlation between the two, particularly for high-risk areas from January 18 to 20, 2023 (Fig. 9c). The initial results were promising, demonstrating agreement in flood risk identification. However, further model sensitivity studies are necessary to refine geomorphological factor assessments and tests across different geographical regions and flash-flood scenarios, enhancing the robustness and predictive accuracy of the flood risk system.
Fig. 9c.
ERA5 hourly time-series data on single levels from 18/01/2023 00:00 to 21/01/2023 00:00. European Flood Awareness System (EFAS). Valid: 19-21 Jan 2023, 00:00 UTC.
Regarding flood risk probabilities, the EFAS system, particularly for January 19 and 20, 2023 (Fig. 9d), indicates that the Skenderaj watershed is positioned between high-risk areas downstream along the White Drin River and the lower reaches of the Ibar River. This region exhibits a high probability of exceeding the 5-year maximum total precipitation threshold (red), as derived from the combined ensemble model outputs. In addition to meteorological factors that contributed to flood initiation, this detail may provide further insights into the formation and propagation of flooding in the Skenderaj region. A comparison between the newly developed flood risk mapping system, based on ARW and NMM model outputs and a diagnostic algorithm that incorporates both meteorological and hydro-geological parameters, reveals a strong correlation with the EFAS impact assessment for the same analysis period (Fig. 9e). The initial results are highly encouraging, demonstrating a clear agreement in high-risk areas from January 18, 2023, 12 UTC to January 20, 2023, 00 UTC.
Fig. 9d.
Flood probability and threshold level exceedance ongoing. European Flood Awareness System (EFAS). Valid: 19-21 Jan 2023, 00:00 UTC.
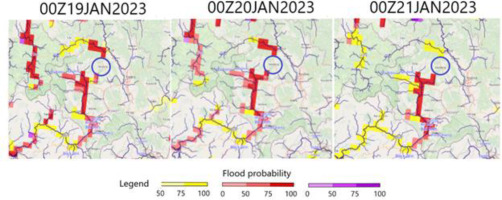
Fig. 9e.
Rapid impact assessment. Layers show the main catchments and major rivers in the central domain of Kosovo. European Flood Awareness System (EFAS). Valid: 19-21 Jan 2023, 00:00 UTC.
However, to obtain more reliable results, further model sensitivity studies are necessary, incorporating a more detailed assessment of geomorphological factors and testing across different geographical regions and flash flooding case studies. These steps will enhance the robustness and predictive accuracy of the flood risk assessment system.
5. Conclusions
This study provides a comprehensive assessment of the January 2023 extreme rainfall event in Kosovo, with a focus on enhancing early warning capabilities through the integration of meteorological and hydrological modeling. High-resolution simulations using the 2-km WRF-ARW model more accurately captured the spatial and temporal dynamics of precipitation – particularly over localities such as Skenderaj and Istog – compared to coarser simulations, which tended to underestimate peak rainfall intensities and their timing.
The 4-km WRF-NMM model contributed to a broader understanding of precipitation distribution across southeastern Europe, but lacked the spatial precision needed for effective flash flood detection at the small catchment scale. Differences in model performance were linked to domain resolution, microphysical parameterizations, and representation of convective processes. A series of numerical experiments was conducted to examine model sensitivity to various configurations, including the model core used (ARW vs. NMM), initialization method (nested versus single-domain deterministic runs), scalability of atmospheric processes (in terms of spatial and temporal resolution), and the selection of microphysical and convective schemes. These experiments helped identify key drivers of simulation accuracy, especially in small, flood-prone catchments.
Hydrological analyses revealed elevated surface runoff, increased soil saturation, and peak river discharge across critical areas, reflecting the strong coupling between atmospheric forcing and catchment response. Particularly in the Skenderaj watershed, hydrological indicators suggested heightened flash flood potential, even in the absence of major river channels. This emphasizes the importance of refined diagnostic tools for flash flood detection in small basins.
A key contribution of this study is the development of a probabilistic flash flood forecasting methodology based on a cumulative distribution function (CDF) that integrates key hydrological variables – such as river discharge, runoff, drainage density, terrain slope, and soil moisture – with meteorological output from the WRF-ARW model. By calibrating threshold values that represent the combined atmospheric and hydrological drivers of flash floods, the framework enables impact-based flood categorization tailored to local-scale dynamics, with effectiveness demonstrated in the Skenderaj basin. The incorporation of NOTHAS and GIS-based geo-hazard mapping further improved the spatial localization of high-risk zones. Comparative validation against EFAS forecasts confirmed the reliability of the simulations, demonstrating consistency in both the intensity and spatial extent of the event.
Unlike traditional flood forecasting methods that often rely on deterministic hydrological modeling or river stage thresholds, the proposed CDF-based system offers a more adaptive and probabilistic approach that accounts for multiple interacting drivers of flash floods. This approach is particularly valuable for data-scarce, small catchments where real-time measurements are limited and forecast uncertainty is high.
This research introduces a novel approach for coupling meteorological simulations with hydrology-based alert algorithms. It highlights the value of integrated risk metrics grounded in hydrometeorological principles, particularly for early warning in small and vulnerable catchments. However, further case studies and numerical experiments are essential to test robustness across diverse events and hydrological settings before this methodology can be considered for operational use by water management and crisis response agencies in Kosovo. The findings represent a promising step toward localized, data-driven flood forecasting systems, with strong potential for real-time implementation in disaster risk reduction frameworks.

