1. Introduction
The fluvial regime includes the general flow and performance of a river under natural circumstances, whereas the flood regime clearly highlights on the patterns and effectiveness of floods within a river. Both the notions are significant for understanding and managing rivers, their natural settings, and their impact on channel forms and processes. Incidentally, fluvial geomorphology is the study of interactions between river channel forms and processes at a range of space and time scales (Charlton 2008). The channel form and the processes of erosion and transportation in a river are closely associated with the fluvial and flood regimes, i.e. to the flow which they convey (Leopold et al. 1964; Schumm 1977). Flood geomorphology is concerned with the processes, forms, effects, and causes of floods (Baker et al. 1988). In certain hydro geomorphic environments, such as the seasonal tropics, floods play a leading role in shaping the river channel and the landscape (Wohl 1992; Gupta 1995). Flood hydrology is essentially concerned with the quantification of hydrological processes and divination of floods. Flood hydrology, over the last one hundred years, has passed across an early observation phase, subsequently a stage of quantification of hydrological processes, and then the current phase of development and appliance of methodologies for predicting floods (Chow 1964; Baker 1994). In current years, the bulk of research has dealt with the prediction of floods of different magnitude by adopting a variety of approaches. Usually, three main flood-prediction techniques, specifically deterministic, probabilistic and empirical techniques, have been employed in flood hydrology (Ward 1978). The phenomenon of flooding is a natural event which can be regarded as a natural feedback mechanism in order to continue the natural life cycle (Seth 1998). The building of a dam transversely on a river transforms the normal river reach into a stationary water body (Gopal 2016). This alters the hydrological regime of the river in terms of magnitude, frequency, extent, timing and the rate of changes in the flow characteristics. Such modifications in fluvial and flood regimes affect the ecological processes that control the functioning of fluvial ecosystem (Renofalt et al. 2010; Brauman et al. 2007). The objective of this paper is to understand the fluvial and flood regime characteristics of the Kaveri River of southern India and to apprehend the role of the construction of dams across the river and its tributaries on its regime characteristics. Around 96 dams have been constructed in the Kaveri Basin during the last 1000 years (Ekka et al. 2022).
2. Geomorphological and hydrological settings
The Kaveri (also spelled Cauvery) River is a sacred river in southern India and the oldest river in India. It drains a catchment area of 81,155 km2 (Fig. 1). It rises in the Western Ghat at an elevation of 1341 m at Talakaveri in the Karnataka State. The river has the fifth largest drainage area in peninsular India, exceeded only by the Godavari, the Krishna, the Mahanadi, the Narmada Rivers. It flows for 800 km, from NW to SE, through the states of Karnataka, Tamil Nadu, Kerala, and Puducherry, and drains in to the Bay of Bengal. The basin is predominantly underlain by Archean-Proterozoic crystalline rocks, such as gneisses, charnockites and granites (Sharma, Rajamani 2001; Valdiya 2001). Quaternary sediments are predominant on the Tamil Nadu plains in the eastern part of the basin. Several N-S and E-W striking lineaments, faults, and shear zones characterize the catchment and the adjoining basins (Vaidyanadhan 1971; Valdiya 2001; Ramaswamy 2006). The basin is elongated in shape.
Fig. 1.
Physiography of the Kaveri Basin and location of sites; 1 – Napoklu; 2 – Kudige; 3 – Chunchunkatte; 4 – Krishna Raja Sagara (KRS) Dam; 5 – Kollegal; 6 – Biligundulu; 7 – Mettur Dam; 8 – Urachikottai; 9 – Bhavani Bridge; 10 – Kodumudi; 11 – Kattalai Barriage; 12 – Musiri; 13 – Upper Anicut; 14 – Tiruchilapalli; 15 – Grand Anicut; 16 – Sakleshpur; 17 – M.H. Halli; 18 – Akkihebbal; 19 – K.M. Vadi; 20 – Muthankera; 21 – T. Narasipur; 22 – Bendrahalli; 23 – Kudlur; 24 – Sevanur; 25 – Thengumarahada; 26 – Nellithurai; 27 – Bhavanisagar Dam; 28 – Savandapur; 29 – Gandhavayal; 30 – Alandurai; 31 – E-Mangalam; 32 – Nallamaranpatty; 33 – Thimmanahalli; 34 – T.K. Halli; 35 – T. Bekuppe; 36 – Hogenakkal; 37 – Thoppur; 38 – Thevur.
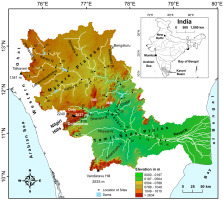
Two major topographic domains are recognized in the Kaveri Basin: (1) the elevated, low-relief Mysore Plateau with broad valleys and low-gradient streams in the west and (2) the fluvial-deltaic plains (known as the Tamil Nadu plains) to the east (Kale et al. 2014). Several residual hills and inselbergs characterize the Tamil Nadu plains. Between these two domains, there is a series of block mountains, including the Nilgiri, the Biligirirangan (BR), and the Mahadeswaramalai (MM) Hill Ranges and the Sheveroy Hill of Eastern Ghat. It is interested to note that none of the major tributaries joins the left bank in the Tamil Nadu plains.
The climate over the basin is monsoonal. The average annual rainfall of the basin is ~1172 mm (Pagare et al. 2025) (which from >2500 mm in the Western Ghat; headwaters) to ~700 mm in the lower reaches (Kale et al. 2014). Due to the orographic effect, the areas of high rainfall totals are confined to the Western Ghat zone as well as over the BR-MM hill ranges. Over three-fourth of the annual rainfall and runoff occurs during the southwest monsoon season and about 85% of the annual sediments load is carried during the wet season (Vaithiyanathan et al. 1992). The average annual runoff of the basin is about 21.4 km3 (CWC 2020), which is significantly lower than those of the other large rivers of the Indian peninsula, such as the Godavari (111 km3), the Krishna (78 km3), the Mahanadi (67 km3) and the Narmada (46 km3), implying very low unit discharges and rates of denudation.
3. Data and methodology
The channel forms and processes of erosion and transportation in a river are closely associated with the fluvial and flood regimes. Therefore, the daily, monthly and annual maximum series (AMS) data of the Kaveri River and its major tributaries are collected from the Central Water Commission (CWC 2020). The discharge regime, best conveyed by a mean annual hydrograph, is usually based on long-term records (20-30 years) of mean monthly discharge data (Shaw 1988). In the presence of such long gauge records for the selected sites on the Kaveri River, mean annual hydrographs are drawn on the basis of mean monthly discharge data for 40 to 48 years. Further, to enhance understanding about the daily variations in discharge on the Kaveri River, the daily discharge data for one water year (June 2018 to May 2019) are graphically portrayed. Although the 2018-2019 water year happens to be a wet monsoon year, the choice of the water year was merely based on the availability of daily discharge data for a number of sites in the Kaveri Basin. A flood, in a general sense, is defined as a rise in the water level/stage or discharge that results in the overtopping of natural or artificial banks of a stream (Rostvedt et al. 1968, cf. Ward 1978). In hydrology, a flood may be any relatively high water level or discharge above a pre-determined flood level or discharge magnitude (Ward 1978). The measured instantaneous peak flood discharges constitute one of the most important datasets for hydrologists, engineers, environmental planners and geomorphologists. Hydrologists define the highest peak discharge recorded in each year for a series of years at a gauging site as annual peak discharge series or annual maximum series (AMS) (Ward 1978). The AMS data of six sites on the Kaveri River and eight sites on its tributaries have been used to understand flood regime characteristics. First, the AMS data are presented in the form of time series plots to interpret in the interannual variations in the annual peak flood magnitudes. Moreover, in order to further highlight the extent of variability in peak discharges from one year to other, deviations from mean annual peaks have been shown graphically. Second, to reduce and summarize the characteristics of floods, simple statistical analyses of AMS data are carried out. Commonly-used statistical parameters such as average, variability, skewness (Cs), coefficient of variation (Cv), Cs/Cv ratio, etc. are calculated to understand flood regime conditions of the river. In addition to this, the flash flood magnitude index (FFMI) and unit discharges are derived to evaluate the variability and the potential of large floods on the Kaveri River and its tributaries. Furthermore, unit discharges are calculated and used to construct an envelope curve for the Kaveri Basin. Flood hydrographs are constructed to understand the characteristics of the floods of the river and its tributaries. The maps used for the present study are based on the analysis of ca. 30-m resolution SRTM-DEM data processed in ArcGIS Desktop: Release 10.8.
4. Results and discussion
4.1. Fluvial regime characteristics
The Kaveri River has the unique locational advantage in the sense that its upper catchment area receives rainfall during summer from the southwest monsoon, and the lower catchment area during the winter season from the retreating northeast monsoon. Like other monsoon-dominated rivers, the Kaveri River also shows changes in discharge characteristics from year to year as well as from season to season. Nevertheless, the interannual and inter-seasonal variations in discharge shows a distinct average annual pattern of variations which is best displayed by the mean annual hydrographs. The mean annual hydrographs provide a good idea about the periods of high and low flows as well as the range of streamflows in a river during a year (Shaw 1988). Such graphs have been constructed for a few stations to understand the main features of the fluvial regime of the Kaveri River and its tributaries.
4.1.1. Mean annual flow pattern
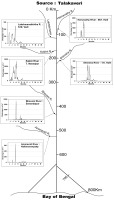
The mean annual flow pattern of six sites on the Kaveri River and three sites on its major tributaries are based on 40 to 48 years of data and given in Figure 2 and Table 1. A cursory examination of the mean annual hydrographs indicates that the annual flow pattern reflects the seasonal rhythm of the monsoon rainfall plus water released from reservoirs during the non-monsoon season. There is flow in the monsoon months (June to November) and it dwindles in non-monsoon months (December to May). The highest flows occur at all the sites in between July and September except at Savandapur and Nellithurai site on the Bhavani River. By this time, maximum annual rainfall is received by the basin and the soils are fully saturated. Hence, even unexceptional heavy rains produce high runoff. The lower mean flows at Savandapur is attributed to the Lower Bhavani Reservoir and, at Nellithurai, is ascribed to several small dams on the Bhavani River upstream of this site. The peak mean flows are observed at the Kollegal and Biligundulu sites in the month of August. Both the sites are located downstream of the second largest dam on the Kaveri River, i.e. Krishna Raja Sagar (KRS) Dam. Therefore, the mean annual flow at these two sites is controlled by this dam. However, the flow regime of the Kodumudi, Musiri and Urachikottai sites is regulated by Mettur Dam which is the largest dam on the Kaveri River. The mean peak flows at these sites are observed in the month of August. This pattern is expected because water is stored in the Mettur Dam in the month of July.
Fig. 2.
Flow regime of the Kaveri River and its major tributaries; See Figure 1 for location of sites.
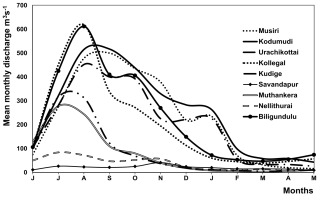
Table 1.
Flow characteristics of the Kaveri River and its major tributaries with gauging sites. (Averages of the monthly mean discharges m3s-1 (1971-2019; 40 to 48 years of record)).
[i] J-D – January to December; A.T. (J-M) – Annual Total (June-May); M.T. (J-N) – Monsoon Total (June-November); N.M.T. (D-M) – Non-Monsoon Total (December-May); M.A.F. (J-M) – Mean Annual Flow (June-May); M.M.F. (J-N) – Mean Monsoon Flow (June-November) N.M.F. – Non-Monsoon Flow; M.F. (J-N) – Monsoon Flow (June-November); N.M.F. (D-M) – Non-Monsoon Flow (December-May); Data source: CWC; See Figure 1 for location of sites.
The nature of mean annual hydrographs for all the sites on the Kaveri River suggests that the contribution of groundwater to the streams during the dry season is generally negligible. This means that most of the geomorphic work of erosion and transportation is confined during the monsoon months of the year and the maximum geomorphic work is accomplished in the months of July and August.
Mean annual hydrographs give an average picture; however, the diurnal variations in discharge are insufficiently expressed by such graphs. Therefore, to get an idea about the nature of changes in the daily discharges during the wet season, the diurnal discharge for one water year (June 2018 to May 2019) has been plotted in Figure 3 and 4. The figures clearly indicate that the wet period (June to November) is characterized by multiple, short and sharp flood peaks. For some sites on the Kaveri River, the discharge may vary by as much as 2500 to 7500 m3s-1 in a single day; for instance, at the Musiri site. As expected, it is interesting to note that all peak flows match from the upstream to downstream gauging sites.
The average flow characteristics of six sites on the Kaveri River and eight sites on the tributaries are given in Table 1. The analysis show that the monsoon flows range between 60% and 95%. On the other hand, non-monsoon flows vary between 5 and 40%. The table also indicates that the Kaveri River, as well as its largest tributary, the Kabini, experiences high discharge in the months of July to October. The percentage of non-monsoon flows are invariably less than 25% in the case of all the sites on the Kaveri River and its tributaries, except the Bhavani River at Savandapur (Non-monsoon flow is 40%). This is attributed to the release of water from the Lower Bhavani Reservoir during the non-monsoon season. The average flow characteristics clearly reveal that the geomorphic work of erosion and transportation is confined during the monsoon months of the year, i.e. from June to November. However, the maximum geomorphic work is accomplished in the months of July and August. The mean annual flow pattern of the Tap i and Mahi Rivers of central India specify that the rivers experience over 90% of the annual flows during the monsoon season (June to October), and during the dry season (November to May) the flow magnitude is very low (Hire 2000; Pawar 2019). It shows a slightly dissimilar pattern of monsoon rainfall.
4.2. Flood regime characteristics
It is evident from the above discussion that the monsoon regime plays a role of considerable importance in determining the fluvial regime conditions of the river under study. However, the usefulness of discharge regime characteristics is limited for geomorphological purposes because it is based on monthly means. Most of the geomorphic work in seasonal tropics is accomplished by individual flood events, which are not sufficiently signified by monthly means. Research on some large Indian rivers demonstrate that the channel morphology and fluvial processes are related to very large but relatively infrequent flood events (Goswami 1985; Kale et al. 1994; Gupta 1995; Gupta et al. 1999; Hire 2000; Pawar 2019; Patil 2017; Patil et al. 2024a, 2024b). Therefore, an attempt has been made to understand the magnitude, variability and frequency characteristics of individual floods on the Kaveri River and its tributaries on the basis of available annual peak discharge data.
4.2.1. Interannual variability in annual peak discharges
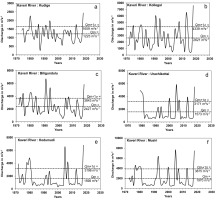
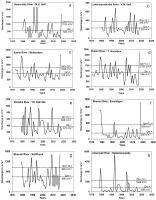
The temporal patterns of variation in the annual peak discharges at six sites on the Kaveri River and eight sites on its tributaries are illustrated in Figures 5 and 6. All graphs reveal a high interannual variability in the annual peak discharges. The figures also show the occurrence of a very few large events during the gauge period.
4.2.2 Average magnitude and variability of floods
The available gauged data indicate that the mean discharges range between 299 and 2621 m3s-1 on a tributary of the Kaveri River, namely Lakshmanathirtha at the K.M. Vadi, and at the Kollegal site on the mainstream, respectively (Tab. 2). According to Kochel (1988) floods that are likely to cause significant geomorphic change are those that produce discharges many times above the mean flows experienced by a river. This can be simply established by estimating the Qmax/Qm ratio. Table 2 demonstrates that, for most sites, the Qmax/Qm ratio varies between 2 and 10. This specifies that maximum annual peak discharges (Qmax) are 2 to 10 times higher than average peaks, since the more variable the flow is, the more important the higher discharges become (Wolman, Miller 1960). The effect of such extreme flows on geomorphic activity in channel is unquestionably noteworthy. It is interesting to note that the Amaravati River at Nallamaranpatty site shows that the maximum annual peak discharge is about 10 times higher than the mean annual peak discharge. Therefore, this Qmax would have caused remarkable geomorphic changes in the channel of the Amaravati River.
Table 2.
Flood flow characteristics of the Kaveri River and its major tributaries.
[i] Qmin – Minimum annual peak discharge; Qmax – Maximum annual peak discharge; Qm – Mean annual peak discharge; A – Catchment area; RL – Record Length; Data source: CWC; See Figure 1 for location of sites.
Besides the Qmax/Qm ratio, the coefficient of variation (Cv) is another useful measure of variability in the annual peak discharges. The Cv is the ratio between the standard deviation and the mean. The Cv(s) for the sites under investigation range between 0.36 and 1.89 (or 36 to 189%) which shows low to very high variability in the AMS (Tab. 3). As per earlier discussion, as expected, the Cv of the Amaravati River at Nallamaranpatty is maximum.
Table 3.
Discharge characteristics of the Kaveri River and its major tributaries.
[i] Qmax – Maximum annual peak discharge; Qm – Mean annual peak discharge; σ – Standard deviation: Cv – Coefficient of variation: Cs – Coefficient of skewness; RL – Record length. See Figure 1 for location of sites; data source: CWC.
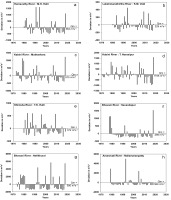
In order to further highlight the extent of variability in peak discharges from one year to other, deviations from mean annual peaks have been shown graphically for a few sites (Fig. 7 and 8). The plots confirm the highly variable nature of flows in the Kaveri Basin. Nevertheless, an interesting fact reflected by the graphs is the positive departures from the mean. The positive departures are much higher than the negative. It is an imperative characteristic of AMS. Further, mean is strongly affected by a few large magnitude floods.
Fig. 7.
Departure from mean annual peak discharge on the Kaveri River; See Figure 1 for location of sites.
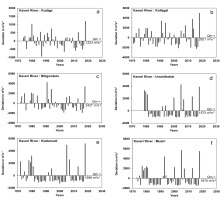
Fig. 8.
Departure from mean annual peak discharge on the tributaries of the Kaveri River; See Figure 1 for location of sites.
In addition to this, numerous workers have used the Beard’s flash flood magnitude index (FFMI) to assess the variability of floods measured as an index of flood flashiness (Baker 1977). The FFMI values are computed from the standard deviation of logarithms of AMS as given below:
where, X = Xm – Qm, Xm – annual maximum event, Qm – mean annual peak discharge, N – number of years of record (X, Xm, and Qm expressed as logarithms to the base of 10).
FFMI values approaching 1.0 indicate a high propensity for flash floods accompanied by geomorphic changes within the basin (Kochel 1988). Nevertheless, the FFMI values observed in the Kaveri River Basin remain moderate. The values range from 0.16 to 0.61 (Tab. 4), with a basin-wide mean of 0.32, which is slightly above the global mean of 0.28 (McMahon et al. 1992; Erskine, Livingstone 1999). The highest value is observed on the Amaravati River at the Nallamaranpatty site which is 0.61. It is attributed to the very high positive departures from the mean annual peak discharge (Fig. 8h). Notably, none of the sites on the mainstream Kaveri River exceed a value of 0.36, suggesting the absence of flash flood events during the period of systematic data collection.
Table 4.
Flash flood magnitude indices of the Kaveri River and its tributaries.
[i] FFMI – Flash flood magnitude index; See Figure 1 for location of sites.
4.2.3. Skewness
The skewness is properly designated as the coefficient of skewness (Cs), which is the utmost widely used measure of moments in geomorphological and hydrological studies of floods. A recognisable fact is that the AMS data are not normally distributed. Thus, it is inevitable to calculate the Cs of the AMS data. The values of Cs for all the discharge gauging sites on the Kaveri River and its major tributaries are positive, extending from 0.55 to 3.39 (Tab. 3). The Cs figures achieved for other large Indian rivers (Sakthivadivel, Raghupathy 1978) are analogous with the Cs values derived for the Kaveri River and its tributaries. The positive Cs values recommend the existence of one or two (or a few) large magnitude floods during the period of systematic observations. However, the value of Cs is dubious when it is derived from less than 50 years of observations (Viessman et al. 1989). In addition to this, the ratio of skewness and coefficient of variation (Cs/Cv) has also been used by some hydrologists to substantiate the gradation of skewness (Shaligram, Lele 1978). The values of this ratio for various gauging sites in the Kaveri Basin fluctuate between 1.29 and 3.40. The highest value of the quotient has been observed for the Kabini River at the Muthankera site. The values of this quotient for some of the sites on the Tapi River in central India range from 0.93 to 2.84 (Patil et al. 2024b). The Cs/Cv quotients are more than 2.0 for most large Indian rivers (Shaligram, Lele 1978). However, for most of the sites on the Kaveri River and its tributaries, this ratio is less than two except two sites, namely Muthankera on the Kabini River and K.M. Vadi on the Lakshmanathirtha River. The derivation of this quotient, subsequently, verifies that the distribution of AMS for the Kaveri Basin is not very skewed.
4.2.4. Unit discharge
Unit discharge is an additional significant measure that indicates the likelihood of high magnitude floods on a river (Gupta 1988). The quotient of unit discharge is derived by dividing the maximum annual peak discharge (Qmax) with the upstream catchment area (A). It provides the water yield (or discharge) per unit basin (drainage) area and is expressed in terms of m3s-1km-2. The unit discharges computed for the sites in the Kaveri Basin vary between 0.02 and 1.71 m3s-1km-2 (Tab. 5). The supreme unit discharge is witnessed on the Kabini River at Muthankera site for the 2018 large magnitude flood. An examination of the unit discharges of the Kaveri and Tapi Basins as a whole are 0.18 and 0.65 m3s-1km-2 respectively (Hire 2000; Patil et al. 2024b). It is interesting to note that the unit discharge of the entire Kaveri Basin (0.18 m3s-1km-2) is very low when compared with other Indian rivers with comparable drainage basin areas.
4.2.5. Discharge-area envelope curve
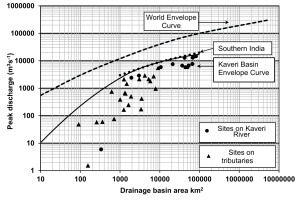
The highest ever produced flood in a drainage area is commonly presumed to be a magnitude of the prospective flow for geomorphic effectiveness (Costa, O'Connor 1995). Exceptionally high magnitude floods indexed by drainage area or return period are supposed to produce enormous powers – sufficient to cause long-lasting alterations in the river channel and morphology of valley. However, under specified hydro-climatic circumstances there is a higher physical boundary to the large magnitude floods that can be produced (Enzel et al. 1993) and, therefore, the supreme conceivable power that can be created. Consequently, to evaluate the prospect of a basin or region producing an extreme probable uttermost flood, regional envelope curves covering the supreme discharges produced in a region have frequently been applied to demarcate the expected upper limits to large magnitude floods (Enzel et al. 1993). This graphical and empirical method is established on two assumptions: (1) that there are physical upper bound limits to amount of precipitation to a basin (Enzel et al. 1993) and: (2) the highest flood per unit drainage area in one basin is expected to be generated in neighbouring basins having analogous hydro-geomorphic circumstances (Mutreja 1995).
Table 5.
Unit discharges of the Kaveri River and its major tributaries.
[i] A = Catchment area; Qmax = Maximum annual peak discharge; See Figure 1 for location of sites.
The discharge-area envelope curve for the Kaveri Basin has been constructed with the support of maximum annual peak discharge (Qmax) data and upstream catchment area (A) available for more than 38 discharge gauging sites in the Kaveri Basin (Tab. 5). The curve is represented in Figure 9. In addition to this, the world envelop curve constructed by Baker (1995) is portrayed in the same diagram for comparison. An assessment with Baker's world envelope curve (Fig. 9) clearly demonstrates that the peak discharges on the Kaveri River and its tributaries are comparatively much smaller in magnitude than the floods produced for the similar drainage basin areas in the other parts of the world. However, a cursory inspection of the envelope curve of southern Indian rivers indicates that the drainages in southern India (including Kaveri) produced similar flood peak discharges. The analysis, therefore, clearly demonstrates that under given meteorologic, hydrologic and geomorphic circumstances, an exceptionally high magnitude of discharges cannot be generated in the Kaveri River and its tributaries. However, further investigations are necessary to find out the floods of greater magnitude that have occurred in the Kaveri Basin.
4.2.6. Flood hydrograph analysis
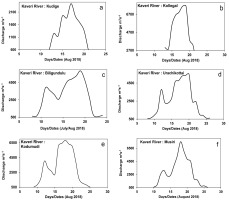
In order to recognize the short-term deviations in flood discharge it is necessary to investigate the nature of the increase and decrease of water level or discharge at-a-station throughout the occurrence of floods. It is accomplished by construction and investigation of flood hydrographs. The flood hydrographs are available for upstream locations such as Kudige, Kollegal, middle reaches namely Biligundulu, Urachikottai, and downstream sites viz. Kodumudi and Musiri on the Kaveri River (Fig. 1). Figure 10 (a-f) shows the flood hydrographs of one of the large-magnitude flood events, i.e. the 2018 flood documented at the gauging sites mentioned above on the Kaveri River. The diagrams illustrate that the specific high magnitude flood events have occurred for a long duration: ranging from 7 to 15 days. This is anticipated in an elongated basin such as the Kaveri. Further, this suggests that the large magnitude flood events on the Kaveri River are long-lasting events and consequently reveal geomorphic efficiency.
5. Conclusions
The fluvial and flood regime investigations of the Kaveri River and its tributaries meaningfully indicate that the monsoon regime and release of water from dams play a role of considerable importance in determining the river regime conditions of the river under study. The seasonal fluctuations in the discharge of the river and its tributaries reflect the distribution of monsoon rainfall. The mean annual hydrographs of the Kaveri River and its tributaries indicate a simple discharge regime with one pronounced peak. Over 60% to 95% of the annual flows occur in the monsoon season and, during the dry season, the flow magnitude dwindles up to 5%. The time series plots of the annual maximum series data reflect high as well as low interannual variability. Slightly high variability is also indicated by the values of coefficient of variation (0.36 to 1.89) and the flash flood magnitude index (0.16 to 0.61). In general, the maximum annual peak discharges are 2 to 10 times higher than the mean annual maximum discharges. All these indices indicate that the river experiences significant geomorphic work during large floods. The positive Cs values recommend the existence of one or two (or a few) large magnitude floods during the period of systematic observations on the Kaveri River and its tributaries. The unit discharge of the entire Kaveri Basin (0.18 m3s-1km-2) is much less when matched with other Indian rivers with comparable drainage basin areas. The analysis of the envelope curve clearly demonstrates that, under given meteorologic, hydrologic and geomorphic circumstances, an exceptionally high magnitude discharge cannot be generated on the Kaveri River and its tributaries. The study of flood hydrographs illustrates that the specific high magnitude flood events occur for a long duration, ranging from 7 to 15 days. Thus, the investigation indicates that the fluvial and flood regime characteristics of the Kaveri River and its tributaries are controlled by monsoonal rainfall pattern and by the release of water from dams.


