1. Introduction
Groundwater plays a crucial role as a drinking water source in rural regions of Pakistan, supporting both human consumption and agriculture. Pakistan is the 4th-largest user of water in the world (agriculture, industry, and domestic sector), and there were indications that current water use, combined with rapid population growth, could lead to water shortages by 2025 (Nawaz, Ali 2018). Indeed, excessive extraction of this resource has resulted in widespread issues with water quantity and quality (Alamgir et al. 2016). Groundwater quality in Pakistan's provinces of Sindh and KP varies significantly, influenced by factors such as industrial activities, agricultural practices, and natural geological conditions. Water, one of the most valuable gifts on earth, is essential for human development and survival, and without it the world would be uninhabitable. As a universal solvent, water has the ability to dissolve biotic and abiotic substances that affect the quality of life for living things (Ali et al. 2019; Panhwar 2022). Pakistan's groundwater is also contaminated with various pollutants such as agricultural chemicals, wastewater, and sewage. Of all of the world’s water, only 0.03% is suitable for human consumption; people depend on groundwater to survive. Water is not only used for drinking, but also for cooking, washing clothes, cleaning homes, irrigating food and other crops, supplying industrial needs, and recreation. Agriculture is one of the largest users of water, and most agricultural production relies on groundwater. Excessive use of groundwater leads to deterioration of soil and groundwater quality (Panhwar 2022). To maintain a healthy ecosystem, water quality must be maintained to meet the needs and goals of users.
In Pakistan, only 20% of the country's population has access to safe drinking water, while the remaining 80% is forced to use polluted water (i.e. groundwater or tap water). Water can be polluted by many things, such as chemicals, fertilizers, industries, and floods. These pollutants affect the quality and quantity of groundwater, making it unusable. Recent studies have shown that groundwater contains high levels of nitrate, arsenic, and fluoride, making it unusable for drinking and irrigation purposes (Adnan, Iqbal 2014). Sanitation, water and hygiene problems also pose a serious threat to the health of the population as the risk of waterborne diseases increases rapidly. Pakistan is among the driest regions globally, with a large portion of its population relying on groundwater to fulfill their water needs for consumption and other purposes. Contamination of groundwater with heavy metals has emerged as a significant concern, with research showing that metals like lead, cadmium, chromium, and nickel are present in many samples at levels exceeding the permissible limits established by the World Health Organization (Masood et al. 2019; Khalid et al. 2020). In Sindh, particularly in urban and industrial areas like Karachi's Sindh Industrial and Trading Estate (SITE), groundwater quality is a significant concern: A study from 24 wells at depths between 100 and 150 feet revealed that the majority of the tested samples were unfit and contained high concentrations of contaminants, including Na, K, Mg, TDS, Ca, Fe and Zn; magnesium concentrations varied from 176 to 1725 mg/L. Heavy metals, i.e. Cr, Pb, Fe, and Zn exceeded WHO limits. Also, Ni, Cd, As, and fluoride concentrations surpassed the acceptable limit. These findings highlight significant contamination, making the water unfit for either drinking or irrigation without proper treatment. Heavy metals such as Pb, Hg, and As are major contaminants in groundwater, primarily due to commercial activities, agricultural practices, and improper disposal of municipal waste. Sindh has the highest levels of As and fluoride contamination, particularly in districts like Sukkur, Karachi, Tharparkar, and Hyderabad. As the population and economy grow, water contamination has become a significant issue. With increasing populations and the growing impact of climate change, access to clean drinking water is rapidly declining, affecting over 785 million people worldwide. Groundwater quality is directly linked to public health, highlighting its importance. In Pakistan, water demand is rising due to industrial expansion and rapid population growth. Industrial wastewater, which contains hazardous substances such as heavy metals and chemicals, is often released directly into water bodies. Additionally, sewage discharge poses a significant threat to groundwater contamination, especially when sewage is improperly handled or disposed of. Landfills and the improper dumping of hazardous waste are also major risks to groundwater and surface water quality. Pakistan generates over 48.5 million tons of solid waste annually, and like many developing countries, faces environmental challenges from inadequate waste disposal systems. In major cities, much of the municipal waste is burned, discarded, or dumped in vacant lots, contributing to health risks for the population and affecting ground and surface water quality (Hassan et al. 2021). The use of contaminated water contributes to 50% of waterborne illnesses and 40% of fatalities in Pakistan, as reported through community health surveys and reviews (Daud et al. 2017). One in five children under 5 years old experiences waterborne illnesses. Diarrheal disease causes mortality among children. Roughly 884 million people worldwide do not have access to safe water and about 1.8 billion people are consuming impure water (Saleem et al. 2018). Almost 800 children die from diarrhea each day because of contaminated water, improper sanitation, and unhygienic activities (Majeed, Munir 2020).
2. Material and methods
2.1. Sampling and its preparation
The 14 sampling sites selected for collection of groundwater samples from KP Province were Kohat, Kurram, Lakki Marwat, Lower Chitral, Lower Dir, Malakand, Mardan, Mansehra, Abbottabad, Charsadah, Dera Ismail Khan, Haripur, Swabi, and Chitral ; 11 sampling sites were selected in Sindh Province: Karachi, Badin, Ghotki, Thatta, Sajawal, Hyderabad, Khairpur, Sukkur, Shikarpur, Mirpurkhas, and Jacobabad. Three samples were collected from each site, with a total of 75 samples collected in bottles using standard sampling procedures. The samples were acidified with a few drops of nitric acid to inhibit microbial activity. Groundwater samples were collected from tube wells and hand pumps at various sampling points using pre-cleaned plastic bottles and transported to the PCSIR laboratories in Karachi for analysis of physicochemical properties and heavy metal parameters following standard procedures. Proper protocols were followed for sample collection, transportation, storage, and chemical analysis. The samples were placed in air-tight plastic bottles and kept in an icebox to maintain their original characteristics.
2.2. Reagents and glassware
Analytical-grade nitric acid (HNO3, 65%), hydrogen peroxide (H2O2, 35%), and other chemicals and reagents were obtained from E. Merck (Darmstadt, Germany). Double-distilled water was utilized throughout the experimental work. Stock standard solutions of corresponding parameters (1000 mg/L) were procured from E. Merck (Darmstadt, Germany) and traceable to the NIST. Working standards were freshly prepared daily by diluting the stock solutions with distilled water. Glassware was cleaned by soaking overnight in 2 M nitric acid. All solutions were stored at 4°C until completion of the analysis.
2.3. Chemical analytical techniques
Readings of each sample were then taken immediately by portable digital pH meter and a conductivity/TDS Meter (JENWAY/E.U/430 pH/cad./portable/02162). Complexometric titration of Ca was done with EDTA. All the other analytical estimates were done within 48 h of sampling.
2.4. Nitrate analysis procedure
Filtered underground water samples were analyzed for nitrate using a UV-spectrophotometric method. Nitrate exhibits strong absorbance at 220 nm, which was measured using a UV–Vis spectrophotometer.
To correct for interference from dissolved organic matter, absorbance at 275 nm was also recorded, and the corrected absorbance was calculated as Aₒ₃⁻ = A220 − 2A275. A calibration curve was prepared using standard nitrate solutions from reagent-grade stocks, and sample concentrations were determined accordingly. This rapid, reagent-free method is suitable for groundwater analysis and has been validated in recent studies (e.g., Wang et al. 2022).
2.5. Metal analytical technique
Trace metals analysis. To analyze trace metals (As, Pb, Cd, Hg, Zn, Fe, Cr, Mn, and Cu), reference standards were made using Merck AAS standards (1000 ppm). The analyses were conducted on a Hitachi Z-5000 spectrophotometer with Zeeman background correction and a graphite furnace, and ZAA (Zeeman atomic absorption spectrophotometer) software to electronically process the results. Pb and Cd were determined using the flameless (ETAAS) electrothermal atomic absorption spectrophotometer, Fe, Cr, and Zn using a flame atomic spectrophotometer (FAAS), As using a hydride formation system, and Hg by the cold vapor technique.
The samples in the analysis of total As were reacted with 20 per cent KI to convert all the arsenate (As+5) to arsenite (As+3). The acid channel 1.2 N HCl was used in the case of the acid channel, and the reducing channel used NaBH4 (1%) in NaOH (0.4). Blanks were treated identically. Each metal was analyzed three times to generate representative results. Recovery studies of ten spiked water samples of each metal provided an indirect measure of accuracy. Reduction of mercury was performed in a Pyrex test tube (diameter 30 mm, length 200 mm, volume 87 mL) fitted with a ball glass filter to aerate the solution. The solution was prepared as per the AAS manual by mixing sulfuric acid and stannous chloride in a 250 ml flask with a known volume of sample. A Hiranuma HG-1 mercury analyzer (cold) was used to measure mercury using a vapor atomic absorption spectrometer with a closed-circulation system. This instrument detected Hg at 253.7 nm.
2.6. Statistical analysis
The data were analyzed in triplicate; calculations, including means and standard deviations, were performed using MS Excel. A correlation matrix of 11 parameters was constructed, and the matrix plot was generated using Minitab. The matrix plot is used to detect correlations, distributions, and potential outliers between several variables. It is widely used in data analysis to quickly visualize and understand complex datasets.
3. Results and discussion
The objective is to provide insights into chemical and metal contamination in drinking water, with the ultimate goal of preventing future epidemics in these and other regions. The quality of water at various sampling sites was evaluated using a matrix to detect correlations, distributions, and potential outliers among different variables.
3.1. Physicochemical analysis
The results are presented in Tables 1 and 2, which list the chemical parameters and heavy metal concentrations in drinking water samples from Sindh and KP Provinces. The results indicate that the samples from groundwater were clear, odorless, and colorless. The pH was within range at all sampling sites from both provinces. A pH of 6.9 was measured in Ghotki, and a pH of 7.86 was observed in Khairpur Sindh Province; these detections were within range of WHO limits. The TDS results from Karachi, Thatta, Sajawal, Khairpur, Mirpurkhas, Jacobabad, Dera Ismail Khan, and Swabi were above the WHO limit. The TDS levels in the present study, conducted in Sindh Province, were also above safe limits recommended by WHO (maximum 1000 mg/L) for drinking water. Calcium levels varied significantly, with a maximum of 248 mg/L in Jacobabad and a minimum in Karachi. In contrast, the Ca content in KP ranged from 19 to 325 mg/L, with levels exceeding those in Sindh drinking water by more than two-fold. The Ca concentrations in KP (19-325 mg/L) were more than twice as high as in Sindh's drinking water.
Table 1.
Chemical analysis of sampling sites of Sindh Province. All samples were analyzed in triplicate and measured in (mg/L).
Table 2.
Chemical analysis of sampling sites of Khyber Pakhtunkhwa Province. Units are expressed in mg/l, analysis done in replicates (n = 3).
The TDS concentrations in Sindh and KP Provinces were found to be twice the safe limits set by the WHO. The concentration of Mg ranged from 20 to 119 mg/L, Cl from 61.2 to 300 mg/L, SO4 from 2.15 to 280 mg/L, HCO3 from 153 to 401 mg/L, and NO3 from 0.82 to 3.17 mg/L, all exceeding WHO's recommended limits. In Sindh Province, Na levels ranged from 55 to 300 mg/L and K from 6.15 to 16.6 mg/L, slightly greater than WHO guidelines. The Ca results from all sampling sites from both provinces indicate that concentrations are above the WHO permissible limit. Although the Na permissible limit was exceeded in all samples from Sindh, samples from KP were within the limit. The K results from all sites were, to some extent, satisfactory, excluding Mirpur Khas and Jacobabad. The chloride results from Ghotki, Sajawal, and Mirpur Khas were above the limit, while other parameters were within the limit. The results are summarized in Table 1.
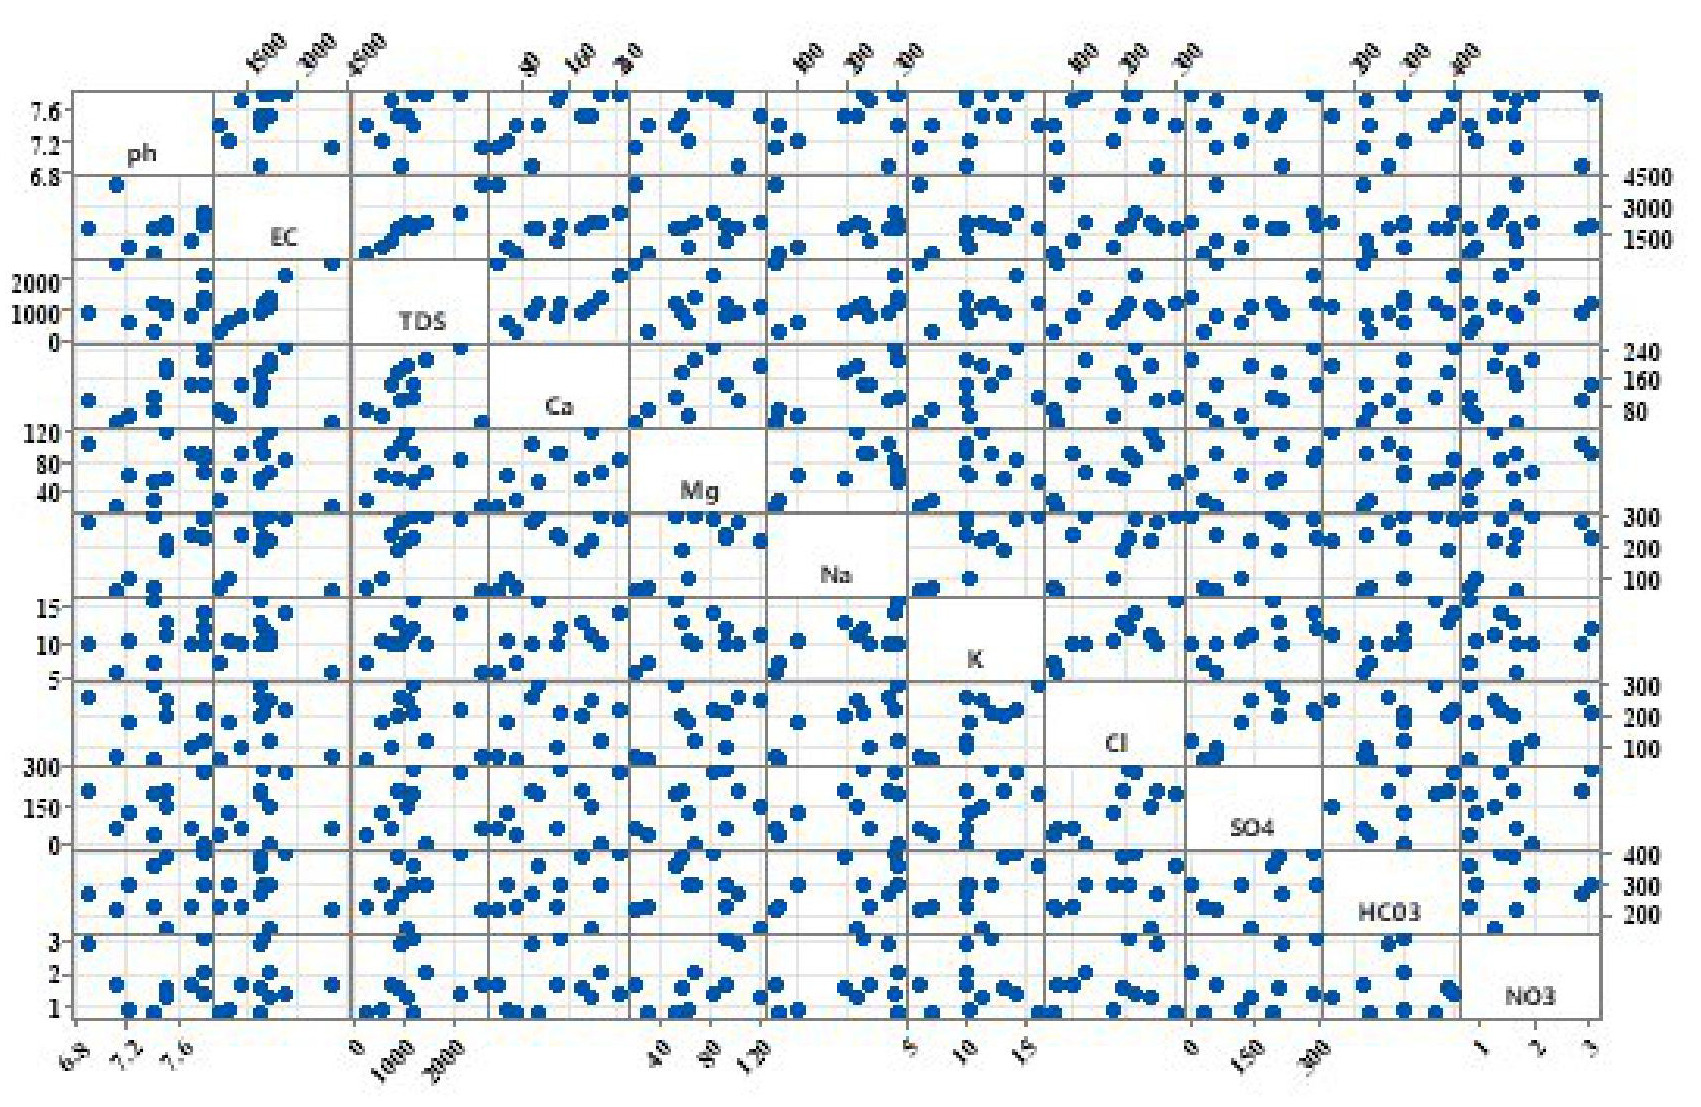
A matrix plot was applied to the chemical analysis data from sampling sites in Sindh Province; 11 parameters were detected, including pH, EC, TDS, Ca, Mg, Na, K, Cl, SO4, HC03, and NO3. A matrix plot is a powerful way to explore the relationships between several variables at once. The matrix plot in Figure 1 shows high concentrations of cations and anions, and these ions have a significant, direct effect on TDS. Nitrate was detected in drinking water in Sindh Province, ranging from 0.8 to 3.1 mg/l. The lowest concentration of NO3 was detected in the MPK. The concentration of NO3 measured in Sindh Province was within WHO safe limits. All the cations and anions in this study occur naturally in the environment and in drinking water.
Fig. 1.
Measurement of several parameters in samples of groundwater in a matrix plot of pH, EC, TDS, Ca, Mg, Na, K, Cl, SO4, HCO3, and NO3.
Sodium concentrations ranged from 5.45 to 20.6 mg/L; the lowest Na was found in the Mansehra District, while the highest Na was in drinking water of the Swabi District. Concentrations of K and Cl ranged from 0.31 to 1.59 mg/L in Chitral, and 3.85 to 46.8 mg/L in Kurram. The lowest K and highest Cl were in Kurram, the highest K in Malakand City, whereas a low concentration of Cl was measured in Chitral. The lowest concentration of SO4 was 43.1 mg/L in Abbottabad; the highest SO4 was 485 mg/L in the Swabi District, which is twice the WHO guideline value, as shown in Table 2. The lowest HCO3 concentration was 12.8 mg/L, measured in the Abbottabad District, and the highest (1165 mg/L) was detected in the Swabi District. The concentration of NO3 ranged from 1.76-11.5 mg/L, with the lowest measured in the Kurram District and the highest in Lower Chitral. The TDS concentration was 1043 mg/L in Dera Ismail Khan and 2157 mg/L in Swabi, both exceeding WHO safe limits. The concentrations of Na, K, Cl, and SO4 were within the limits recommended by WHO. Calcium levels ranged from 19.5 to 325 mg/L in the samples and were slightly above WHO guidelines. The concentrations of Mg ranged from 11.4 to 150 mg/L, the latter of which is three times higher than the WHO limit of 50 mg/L for drinking water.
3.2. Measurement of metal concentrations in the drinking water of Sindh and KP Provinces
With respect to heavy metals results, Sindh Province is in the worst condition, although Pb was excessive in all samples from Sindh and lower Chitral, lower Dir, Malakand, and Abbottabad from KP. The Cd results from all sites were within the permissible limit, excluding lower Chitral. Concentrations of As were detected in much higher quantities in all KP samples, ranging from 0.021 to 5.38 mg/L. In contrast, the samples collected from Karachi, Thatta, Hyderabad, Khairpur, Sukkur, Mirpurkhas, and Jacobabad in Sindh Province were within the range of 0.011 to 0.61 mg/L. The results for Hg in KP sites Kohat, Kurram, lower Chitral, lower Dir, Malakand, Mardan, Mansehra, Abbottabad, Charsadah, D.I. Khan, Haripur, and Swabi were above the WHO permissible limit: 0.0042, 0.0062, 0.0074, 0.0062, 0.0039, 0.0376, 0.0082, 0.0014, 0.0039, 0.0714, 0.0038, 0.0042 ppm respectively; the results from sampling sites in the districts of Sindh were 0.0127, 0.0038, 0.0015,0.0029, 0.0037, 0.0072, 0.0084, 0.0093, 0.0071, 0.0062, 0.0014 ppm of Karachi, Badin, Ghotki, Thatta, Sajawal, Hyderabad, Khairpur, Sukkur, Shikarpur, Mirpurkhas, and Jacobabad respectively. The Cr results were also unsatisfactory from both provinces, excluding Kohat, Malakand, Abbottabad, Karachi, and Shikarpur, while the excess results from the sampling sites were within the range of 0.052-2.94 ppm. Out of 25 samples, 12 were within the range of acceptable Fe concentrations, while 13 samples were beyond the limit with a range of 0.42-3.93ppm. The results for Cu and Zn from all sampling sites were within the permissible WHO limits. For Mn, only 4 samples were within the limit: Kurram, Dera Ismail Khan, Thatta, and Khairpur. The remaining 21 samples were all unfit and beyond the limit, ranging from 0.058-0.652 mg/L as shown in Tables 3 and 4.
Table 3.
Results of heavy metals (mg/L) from sampling sites of Khyber Pakhtunkhwa Province. Samples were analyzed in triplicate (n = 3) and measured in ppm.
Table 4.
Results of essential and heavy metals (mg/L) from sampling sites of Sindh Province. The analysis was done in triplicates (n = 3)
The presence of hazardous chemicals in groundwater has become a significant global environmental concern, particularly concerning toxic heavy metals (He, Li 2020; Liu, Bridget 2020; Rehman et al. 2020; Wang et al. 2022; Wei et al. 2022). Groundwater sample analyses reveal that contamination is primarily caused by excessive use of chemical fertilizers and pesticides in agriculture, improper disposal of industrial waste and untreated sewage into nearby lakes and rivers, and leaking, contaminated water supply pipelines (Raza et al. 2017; Usman et al. 2017). The Thatta and Badin regions of Sindh are especially impacted by saline water intrusion, which depletes freshwater sources and forces local communities to rely on brackish water, and for that reason are afflicted by various dangerous diseases (Hussain et al. 2020). Many studies performed on heavy metals in groundwater and their effects report the presence of chemical substances, with heavy metals having serious effects; websites from Sindh indicated that As had been detected in a couple of the Cd, Fe, and Pb in samples from Chitral Dir and Malakand, Cu in Chitral, even as Zn was also observed in the samples from Chitral and Malakand. The groundwater samples from Lakki Marwat and samples from the Swat Valley confirmed the presence of Cd, Cr, Ni, and Pb (Bibi et al. 2016). Iron is normally present in drinking water, while the rest of the heavy metals have been found in various amounts in exceptional areas of KP (Bibi et al. 2016). In Malakand City, the quality of ingested water, as represented by the physicochemical characteristics, represents a grave risk to the community’s wellness (Nawab et al. 2016). The metallic concentrations in the groundwater of Swat and KP of Cd, Cr, Ni, and Pb have been observed to be higher than the permissible limits set by WHO (2004).
3.3. Analytical quality results
The verification of each proposed method was performed by analysis of Certified Reference Material, a spiking recovery test, repeatability and reproducibility tests, and linearity. The linear standard curve ranged from 5.0 to 10.0 mg/L for Cd, As, Pb, Cr, Mn, and Hg, and for essential metals 0.2 to 1.5 mg/L for Fe, Cu, and Zn, with excellent regression coefficients of 0.9992, 0.9999, and 0.9998, respectively. The limits of detection (LOD) and quantification (LOQ) for each metal were determined as three and ten times the standard deviation of the blank signals (LOD = 3 s, LOQ = 10 s). Reproducibility for the measured results of each sample was below 10% Relative Standard Deviation (RSD).
4. Conclusion
The aim of this study was to assess the quality of groundwater of two provinces; and point out remediation for groundwater quality improvement. This study indicates that anthropological activities are becoming a huge threat to human beings in the 21st century. Both Sindh and KP face significant challenges regarding groundwater quality; in Sindh, industrial activities and natural conditions contribute to high salinity and contamination with heavy metals and other pollutants. In KP, inadequate water treatment and poor sanitation infrastructure lead to microbial contamination. The groundwater quality in the northern part of the country is better compared to the southern part, i.e. Sindh, but in many areas the groundwater quality of the southern parts is in worse condition and not suitable for drinking purposes. This study indicates that there is also a lack of a systematic and proper mechanism for assessing groundwater extractions as per requirements and their results on natural resources. It is essential to protect the groundwater of the study region by taking steps toward greater safety. The masses should be educated, and awareness should be created regarding use and extraction of groundwater as per requirements. Weak enforcement of EPA laws, rules, and shortcomings worsen the condition; the government no longer prioritizes remedies, and the level of commitment to treat wastewater and enhance the quality of water is surprisingly low. The groundwater quality may be constantly monitored throughout the country, in each rural and urban region, by using the participation of local populations to reduce the effects of old agricultural practices on groundwater pollution, and farmers should be skilled in the proper and timely use of pesticides and fertilizers.